. 2014 Mar;22(3):379-85.
doi: 10.1038/ejhg.2013.145. Epub 2013 Jul 17.

An efficient method for long-term room temperature storage of RNA

Affiliations

An efficient method for long-term room temperature storage of RNA

Anne-Lise Fabre et al. Eur J Hum Genet. 2014 Mar.

Abstract

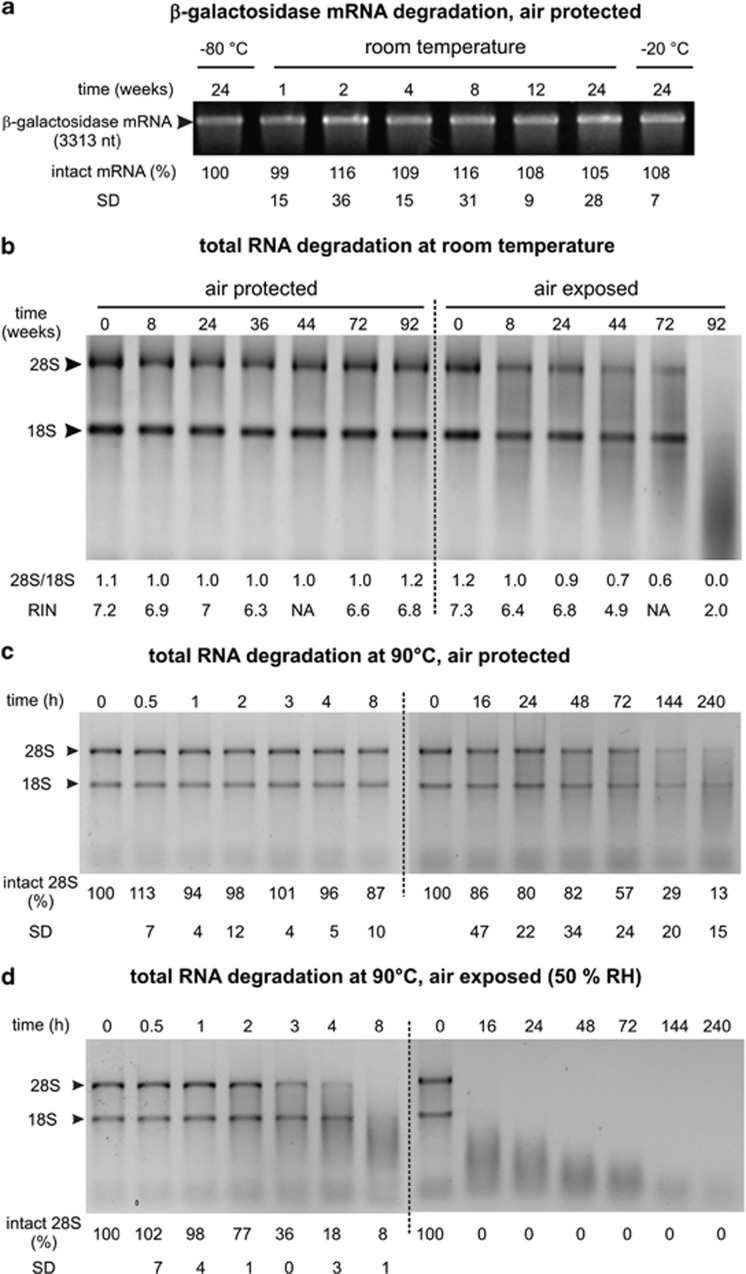
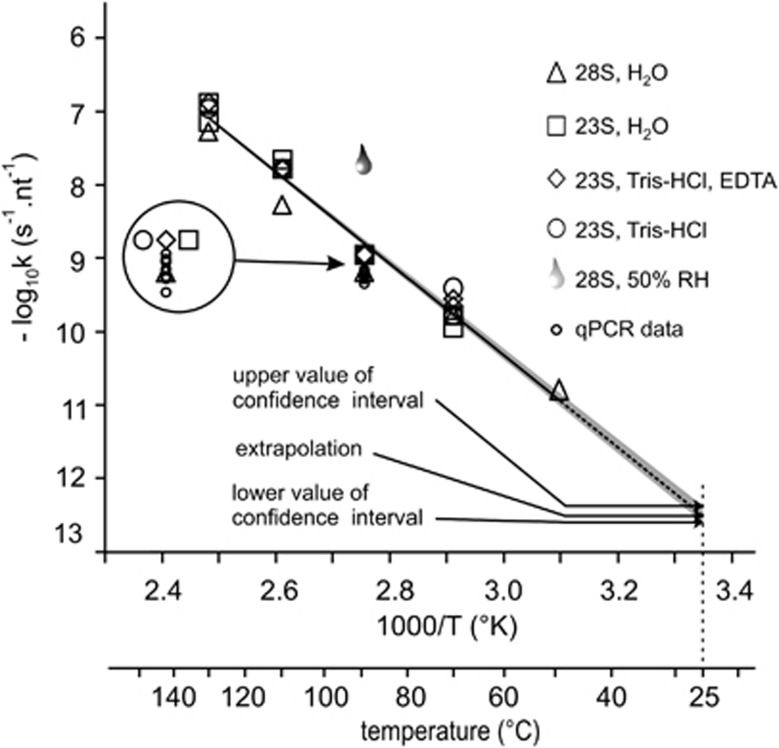
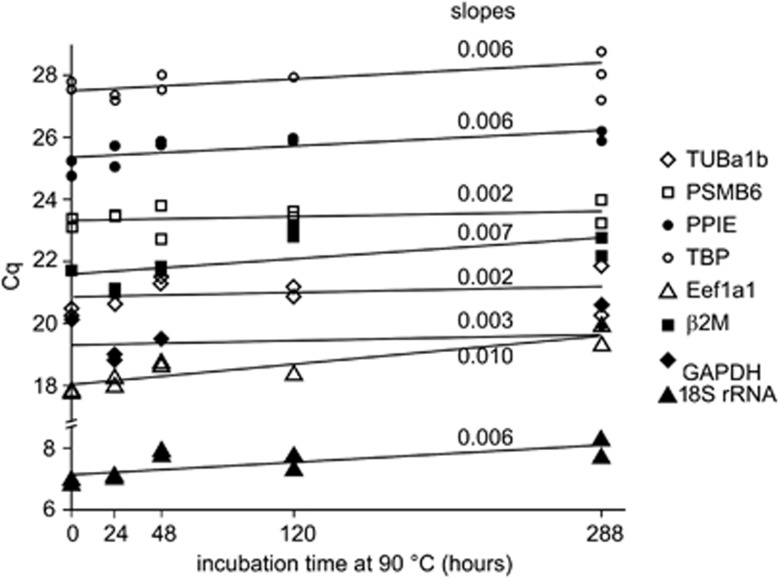
RNA is a tool used in many fields, from molecular and cellular biology to medicine and nanotechnology. For most of these uses, the integrity of RNA is required and must be maintained during storage. Even though freezing is currently the storage method of choice, the increasing number of samples to be stored and the costly use of a cold chain have highlighted the need for room temperature preservation methods. Here, we report a new room temperature technology that consists in drying RNA samples in the presence of a stabilizer in stainless steel minicapsules. These air- and water-tight capsules isolate RNA from the atmosphere and maintain an anhydrous and anoxic environment. Through the evaluation of RNA integrity over time at room temperature or 90 °C, we identified atmospheric humidity as a major deleterious factor. The degradation rate dependence in temperature fitted an Arrhenius model, with an activation energy of 28.5 kcal/mol and an extrapolated room temperature degradation rate of 3.2 10(-13)/nt/s (95% confidence interval: 2.3-4.2/nt/s). In these conditions, it is expected that an RNA molecule will be subjected to 0.7-1.3 cut every 1000 nucleotides per century. In addition, we showed that stored RNA is compatible for further analyses, such as reverse transcription-quantitative PCR. No significant change in the Cq values was observed over a simulated period of several decades. At last, our data are consistent with a sequence-independent degradation rate of RNA in the solid state.


Figures

Figure 1
Figure 1
RNA degradation at room temperature in the presence or absence of a moist atmosphere. β-Galactosidase mRNA samples (a) and total RNA (bd) were dried and encapsulated under anoxic and anhydrous atmosphere. After incubation at room temperature, at −20 °C or at 90 °C, aliquots corresponding to 500 ng of the initial RNA amounts were denatured for 3 min at 75 °C and run on agarose gel. (a) Degradation of HPLC-purified β-galactosidase mRNA. The proportion of undegraded mRNA in minicapsules stored at −20 °C is given under each lane (the experiments were performed in triplicate, but a single representative gel is shown). ‘−80 °C': RNA stored at −80 °C for 24 weeks. ‘−20 °C': RNA in minicapsules stored at −20 °C for 24 weeks. (b) Degradation of total RNA at room temperature. Half of the capsules were opened and exposed to air. The ratios of the fluorescence intensities of 28S rRNA and 18S rRNA as well as the RIN values are given for each sample under the respective lanes. (c) Total RNA degradation at 90 °C in the absence of air (minicapsule conditions). Total RNA samples were dried and stored under anoxic and anhydrous atmosphere in minicapsules. They were heated at 90 °C under 50% relative humidity (RH). Two kinetics were run for 8 h and 240 h. Five hundred nanograms of total RNA samples were analyzed on electrophoresis gels. The proportion of intact 28S molecule, measured by the Bio1D software, is indicated for each time point (the experiments were performed in triplicate; a single representative gel is shown). (d) Same as in (c), but with RNA exposed to air under 50% RH (the experiments were performed in triplicate; a single representative gel is shown).
Figure 2
Figure 2
Degradation rates as a function of RNA length on several mRNA species. Total RNA samples in minicapsules were heated at 90 °C to accelerate aging. Reverse transcription reactions were set up using (dT)18 oligonucleotides. The qPCR reactions were run using a SybrGreen fluorescent dye and transcript-specific oligonucleotides of TBP, β2M, GAPDH, TUBA1B and PSMB6 as described in Materials and Methods (cf Table 1). For each time point, the Cq value was measured and plotted as a function of time t. The relationship Cq=f(t) was linear for each mRNA species (not shown) and allowed the calculation of the degradation rate constants at 90 °C, k. k was plotted as a function of the distance between the 3′ end of the mRNA species (+18 nucleotides) and the 5′ end of the forward primer. The straight line is a linear fit through the data points.
Figure 3
Figure 3
Temperature dependence of the degradation rate constant of RNA stored in the minicapsules plotted according to the Arrhenius model. Degradation rates (k) of 23S rRNA resuspended after purification in water (open squares), Tris-HCl-EDTA (open diamonds) or Tris-HCl only (open circles) and those of 28S rRNA resuspended in water (closed diamond) were determined at temperatures ranging from 50 to 130 °C with R software (28S=5070 nt 23S=2904 nt, mRNA=3313 nt). Degradation rates of five mRNA species were calculated through RT-qPCR reactions (Figure 2). Log10(k) value was plotted as a function of 1/T. Confidence interval (95%) was calculated with R software as described in Methods. As a comparison, the log10(k) corresponding to the 23S rRNA incubated in opened minicapsules under 50% RH at 90 °C (drop) was also plotted.
Figure 4
Figure 4
Evolution of Cq as a function of time at 90 °C. RT-qPCR reactions and Cq calculations were performed as described in Materials and Methods on amplicons from the following transcripts: TUBA1B (open diamonds), PSMB6 (open squares), PPIE (closed circles), TBP (open circles), EEF1a1 (open triangles), β2M (closed squares), GAPDH (closed diamonds) and 18S rRNA (closed triangles). The slopes of the linear regressions are indicated for each amplicon.

References

    1. Madej RM, Davis J, Holden MJ, Kwang S, Labourier E, Schneider GJ. International standards and reference materials for quantitative molecular infectious disease testing. J Mol Diagn. 2010;12:133–143. - PMC - PubMed
    1. White HE, Matejtschuk P, Rigsby P, et al. Establishment of the first World Health Organization International Genetic Reference Panel for quantitation of BCR-ABL mRNA. Blood. 2010;116:e111–e117. - PubMed
    1. Baginsky S, Hennig L, Zimmermann P, Gruissem W. Gene expression analysis, proteomics, and network discovery. Plant Physiol. 2010;152:402–410. - PMC - PubMed
    1. Malone J, Oliver B. Microarrays, deep sequencing and the true measure of the transcriptome. BMC Biol. 2011;9:34. - PMC - PubMed
    1. Wang Z, Gerstein M, Snyder M. RNA-Seq: a revolutionary tool for transcriptomics. Nat Rev Genet. 2009;10:57–63. - PMC - PubMed

Publication types