. 2013:4:2163.
doi: 10.1038/ncomms3163.

Structural modulation of gut microbiota in life-long calorie-restricted mice

Affiliations
Free PMC article

Structural modulation of gut microbiota in life-long calorie-restricted mice

Chenhong Zhang et al. Nat Commun. 2013.
Free PMC article

Abstract

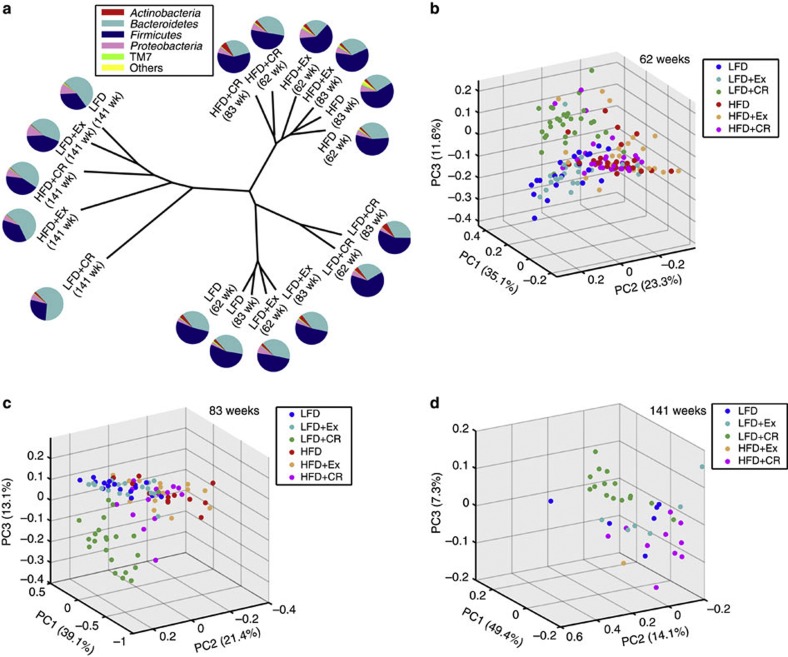
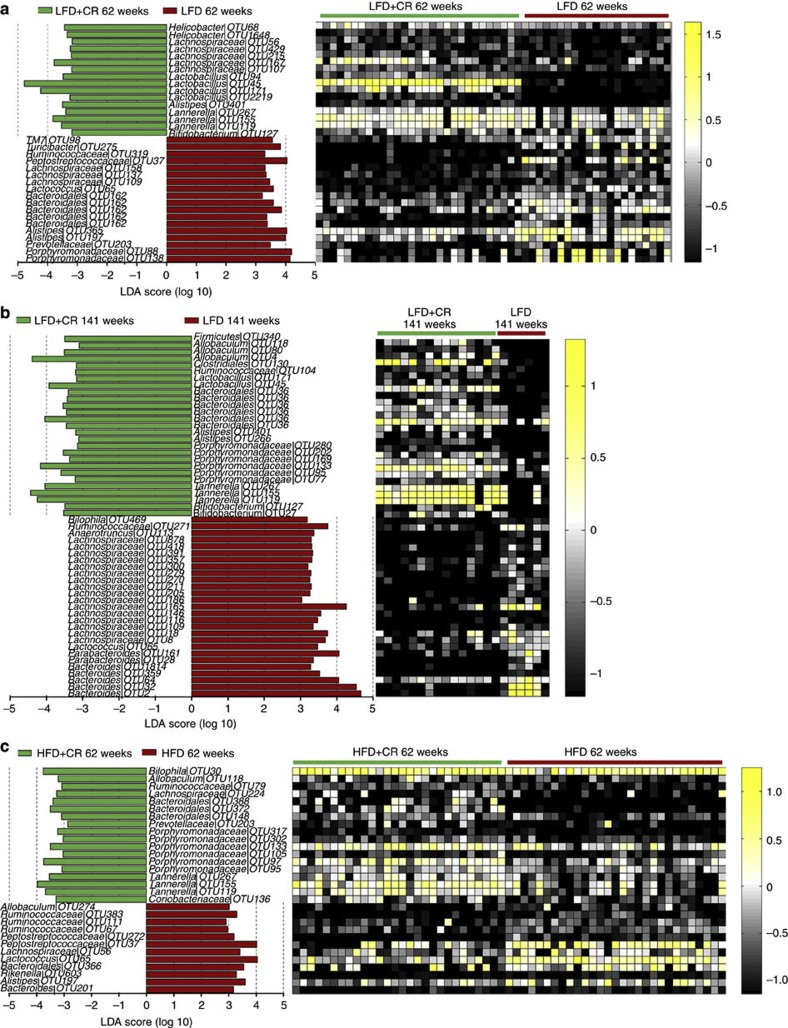
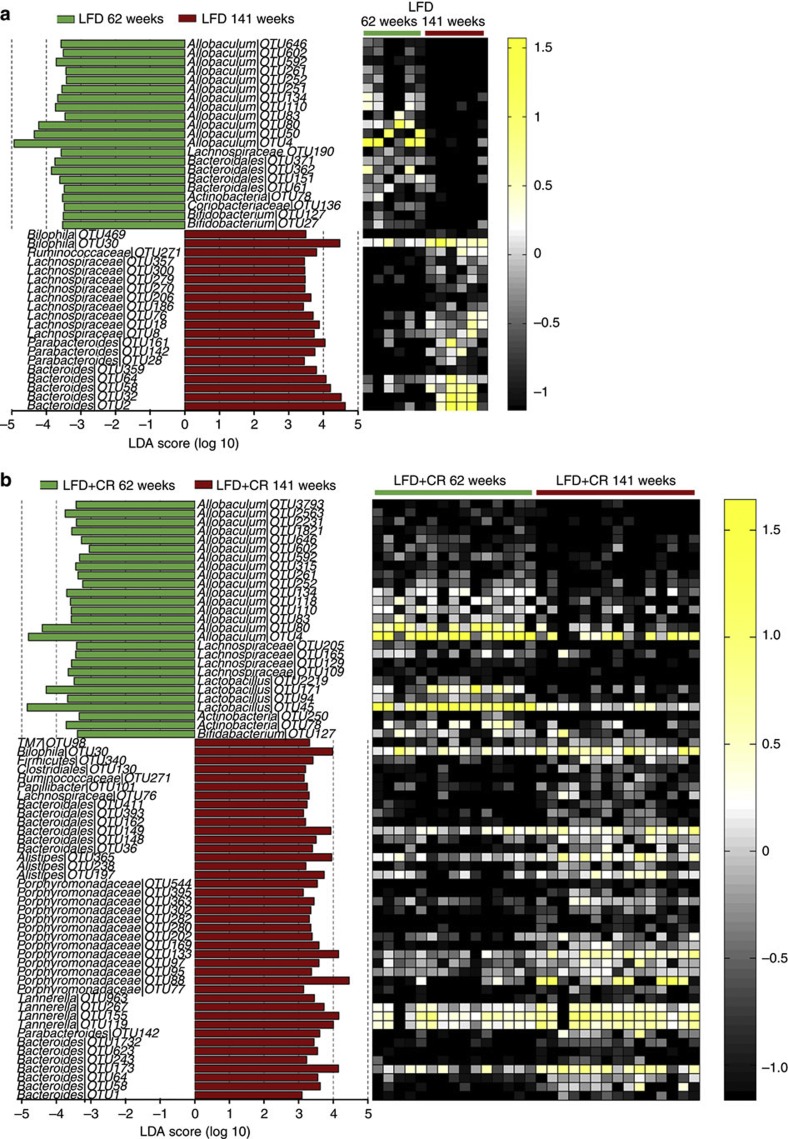
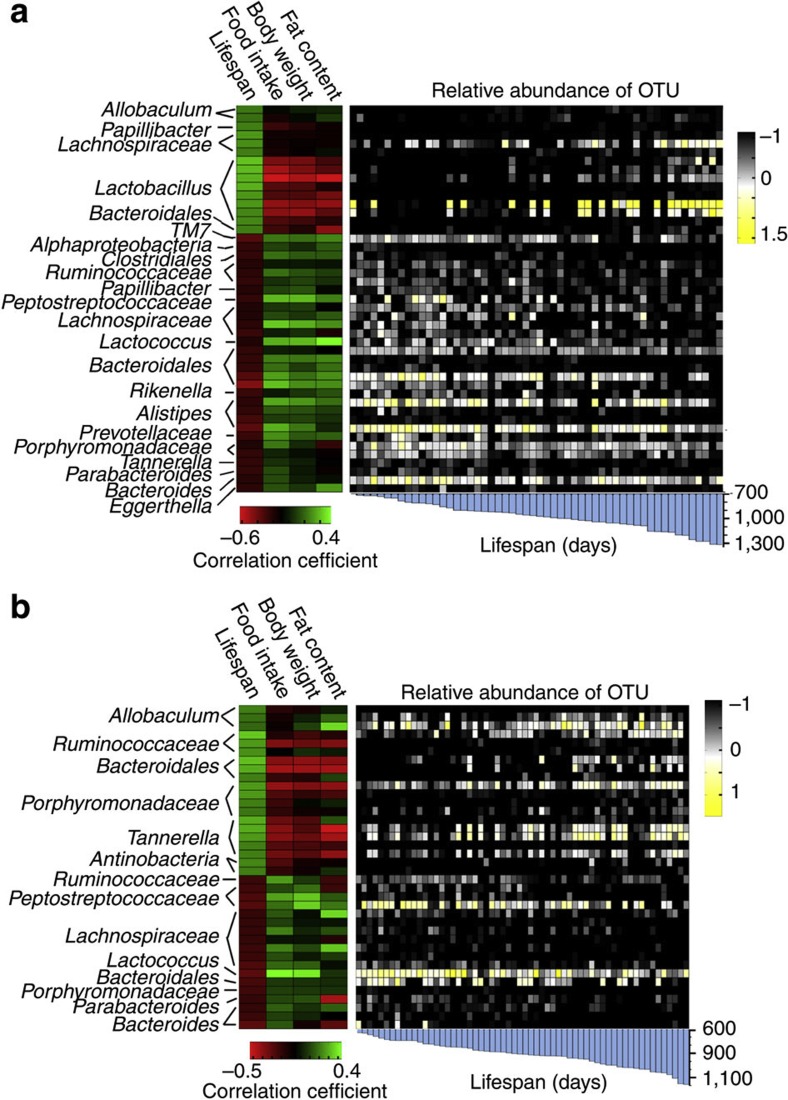
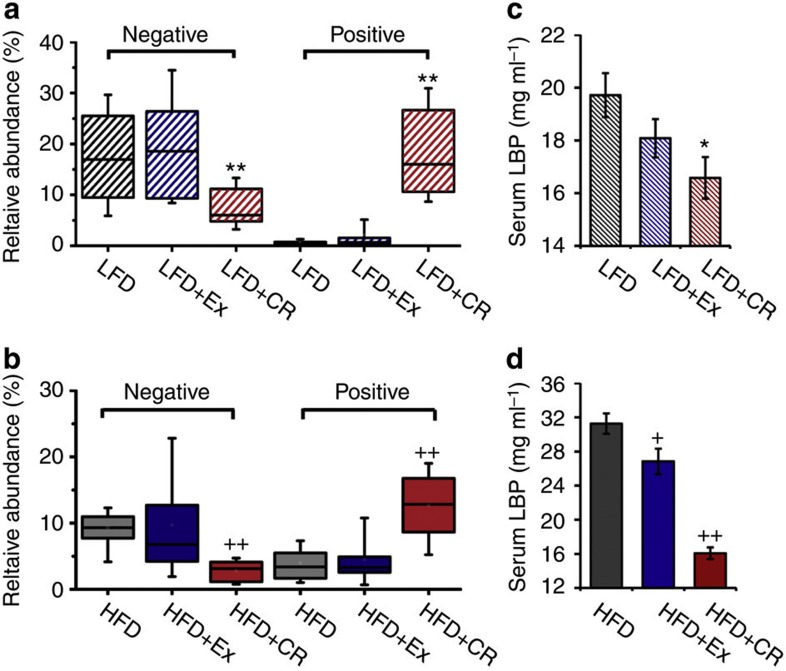
Calorie restriction has been regarded as the only experimental regimen that can effectively lengthen lifespan in various animal models, but the actual mechanism remains controversial. The gut microbiota has been shown to have a pivotal role in host health, and its structure is mostly shaped by diet. Here we show that life-long calorie restriction on both high-fat or low-fat diet, but not voluntary exercise, significantly changes the overall structure of the gut microbiota of C57BL/6 J mice. Calorie restriction enriches phylotypes positively correlated with lifespan, for example, the genus Lactobacillus on low-fat diet, and reduces phylotypes negatively correlated with lifespan. These calorie restriction-induced changes in the gut microbiota are concomitant with significantly reduced serum levels of lipopolysaccharide-binding protein, suggesting that animals under calorie restriction can establish a structurally balanced architecture of gut microbiota that may exert a health benefit to the host via reduction of antigen load from the gut.


Figures

Figure 1
Figure 1. Age-dependent and diet-responsive alteration trajectories of global gut microbiota structures.
(a) Unweighted pair-group method using arithmetic average based on the weighted UniFrac distance of gut microbiota from the six groups of mice at 62, 83 and 141 weeks (wk) of age. The average relative abundance (% of total 16S rRNA gene V3 region sequences) of bacterial lineages of the gut microbiota within each group of mice is displayed as pie charts at the phylum level. Weighted UniFrac principal coordinate analysis of animals at (b) 62 (LFD, n=21; LFD+CR, n=29; LFD+Ex, n=22; HFD, n=28; HFD+CR, n=29; and HFD+Ex, n=23), (c) 83 (LFD, n=16; LFD+CR, n=22; LFD+Ex, n=19; HFD, n=12; HFD+CR, n=14; and HFD+Ex, n=15) and (d) 141 (LFD, n=6; LFD+CR, n=15; LFD+Ex, n=6; HFD, n=0; HFD+CR, n=10; and HFD+Ex, n=1) weeks of age.
Figure 2
Figure 2. Key phylotypes of gut microbiota responding to life-long CR identified using LEfSe.
(a) LFD (n=21) versus LFD+CR (n=29) mice at 62 weeks. (b) LFD (n=6) versus LFD+CR (n=15) mice at 141 weeks. (c) HFD (n=28) versus HFD+CR (n=29) mice at 62 weeks. The left histogram shows the LDA scores computed for features (on the OTU level) differentially abundant between the ab libitum and CR mice. The right heat map shows the relative abundance (log 10 transformation) of OTUs.
Figure 3
Figure 3. Key phylotypes of gut microbiota responding to aging.
(a) LFD+CR mice (n=15). (b) LFD mice (n=6). The left histogram shows the LDA scores computed for features (OTU level) differentially abundant between 62 and 141 weeks. The right heat map shows the relative abundance (log 10 transformed) of OTUs.
Figure 4
Figure 4. Correlation of mid-life gut microbiota with lifespan.
The phylotypes significantly correlated with lifespan in mid-life (62 weeks) gut microbiota of animals on (a) low-fat diet (LFD, n=15; LFD+CR, n=22; and LFD+Ex, n=17) and (b) high-fat diet (HFD, n=21; HFD+CR, n=21; and HFD+Ex, n=18). The left heat map shows the correlation coefficient between these OTUs and physiological parameters of mid-life. The right heat map shows the relative abundance (log 10 transformed) of OTUs. The bottom bar shows the lifespan of each mouse.
Figure 5
Figure 5. Gut microbiota-associated antigen load changes.
Relative abundance of the phylotypes negatively and positively correlated with lifespan of mice on (a) low-fat diet (LFD, n=15; LFD+CR, n=22; and LFD+Ex, n=17) and (b) high-fat diet (n=21; HFD+CR, n=21; and HFD+Ex, n=18) at 62 weeks. The boundary of the box closest to zero indicates the 25th percentile, a line within the box marks the median, and the boundary of the box farthest from zero indicates the 75th percentile. Whiskers (error bars) above and below the box indicate the 90th and 10th percentiles. The serum level of LBP of mice on (c) low-fat diet (LFD, n=7; LFD+CR, n=8; and LFD+Ex, n=7) and (d) high-fat diet (HFD, n=8; HFD+CR, n=8; HFD+Ex, n=7) at 62 weeks (shown as mean±s.e.m.). *P<0.05 and **P<0.01 versus LFD, +P<0.05 and ++P<0.01 versus HFD by analyses of variance.

References

    1. McCay C. M., Crowell M. F. & Maynard L. A. The effect of retarded growth upon the length of life span and upon the ultimate body size. J. Nutr. 10, 63–79 (1935). - PubMed
    1. Colman R. J. et al. Caloric restriction delays disease onset and mortality in rhesus monkeys. Science 325, 201–204 (2009). - PMC - PubMed
    1. Fontana L., Meyer T. E., Klein S. & Holloszy J. O. Long-term calorie restriction is highly effective in reducing the risk for atherosclerosis in humans. Proc. Natl Acad. Sci. USA 101, 6659–6663 (2004). - PMC - PubMed
    1. Wolf G. Calorie restriction increases life span: a molecular mechanism. Nutr. Rev. 64, 89–92 (2006). - PubMed
    1. Guarente L. Mitochondria—a nexus for aging, calorie restriction, and sirtuins? Cell 132, 171–176 (2008). - PMC - PubMed

Publication types

MeSH terms