

Postzygotic isolation involves strong mitochondrial and sex-specific effects in Tigriopus californicus, a species lacking heteromorphic sex chromosomes
- PMID: 23860232
- PMCID: PMC3806025
- DOI: 10.1038/hdy.2013.61
Postzygotic isolation involves strong mitochondrial and sex-specific effects in Tigriopus californicus, a species lacking heteromorphic sex chromosomes
Abstract
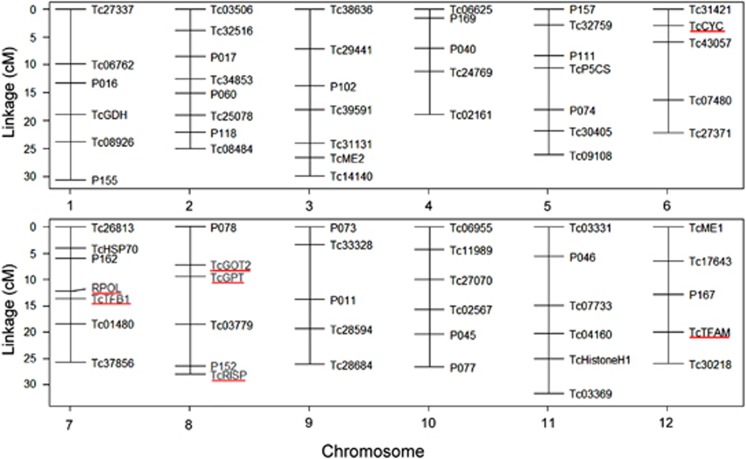
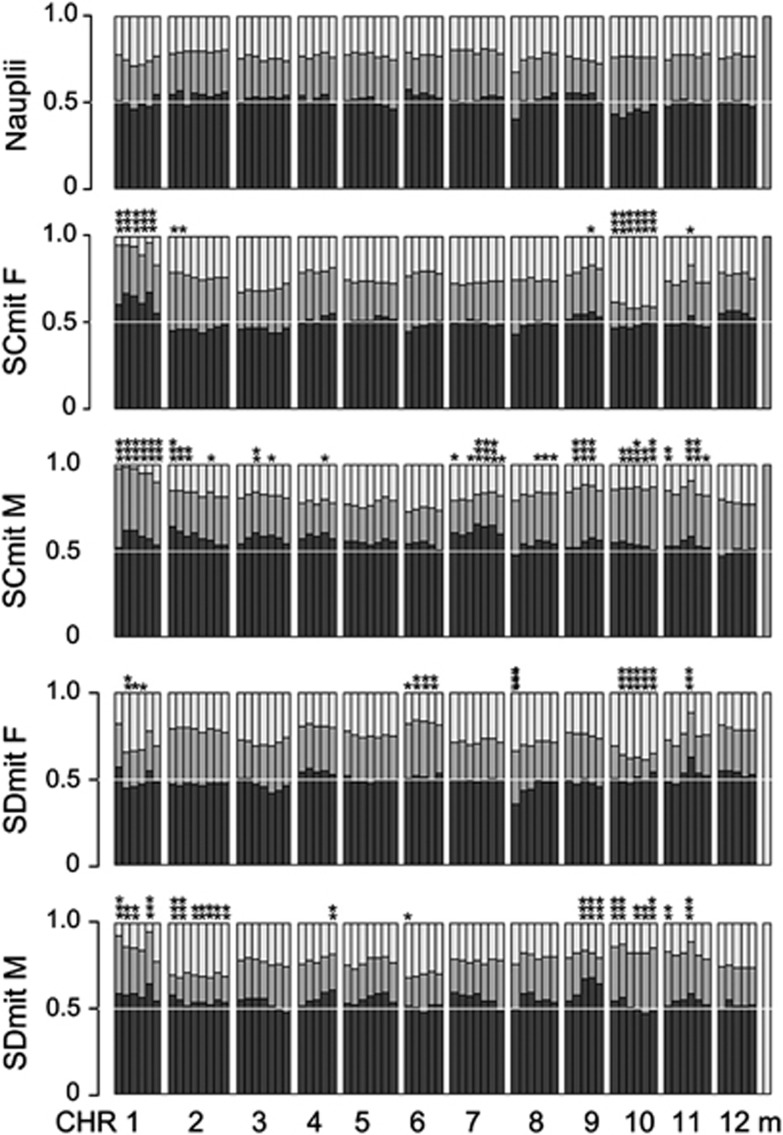
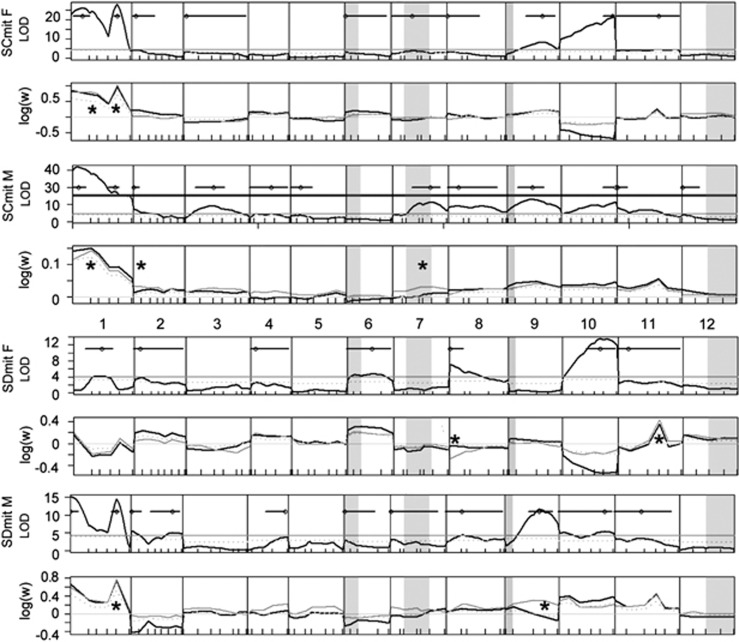
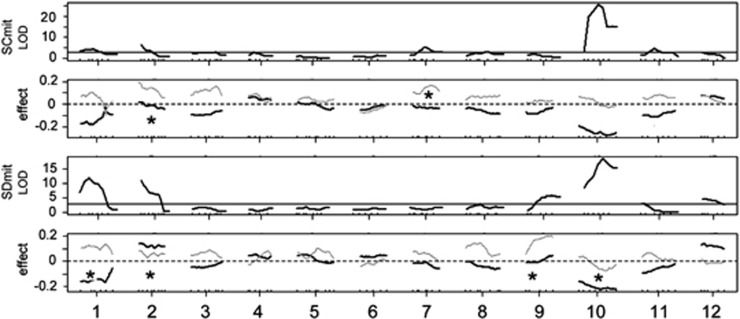
Detailed studies of the genetics of speciation have focused on a few model systems, particularly Drosophila. The copepod Tigriopus californicus offers an alternative that differs from standard animal models in that it lacks heteromorphic chromosomes (instead, sex determination is polygenic) and has reduced opportunities for sexual conflict, because females mate only once. Quantitative trait loci (QTL) mapping was conducted on reciprocal F2 hybrids between two strongly differentiated populations, using a saturated linkage map spanning all 12 autosomes and the mitochondrion. By comparing sexes, a possible sex ratio distorter was found but no sex chromosomes. Although studies of standard models often find an excess of hybrid male sterility factors, we found no QTL for sterility and multiple QTL for hybrid viability (indicated by non-Mendelian adult ratios) and other characters. Viability problems were found to be stronger in males, but the usual explanations for weaker hybrid males (sex chromosomes, sensitivity of spermatogenesis, sexual selection) cannot fully account for these male viability problems. Instead, higher metabolic rates may amplify deleterious effects in males. Although many studies of standard speciation models find the strongest genetic incompatibilities to be nuclear-nuclear (specifically X chromosome-autosome), we found the strongest deleterious interaction in this system was mito-nuclear. Consistent with the snowball theory of incompatibility accumulation, we found that trigenic interactions in this highly divergent cross were substantially more frequent (>6×) than digenic interactions. This alternative system thus allows important comparisons to studies of the genetics of reproductive isolation in more standard model systems.
Figures
Similar articles
-
Genomic Architecture of Hybrid Male Sterility in a Species Without Sex Chromosomes (Tigriopus californicus, Copepoda: Harpacticoida).Genome Biol Evol. 2023 Jun 1;15(6):evad091. doi: 10.1093/gbe/evad091. Genome Biol Evol. 2023. PMID: 37260390 Free PMC article.
-
Sex without sex chromosomes: genetic architecture of multiple loci independently segregating to determine sex ratios in the copepod Tigriopus californicus.J Evol Biol. 2015 Dec;28(12):2196-207. doi: 10.1111/jeb.12743. Epub 2015 Oct 9. J Evol Biol. 2015. PMID: 26332493
-
Interpopulation hybridization results in widespread viability selection across the genome in Tigriopus californicus.BMC Genet. 2011 Jun 3;12:54. doi: 10.1186/1471-2156-12-54. BMC Genet. 2011. PMID: 21639918 Free PMC article.
-
Viviparity-driven conflict: more to speciation than meets the fly.Ann N Y Acad Sci. 2008;1133:126-48. doi: 10.1196/annals.1438.006. Ann N Y Acad Sci. 2008. PMID: 18559818 Review.
-
Speciation by postzygotic isolation: forces, genes and molecules.Bioessays. 2000 Dec;22(12):1085-94. doi: 10.1002/1521-1878(200012)22:12<1085::AID-BIES6>3.0.CO;2-G. Bioessays. 2000. PMID: 11084624 Review.
Cited by
-
Strong selective effects of mitochondrial DNA on the nuclear genome.Proc Natl Acad Sci U S A. 2020 Mar 24;117(12):6616-6621. doi: 10.1073/pnas.1910141117. Epub 2020 Mar 10. Proc Natl Acad Sci U S A. 2020. PMID: 32156736 Free PMC article.
-
Larval neurogenesis in the copepod Tigriopus californicus (Tetraconata, Multicrustacea).Dev Genes Evol. 2018 Mar;228(2):119-129. doi: 10.1007/s00427-018-0610-2. Epub 2018 Apr 12. Dev Genes Evol. 2018. PMID: 29651555
-
Pervasive Mitonuclear Coadaptation Underlies Fast Development in Interpopulation Hybrids of a Marine Crustacean.Genome Biol Evol. 2021 Mar 1;13(3):evab004. doi: 10.1093/gbe/evab004. Genome Biol Evol. 2021. PMID: 33502469 Free PMC article.
-
The role of mitochondria in sex- and age-specific gene expression in a species without sex chromosomes.Proc Natl Acad Sci U S A. 2024 Jun 11;121(24):e2321267121. doi: 10.1073/pnas.2321267121. Epub 2024 Jun 5. Proc Natl Acad Sci U S A. 2024. PMID: 38838014 Free PMC article.
-
Mitonuclear Ecology.Mol Biol Evol. 2015 Aug;32(8):1917-27. doi: 10.1093/molbev/msv104. Epub 2015 Apr 29. Mol Biol Evol. 2015. PMID: 25931514 Free PMC article. Review.
References
-
- Abramoff M, Magalhães PJ, Ram SJ. Image processing with ImageJ. Biophotonics Int. 2004;11:36–42.
-
- Ar-Rushdi AH. The cytology of achiasmatic meiosis in the female Tigriopus (Copepoda) Chromosoma. 1963;13:526.
-
- Barreto FS, Moy GW, Burton RS. Interpopulation patterns of divergence and selection across the transcriptome of the copepod Tigriopus californicus. Mol Ecol. 2011;20:560–572. - PubMed
Publication types
MeSH terms
LinkOut - more resources
Full Text Sources
Other Literature Sources
Miscellaneous
