. 2013 Jul 15;5(7):1719-39.
doi: 10.3390/v5071719.

Development of a magnetic electrochemical bar code array for point mutation detection in the H5N1 neuraminidase gene

Affiliations

Development of a magnetic electrochemical bar code array for point mutation detection in the H5N1 neuraminidase gene

Ludmila Krejcova et al. Viruses. .

Abstract

Since its first official detection in the Guangdong province of China in 1996, the highly pathogenic avian influenza virus of H5N1 subtype (HPAI H5N1) has reportedly been the cause of outbreaks in birds in more than 60 countries, 24 of which were European. The main issue is still to develop effective antiviral drugs. In this case, single point mutation in the neuraminidase gene, which causes resistance to antiviral drug and is, therefore, subjected to many studies including ours, was observed. In this study, we developed magnetic electrochemical bar code array for detection of single point mutations (mismatches in up to four nucleotides) in H5N1 neuraminidase gene. Paramagnetic particles Dynabeads® with covalently bound oligo (dT)₂₅ were used as a tool for isolation of complementary H5N1 chains (H5N1 Zhejin, China and Aichi). For detection of H5N1 chains, oligonucleotide chains of lengths of 12 (+5 adenine) or 28 (+5 adenine) bp labeled with quantum dots (CdS, ZnS and/or PbS) were used. Individual probes hybridized to target molecules specifically with efficiency higher than 60%. The obtained signals identified mutations present in the sequence. Suggested experimental procedure allows obtaining further information from the redox signals of nucleic acids. Moreover, the used biosensor exhibits sequence specificity and low limits of detection of subnanogram quantities of target nucleic acids.


Figures

Figure 1
Figure 1
Scheme of fully automated paramagnetic particles (MPs)-based isolation followed by electrochemical detection of target ODN labeled with QDs. As a target, three different ODNs derived from point-mutated neuraminidase gene of influenza H5N1 were used. (i) Covalent binding between oligo (dT)25 and anti-sense sequence of different H5N1-derived ODNs; (ii) Target influenza ODNs labeled with QDs (China ODN with CdS, Aichi with PbS and Zhejiang with ZnS); (iii) Hybridization between anti-sense sequence bound to MPs and target sequence labeled with QDs; (iv) Isolation of target sequence ODN-QDs and elution from MPs (elution temperature 85 °C); (v) Electrochemical detection of ODN-QDs complex, ODN (CA peak) was measured by adsorptive transfer technique coupled with square wave voltammetry (AdTS SWV) and metal part of QDs (Cd, Pb and Zn peak) was measured by differential pulse anodic stripping voltammetry (DPASV).
Figure 2
Figure 2
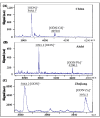
MALDI-TOF/TOF mass spectra of oligonucleotide (ODN) derived from H5N1 gene for neuraminidase labeled with QDs (CdS, PbS and ZnS). (A) Spectra of ODN and ODN labeled with CdS in China H5N1 sequence; (B) spectra of ODN and ODN labeled with PbS in Aichi H5N1 sequence; and (C) spectra of ODN and ODN labeled with ZnS in Zhejiang H5N1 influenza virus. 3-hydroxypicolinic acid (3-HPA) and diammonium citrate were used as matrix.
Figure 3
Figure 3
Optimization of electrochemical determination. The influence of time of accumulation on the heights of metal and CA peaks. (AC) Dependence of relative height of metal peak (%) on the time of accumulation of ODN(s) labeled with QDs; (DE) Dependence of relative height of CA peak (%) on the time of accumulation of ODN(s) labeled by QDs. In the optimization step, these ODN(s) labeled with QDs were used: (A+D) Aichi (Ai) was labeled with PbS (Ai 1 is short ODN–12 nucleotides, Ai 2 is long ODN–28 nucleotides), (B+E) China (Ch) was labeled with CdS (Ch 1 is short ODN–12 nucleotides, Ch 2 is long ODN–28 nucleotides), (C+D) Zhejiang (Zh) was labeled with ZnS (Zh 1 is short ODN–12 nucleotides, Zh 2 is long ODN–28 nucleotides). DPASV was used to determine metal, parameters were as it follows: initial potential –1.2 V (Zn), –0.8 V (Cd), –0.65 V (Pb); end potential –0.9 V (Zn), –0.5 V (Cd), –0.3 V (Pb), deposition potential –1.2 V (Zn), –0.8 V (Cd), –0.65 V (Pb); equilibration time 5 s; modulation time 0.06 s; time interval 0.2 s; potential step 0.002 V; modulation amplitude 0.025 V. Optimized parameter was time of accumulation (a → h): a 30 s, b 60 s, c 120 s, d 240 s, e 360 s, f 480 s, g 600 s, h 700 s. AdTS SWV method was used to determine CA peak, parameters were as it follows: purge time 60 s, initial potential –1.85 V; end potential 0 V; frequency 100 Hz; potential step 0.005 V; amplitude 0.025 V. Optimized parameter was time of accumulation (a → g): a 0 s, b 30 s, c 60 s, d 90 s, e 120 s, f 180 s, g 240 s.
Figure 4
Figure 4
Calibration curves of metal and CA peaks. (AC) Dependences of height of metal peak (nA) on concentration of ODN-QDs (µg/mL): (A) ODN Ai 1+2 (labeled with PbS), (B) Ch 1+2 (labeled with CdS), (B) Zh 1+2 (labeled with ZnS). Ai 1, Ch 1 and Zh 1 are 12 nucleotides long sequences labeled with QDs, Ai 2, Ch 2 and Zh 2 are 28 nucleotides long sequences labeled with QDs. To measure metal(s) in QDs, DPASV method was used (parameters are in caption in Figure 3); (DF) Dependences of height of CA peak (nA) on concentration of ODN-QDs (µg/mL): (D) ODN Ai 1+2 (labeled with PbS), (E) Ch 1+2 (labeled with CdS), (F) Zh 1+2 (labeled with ZnS). AdTS SWV method was used for measurements (parameters are in caption in Figure 3).
Figure 5
Figure 5
The effect of different temperatures on hybridization of short and long ODN-QDs derived from H5N1 gene for neuraminidase. (A) Short and/or (D) long ODN anti-sense (anti-H5N1 Zhejiang, China and Aichi) modified MPs with covalently bound oligo(dT)25 were used as a tool for isolation of complementary H5N1 strands (H5N1 Zhejin, China and Aichi) labeled with QDs (CdS, ZnS and/or PbS). (B+C) The effect of the temperature of hybridization (20, 25 and 30 °C) on number of hybridized molecules of short ODN-QDs abbreviated as Ai 1, Ch 1 and Zh 1; (B) Number of H5N1 molecules was calculated from the height of CA peak; (C) Number of H5N1 molecules was calculated from the height of metal peak. (E+F) The effect of the temperature of hybridization (45 °C, 50 °C and 55 °C) on number of hybridized molecules of long ODN-QDs abbreviated as Ai 2, Ch 2 and Zh 2; (E) Number of H5N1 molecules was calculated from the height of CA peak; (F) Number of H5N1 molecules was calculated from the height of metal peak. AdTS SWV method was used to measure the height of CA peak was used (parameters are in caption in Figure 3). DPASV method was used to measure the height of metal peak (parameters are in caption in Figure 3). Blue color: minimal temperature of hybridization was 20 °C for 12 nucleotides long ODNs and/or 45 °C for 28 nucleotides long ODNs, red color: optimal temperature of hybridization was 25 °C for 12 nucleotides long ODNs and/or 50 °C for 28 nucleotides long ODNs, violet color: minimal temperature of hybridization was 30 °C for 12 nucleotides long ODNs and/or 55 °C for 28 nucleotides long ODNs.
Figure 6
Figure 6
The effect of optimal temperature on hybridization of short, long and mixture of short and long ODN-QDs derived from H5N1 gene for neuraminidase. (A) Experimental scheme: bar code array for detection of three different (long and/or short) point-mutated H5N1 neuraminidase gene. (B+C) The effect of optimal temperature on hybridization (optimal temperature: 25 °C for mixture of short ODN-QDs and 50 °C for mixture of long ODN-QDs) on number of hybridized short ODN-QDs molecules. Two ratios of oligonucleotides (1:1:1–the same ratio of oligonucleotides, 1:2:1 oligonucleotides labeled with CdS were in twofold ratio than ODN labeled with ZnS and PbS; (B) The effectiveness of hybridization determined by the height of CA peak. Number of molecules calculated from the height of CA peak (light grey–CA peak of short ODN, dark grey–CA peak of long ODN); (C) The effectiveness of hybridization was monitored using the height of Cd, Pb and Zn peaks. Number of molecules calculated from the height of metal peak (light color–metal peak(s) of short ODN, dark color–metal peak(s) of long ODN; (DF) The effect of optimal temperature of hybridization (optimal temperature: 25 °C in light color and 50 °C in dark color, mixture of short and long ODN-QDs) on mixture of short and long ODN-QDs (12+28 nucleotides) molecules. Two ratios of oligonucleotides (1:1:1–the same ratio of oligonucleotides, 1:2:1 oligonucleotides labeled with CdS were in twofold ratio than that labeled with ZnS and PbS) were investigated; (D) The effectiveness of hybridization determined using the height of CA peak. (E+F) The number of molecules calculated from the height of metal peak (light color—metal peak of short ODN, dark color–metal peak of long ODN); (E) The effectiveness of hybridization was calculated from short ODN-QDs; (F) effectiveness of hybridization was calculated from long ODN-QDs.
Figure 7
Figure 7
(A) The effect of the RNA-ODN length on the number of hybridized molecules. Two long varieties of China RNA ODN sequences were tested due to CA and Cd peak detection. Short RNA ODN sequence was hybridized at 25 °C and long RNA ODN sequence was hybridized at 50 °C; (B) Percentage of signal intensity of the long ODN sequence related to the short ODN sequence detected due to CA and Cd peak for RNA and DNA ODN sequence.

Similar articles

Cited by

  • Biosensors for Point Mutation Detection.
    Jiang H, Xi H, Juhas M, Zhang Y. Jiang H, et al. Front Bioeng Biotechnol. 2021 Dec 15;9:797831. doi: 10.3389/fbioe.2021.797831. eCollection 2021. Front Bioeng Biotechnol. 2021. PMID: 34976987 Free PMC article. No abstract available.
  • Nanomaterial-based biosensors for detection of pathogenic virus.
    Mokhtarzadeh A, Eivazzadeh-Keihan R, Pashazadeh P, Hejazi M, Gharaatifar N, Hasanzadeh M, Baradaran B, de la Guardia M. Mokhtarzadeh A, et al. Trends Analyt Chem. 2017 Dec;97:445-457. doi: 10.1016/j.trac.2017.10.005. Epub 2017 Oct 13. Trends Analyt Chem. 2017. PMID: 32287543 Free PMC article. Review.

References

    1. Shoham D. Influenza type A virus: An outstandingly protean pathogen and a potent modular weapon. Crit. Rev. Microbiol. 2013;39:123–138. doi: 10.3109/1040841X.2012.692355. - DOI - PubMed
    1. Plourde J.R., Pyles J.A., Layton R.C., Vaughan S.E., Tipper J.L., Harrod K.S. Neurovirulence of H5N1 infection in ferrets is mediated by multifocal replication in distinct permissive neuronal cell regions. PLoS One. 2012;7:1–11. - PMC - PubMed
    1. Gilbert M., Jambal L., Karesh W.B., Fine A., Shiilegdamba E., Dulam P., Sodnomdarjaa R., Ganzorig K., Batchuluun D., Tseveenmyadag N., et al. Highly pathogenic avian influenza virus among wild birds in mongolia. PLoS One. 2012;7:1–9. - PMC - PubMed
    1. Wei K.F., Chen Y.F., Chen J., Wu L.J., Xie D.X. Evolution and adaptation of hemagglutinin gene of human H5N1 influenza virus. Virus Genes. 2012;44:450–458. - PubMed
    1. Abdelwhab E.M., Hafez H.M. Insight into alternative approaches for control of avian influenza in poultry, with emphasis on highly pathogenic H5N1. Viruses. 2012;4:3179–3208. - PMC - PubMed

LinkOut - more resources