

Contribution of diet to aggregate arsenic exposures-an analysis across populations
- PMID: 23860400
- PMCID: PMC4027043
- DOI: 10.1038/jes.2013.37
Contribution of diet to aggregate arsenic exposures-an analysis across populations
Abstract
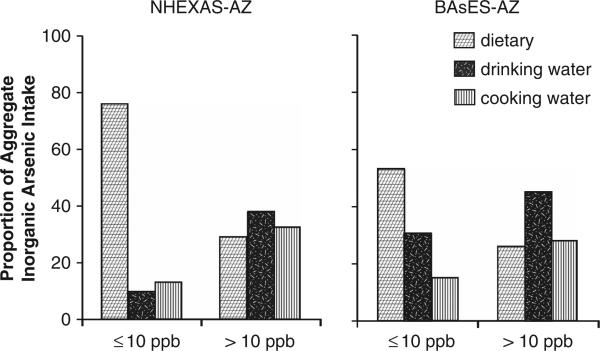
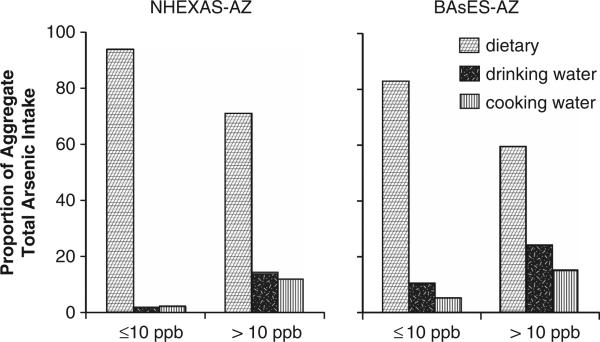
The relative contribution of dietary arsenic (As) to aggregate daily exposure has not been well-characterized, especially in relation to the current EPA maximum contaminant level (MCL) of 10 p.p.b. for As in drinking water. Our objectives were to: (1) model exposure to inorganic and total As among non-seafood eaters using subject-specific data, (2) compare the contribution of food, drinking and cooking water to estimated aggregate exposure in households with variable background tap water As levels, and (3) describe the upper distribution of potential dose at different thresholds of tap water As. Dietary As intake was modeled in regional study populations and NHANES 2003-2004 using dietary records in conjunction with published food As residue data. Water As was measured in the regional studies. Among subjects exposed to tap water As >10 p.p.b., aggregate inorganic exposure was 24.5-26.1 μg/day, with approximately 30% of intake from food. Among subjects living in homes with tap water As ≤10, 5 or 3 p.p.b., aggregate inorganic As exposure was 8.6-11.8 μg/day, with 54-85% of intake from food. Median inorganic As potential dose was 0.42-0.50 μg/kg BW/day in subjects exposed to tap water As >10 p.p.b. and less than half that among subjects exposed to tap water As ≤10 p.p.b. The majority of inorganic and total As exposure is attributable to diet in subjects with tap water As <MCL. Further research is needed to determine the potential toxicity and need for regulation of As in foods.
Figures
References
-
- IARC Arsenic in drinking water. International Agency for Research on Cancer (IARC) Monographs. 2004;84:229. Retrieved from http://www.inchem.org/documents/iarc/vol84/84-01-arsenic.html.
-
- Chen CL, Chiou HY, Hsu LI, Hsueh YM, Wu MM, Wang YH, et al. Arsenic in drinking water and risk of urinary tract cancer: a follow-up study from northeastern Taiwan. Cancer Epidemiol Biomarkers Prev. 2010;19:101–110. - PubMed
-
- Medrano MA, Boix R, Pastor-Barriuso R, Palau M, Damian J, Ramis R, et al. Arsenic in public water supplies and cardiovascular mortality in Spain. Environ Res. 2010;110:448–454. - PubMed
Publication types
MeSH terms
Substances
Grants and funding
LinkOut - more resources
Full Text Sources
Other Literature Sources
Medical
Research Materials
Miscellaneous
