. 2013:3:2216.
doi: 10.1038/srep02216.

Exploring the limits of community detection strategies in complex networks

Affiliations

Exploring the limits of community detection strategies in complex networks

Rodrigo Aldecoa et al. Sci Rep. 2013.

Abstract

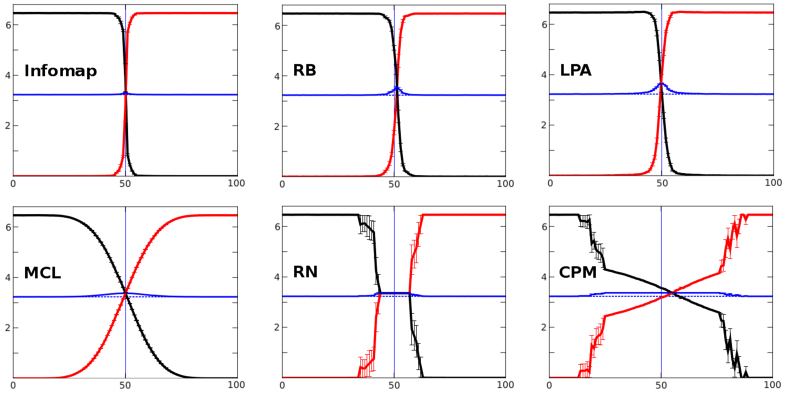
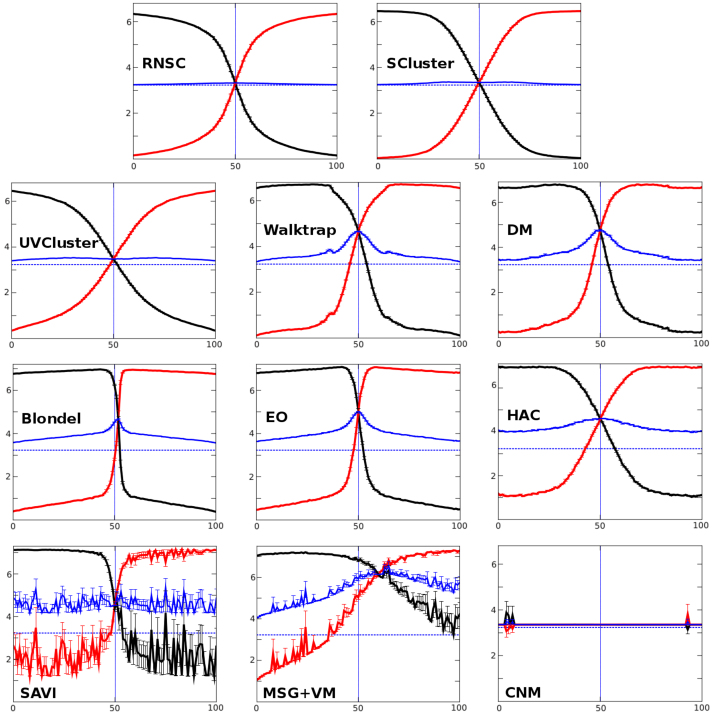
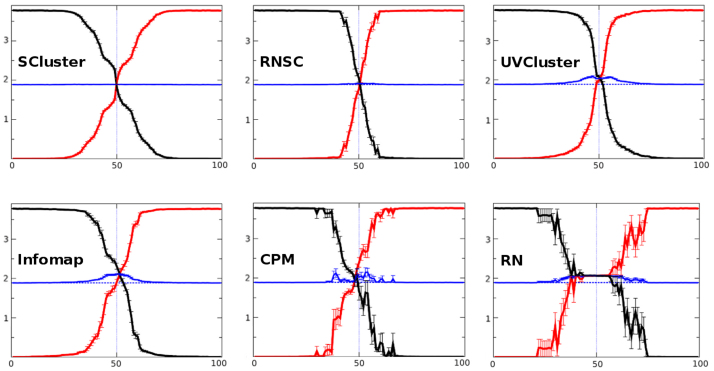
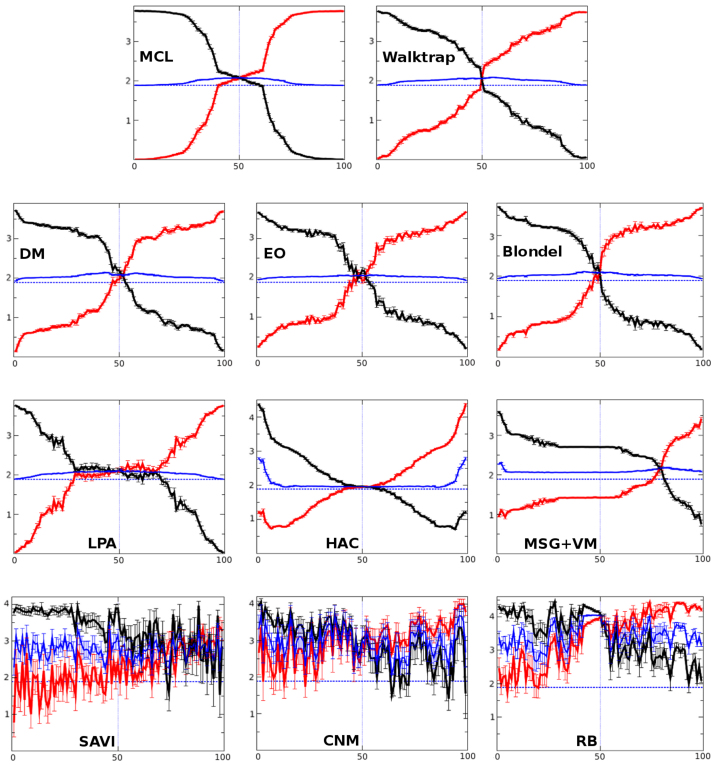
The characterization of network community structure has profound implications in several scientific areas. Therefore, testing the algorithms developed to establish the optimal division of a network into communities is a fundamental problem in the field. We performed here a highly detailed evaluation of community detection algorithms, which has two main novelties: 1) using complex closed benchmarks, which provide precise ways to assess whether the solutions generated by the algorithms are optimal; and, 2) A novel type of analysis, based on hierarchically clustering the solutions suggested by multiple community detection algorithms, which allows to easily visualize how different are those solutions. Surprise, a global parameter that evaluates the quality of a partition, confirms the power of these analyses. We show that none of the community detection algorithms tested provide consistently optimal results in all networks and that Surprise maximization, obtained by combining multiple algorithms, obtains quasi-optimal performances in these difficult benchmarks.


Figures

Figure 1
Figure 1. Best algorithms in LFR closed benchmarks.
The six algorithms able to recover the initial partition when C ≥ 5% are shown. In these diagrams, the x-axis shows the conversion percentage and the y-axis, the VI value. The red line indicates the VI values obtained when the algorithm solution is compared with the initial structure and the black line, the same comparison, but with the final structure. A perfect identity corresponds to the value VI = 0. Comparing the (VIIE + VIEF)/2 values (blue line) and the VIIF/2 values (dotted line, often invisible, being just below the blue one), we can conclude that Infomap, RB and LPA achieve optimal values until C is very close to 50%. MCL, RN and CPM work accurately only in the easiest analyses (both ends of the benchmark).
Figure 2
Figure 2. Poor performers in LFR closed benchmarks.
These algorithms were unable to recover, even once, the correct partitions of the benchmark. The plots show their very diverse behaviors, ranging from results resembling somewhat those shown in Figure 1 (RNSC or SCluster) to others that are highly asymmetric (MSG + VM), unstable (SAVI) or correspond to algorithms that fail to find any structure (CNM).
Figure 3
Figure 3. Best algorithms in RC closed benchmarks.
As in Figure 1, this figure shows the six algorithms that recovered the initial partition when C ≥ 5%. SCluster and RNSC showed an excellent behavior, displaying an almost straight blue line, while UVCluster failed in the central, most difficult, part of the benchmark. Infomap and CPM results were somewhat asymmetric, with the latter showing also some degree of instability. RN totally collapses when communities are not well defined.
Figure 4
Figure 4. Algorithms that performed poorly in RC closed benchmarks.
In this case, the behavior of the algorithms was worse than in the LFR benchmarks showed in Figure 2. MCL worked relatively well only at the very beginning and the very end of the benchmark. The remaining algorithms performed much worse. In particular, MSG + VM showed a very asymmetric pattern and SAVI, CNM and RB results were chaotic.
Figure 5
Figure 5. Details of the performance of the best algorithms in LFR benchmarks.
The y-axis (VIδ) corresponds to the difference between the expected value, VIIF and the VIIE + VIEF value of the different solutions. VIδ values close to zero correspond to the best performers.
Figure 6
Figure 6. Detailed performance in the RC benchmarks.
Again, the better a performance, the closer to a value equal to zero.
Figure 7
Figure 7. Hierarchical clustering of solutions.
Dendrograms representing the hierarchical clustering of the solutions achieved by the different methods in LFR (top panels) and RC (lower panels) closed benchmarks. Three different stages of the network conversion process have been analyzed: C = 10%, 30% and 49%. The four predefined structures (Initial, Final, One and Singles) are indicated in italics.
Figure 8
Figure 8. Results of the Smax meta-algorithm.
Performance in LFR (panel a) and RC (panel b) benchmarks of the meta-algorithm that selected for each network the solution, among all the ones provided by the algorithms, which had the highest Surprise value. Panel c): Average values of the distance to the optimal performance (defined as the averages of the absolute values of VIδ) for all the algorithms.

References

    1. Dorogovtsev S. N. & Mendes J. F. F. Evolution of Networks: From Biological Nets to the Internet and WWW. (Oxford University Press: 2003).
    1. Newman M. E. J. Networks: An Introduction. (Oxford University Press: 2010).
    1. Fortunato S. Community detection in graphs. Phys. Rep. 486, 75–174 (2010).
    1. Aldecoa R. & Marín I. Deciphering Network Community Structure by Surprise. PLoS ONE 6, e24195 (2011). - PMC - PubMed
    1. Aldecoa R. & Marín I. Closed benchmarks for network community structure characterization. Phys. Rev. E 85, 026109 (2012). - PubMed

Publication types

LinkOut - more resources