

Review
doi: 10.1007/978-1-62703-562-0_13.
Protein tyrosine phosphatases: structure, function, and implication in human disease
Affiliations
- PMID: 23860656
- PMCID: PMC8158066
- DOI: 10.1007/978-1-62703-562-0_13
Item in Clipboard
Review
Protein tyrosine phosphatases: structure, function, and implication in human disease
Methods Mol Biol.
2013.
Abstract
Protein tyrosine phosphorylation is a key regulatory mechanism in eukaryotic cell physiology. Aberrant expression or function of protein tyrosine kinases and protein tyrosine phosphatases can lead to serious human diseases, including cancer, diabetes, as well as cardiovascular, infectious, autoimmune, and neuropsychiatric disorders. Here, we give an overview of the protein tyrosine phosphatase superfamily with its over 100 members in humans. We review their structure, function, and implications in human diseases, and discuss their potential as novel drug targets, as well as current challenges and possible solutions to developing therapeutics based on these enzymes.
Figures
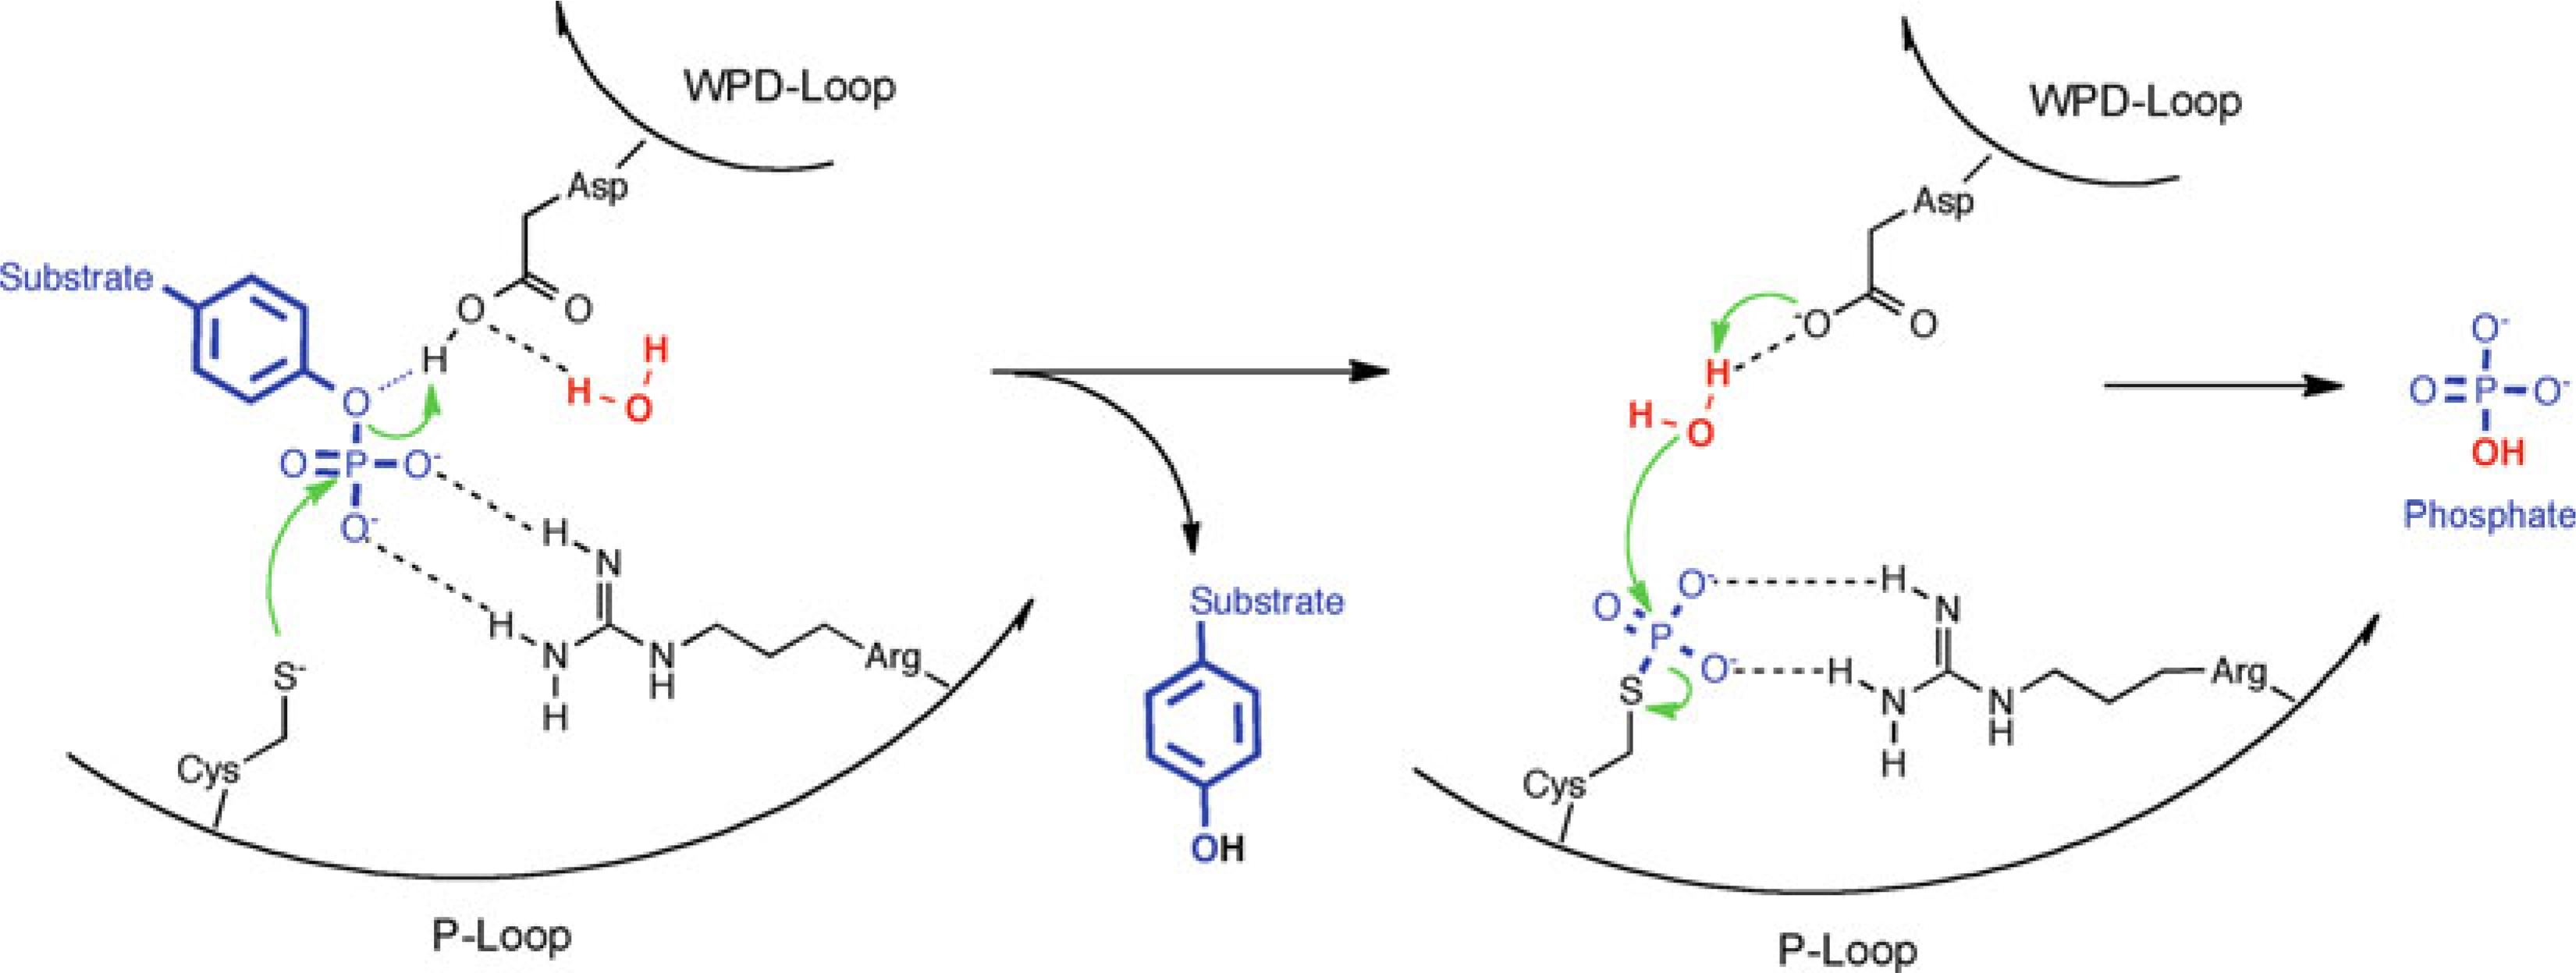
Common PTP catalytic mechanism
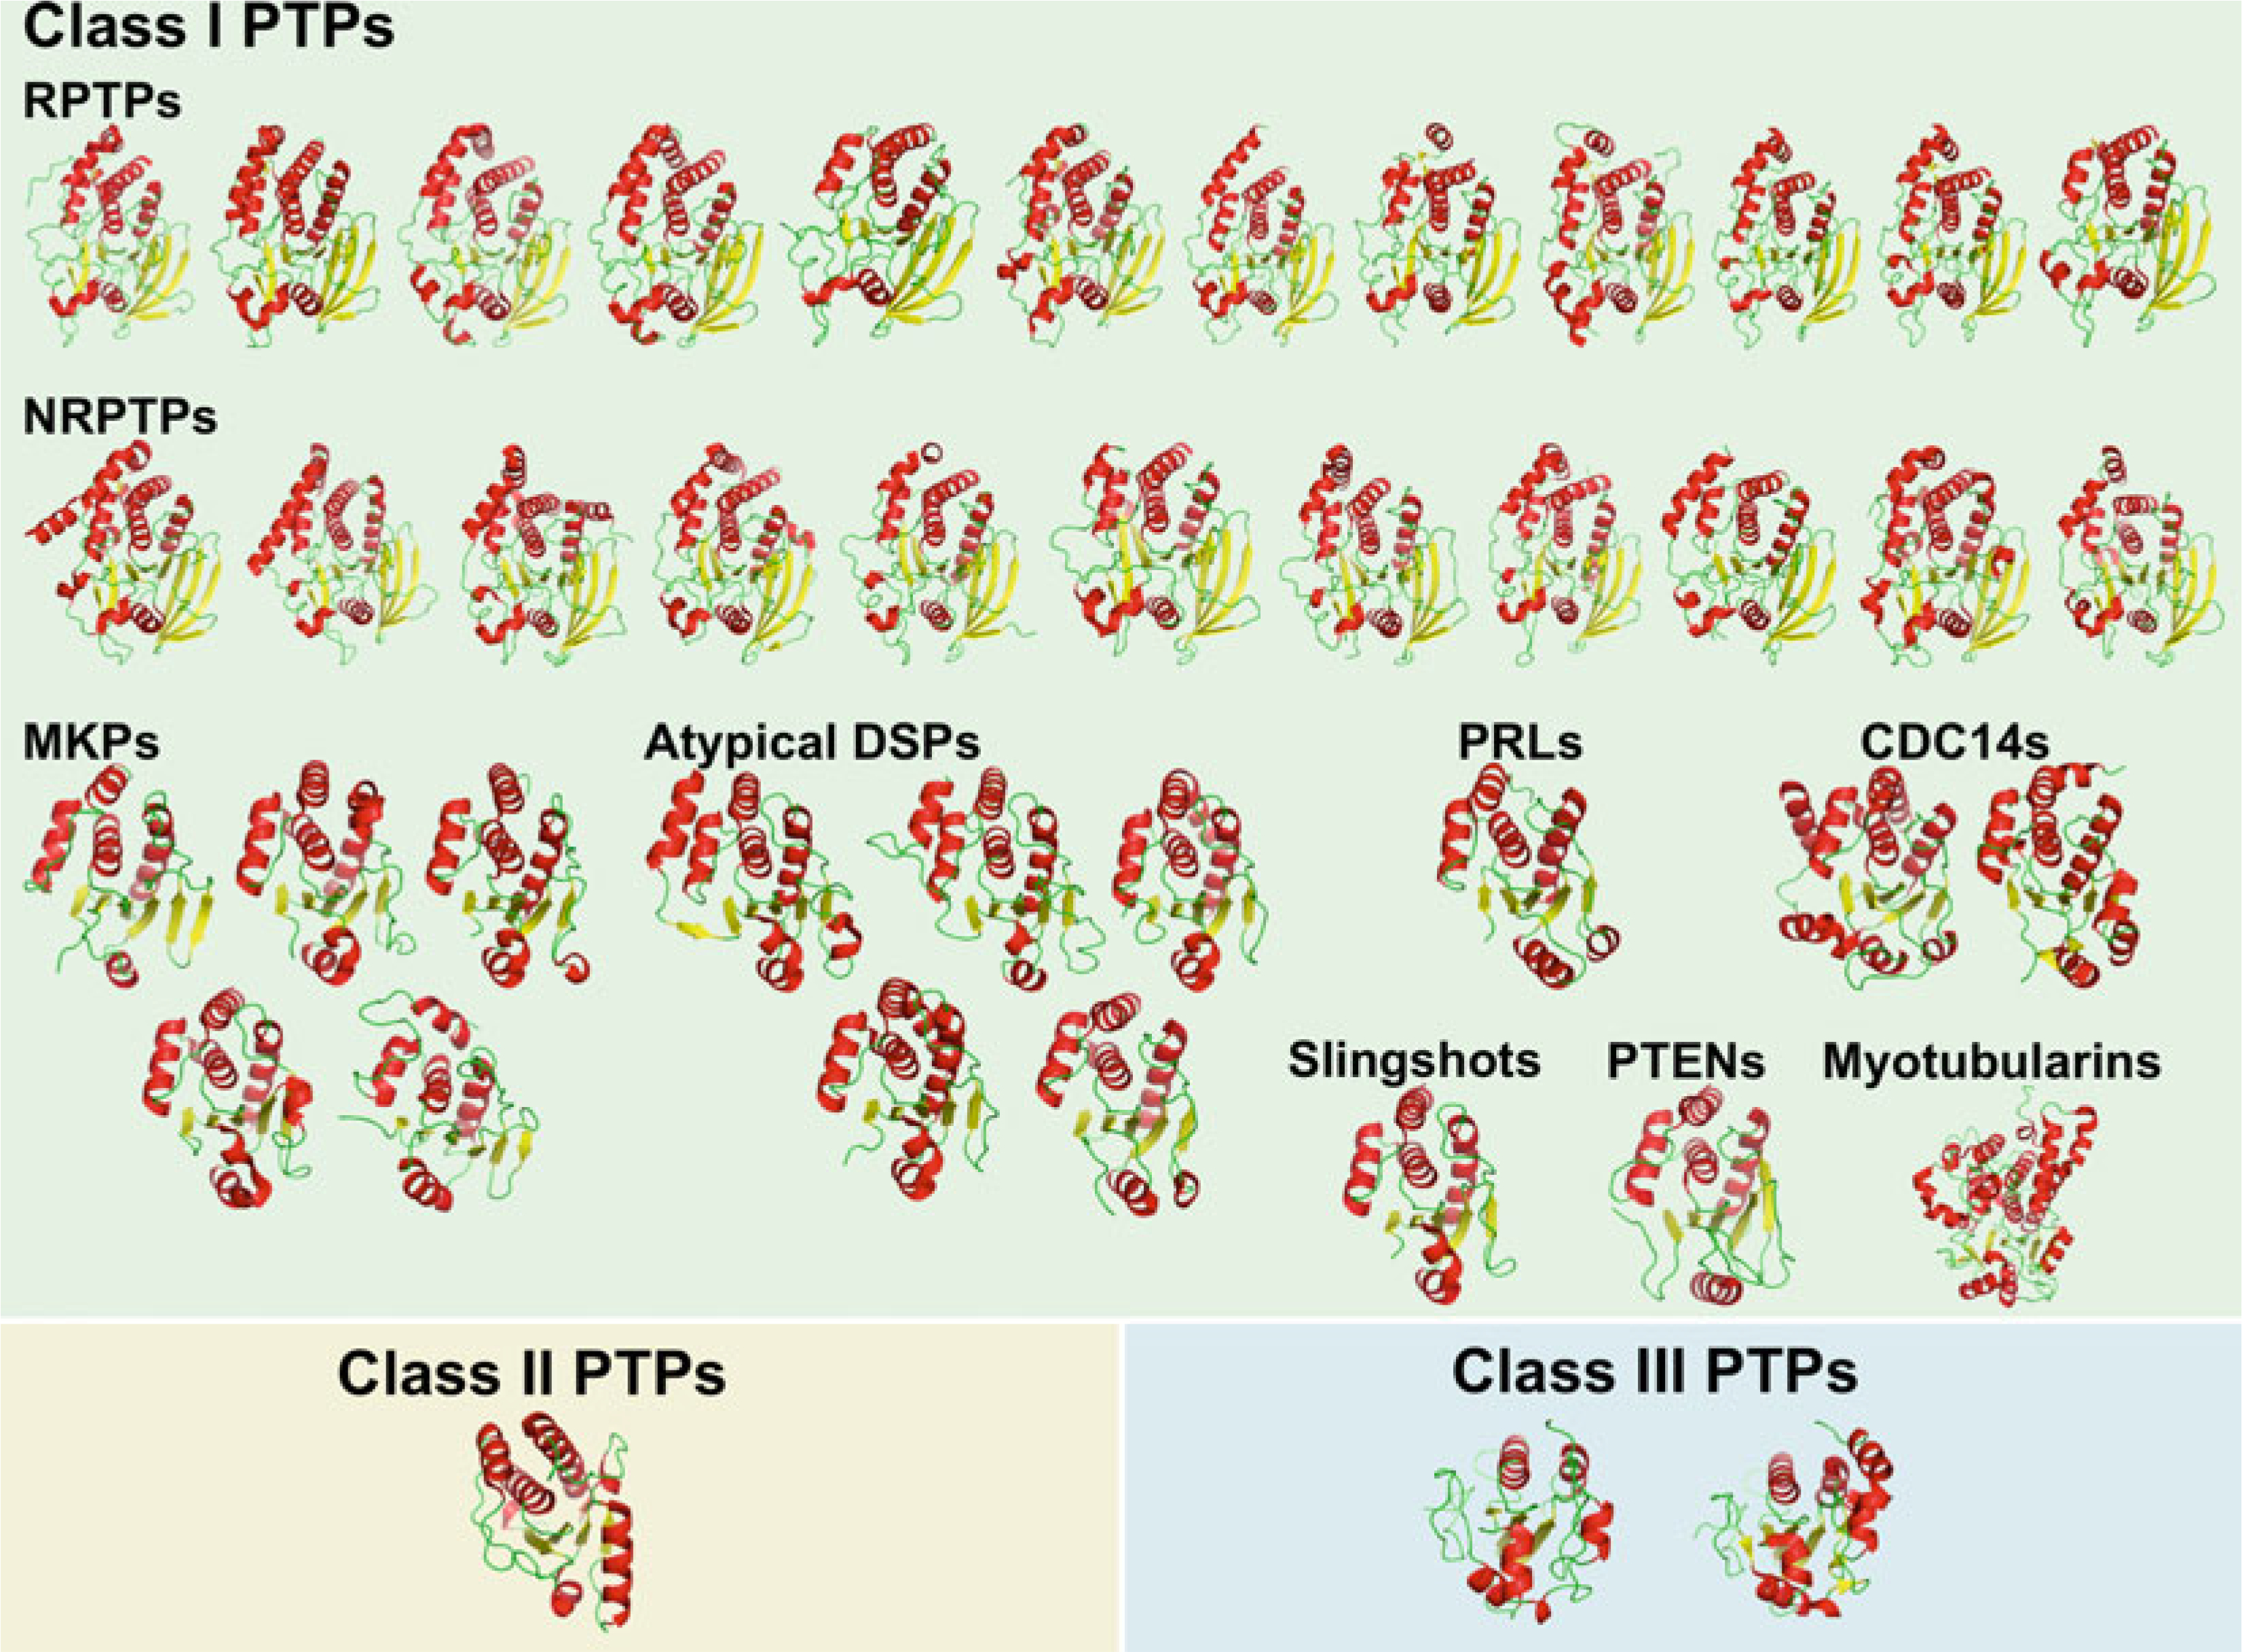
Structures of human PTP catalytic domains. Cartoon representation of
human PTP catalytic domain structures, divided by family/subfamily, and colored
by secondary structure (α-helices in red,
β-strands in yellow, loops in
green)
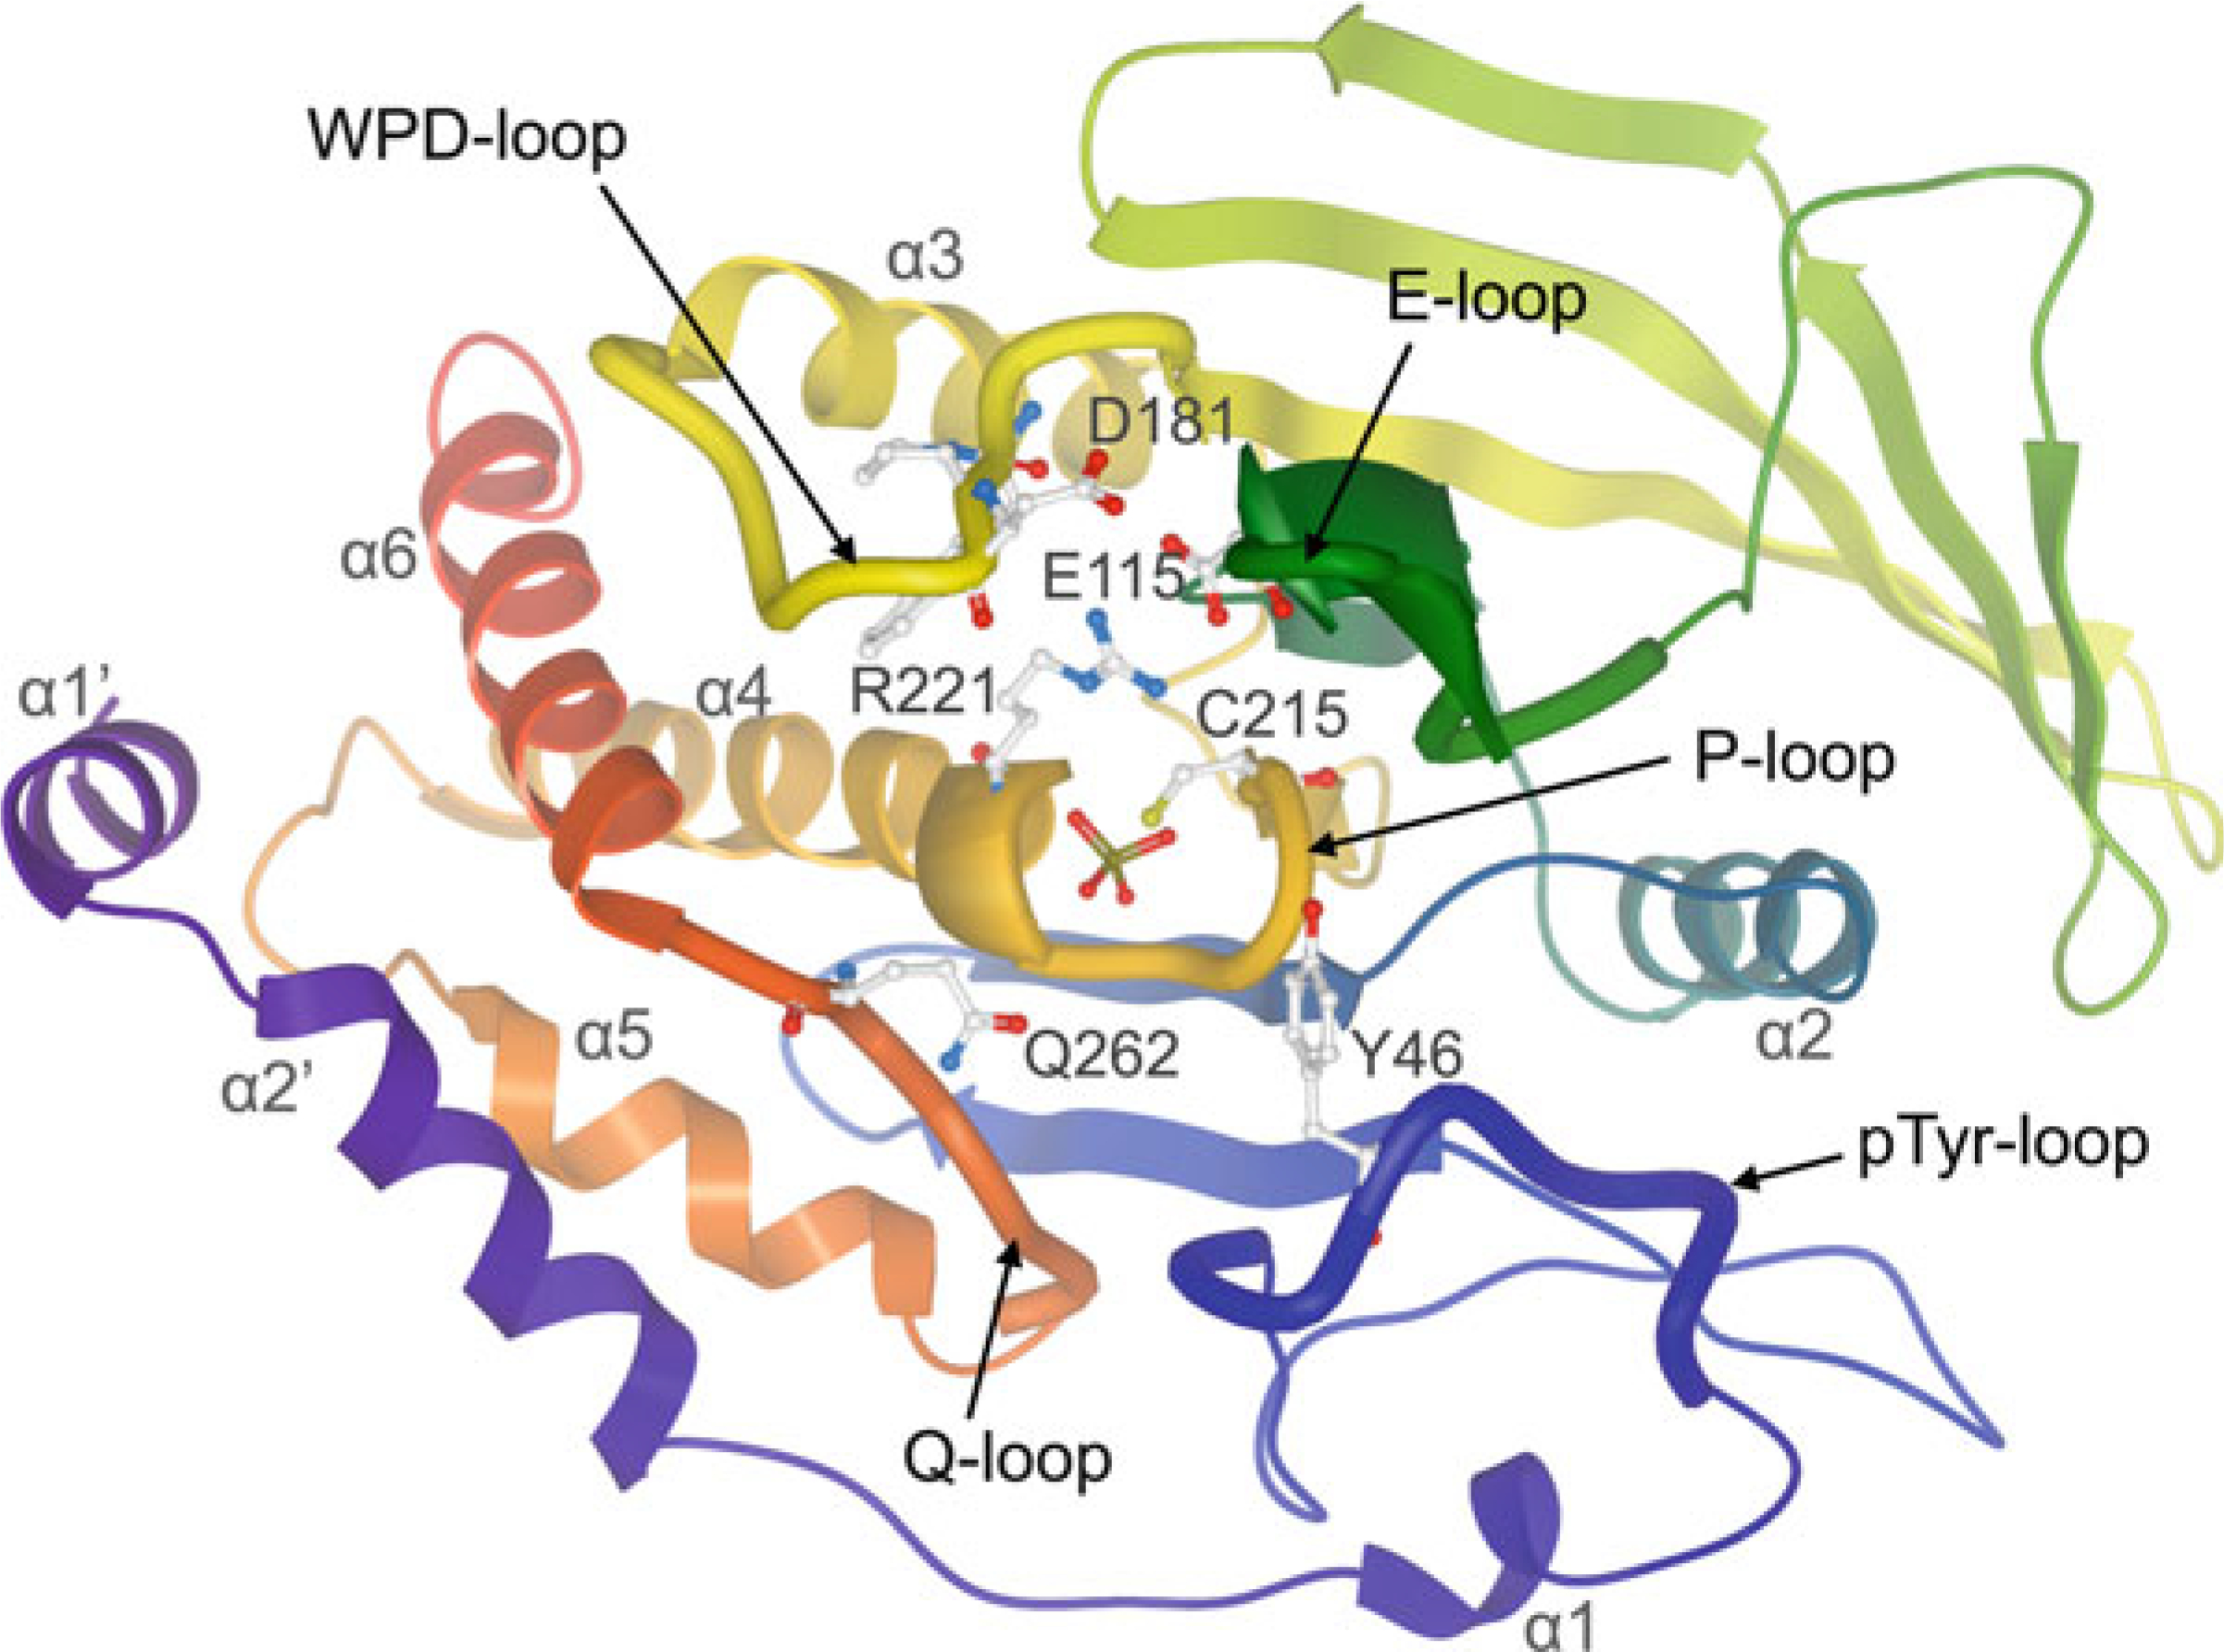
Ribbon representation of the classical class I PTP catalytic domain,
colored by NtoC, with tungstate (shown in ball-and-stick representation) bound
into the active site (PTP1B; PDB ID: 2HNQ). Conserved residues important for
catalysis are highlighted in ball-and-stick representation: catalytic cysteine
(C215) and invariant arginine (R221) of the P-loop; WPD-loop residues, including
the catalytic acid/base aspartate (D181); conserved glutamine (Q262) of the
Q-loop; tyrosine (Y46) of the pTyr-recognition loop (pTyr-loop); conserved
glutamate (E115) of the E-loop
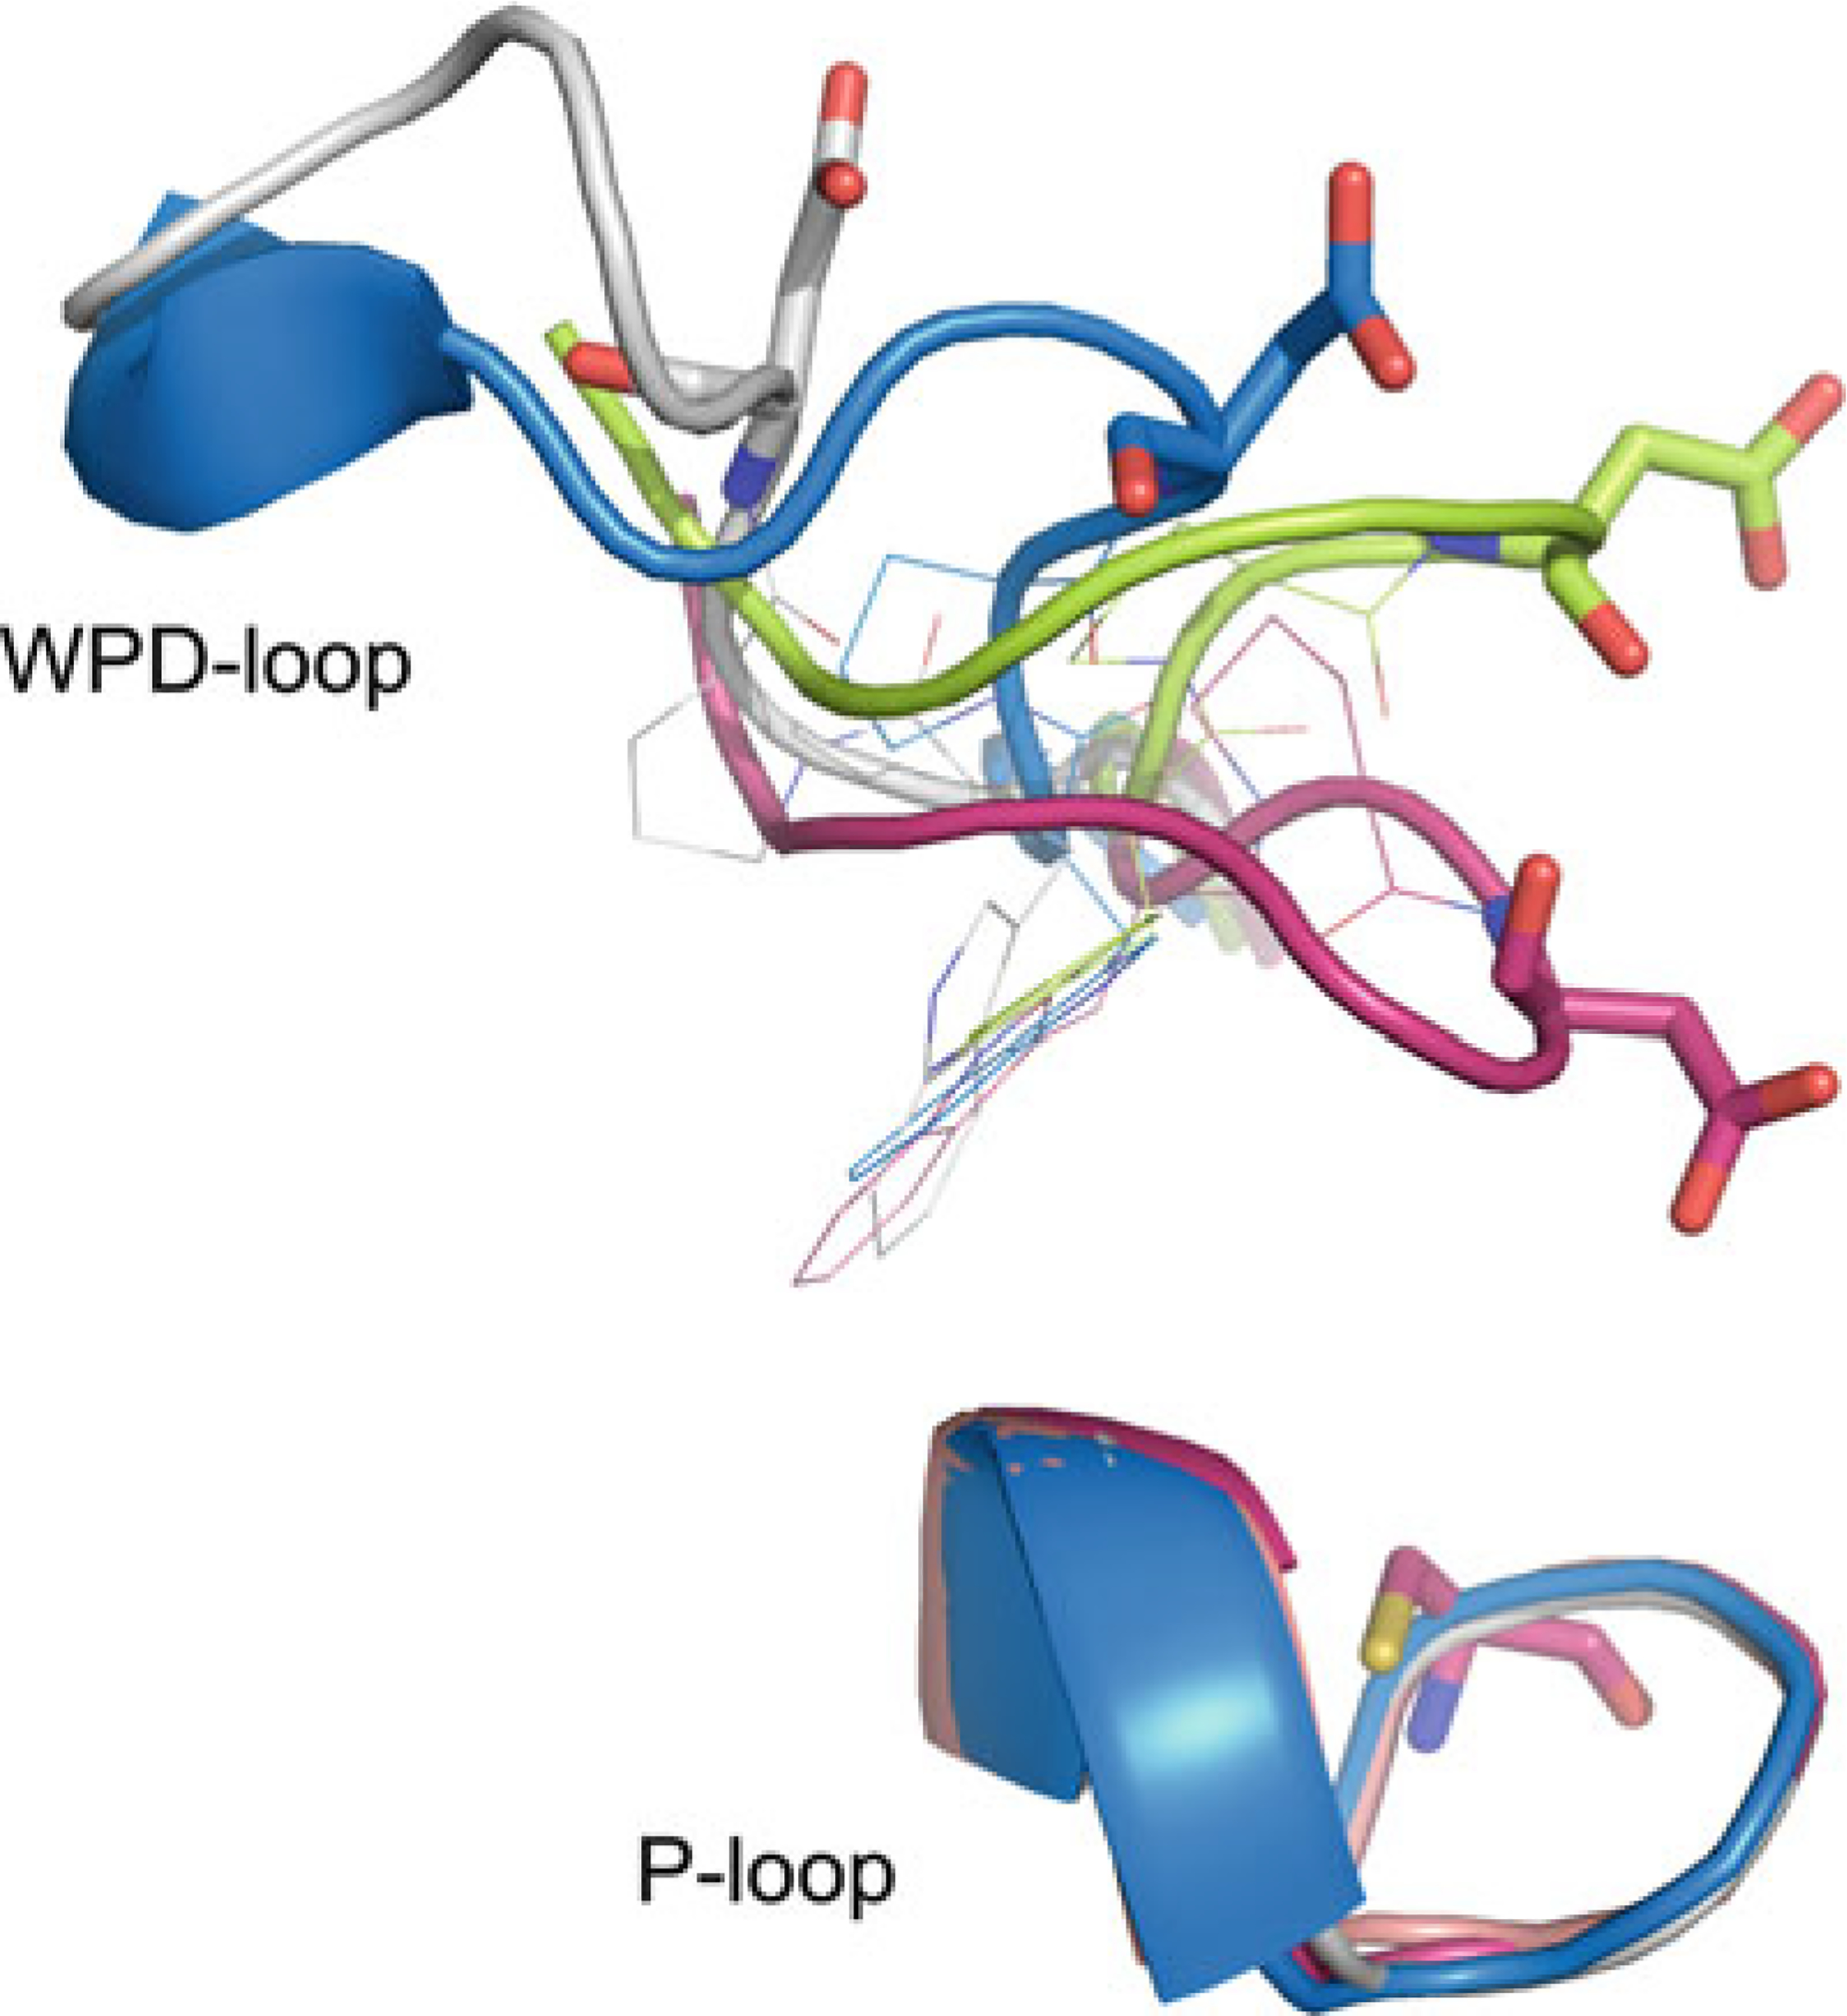
WPD-loop conformations. PTP1B closed state (magenta; PDB ID: 1SUG),
PTP1B open state (lime; PDB ID: 2HNP), STEP atypical open state
(blue, PDB ID: 2BV5), and LYP atypical open state
(white; PDB ID: 2P6X). Catalytic cysteine and catalytic
aspartate residues shown in stick representation, conserved tryptophan and
proline shown in line representation
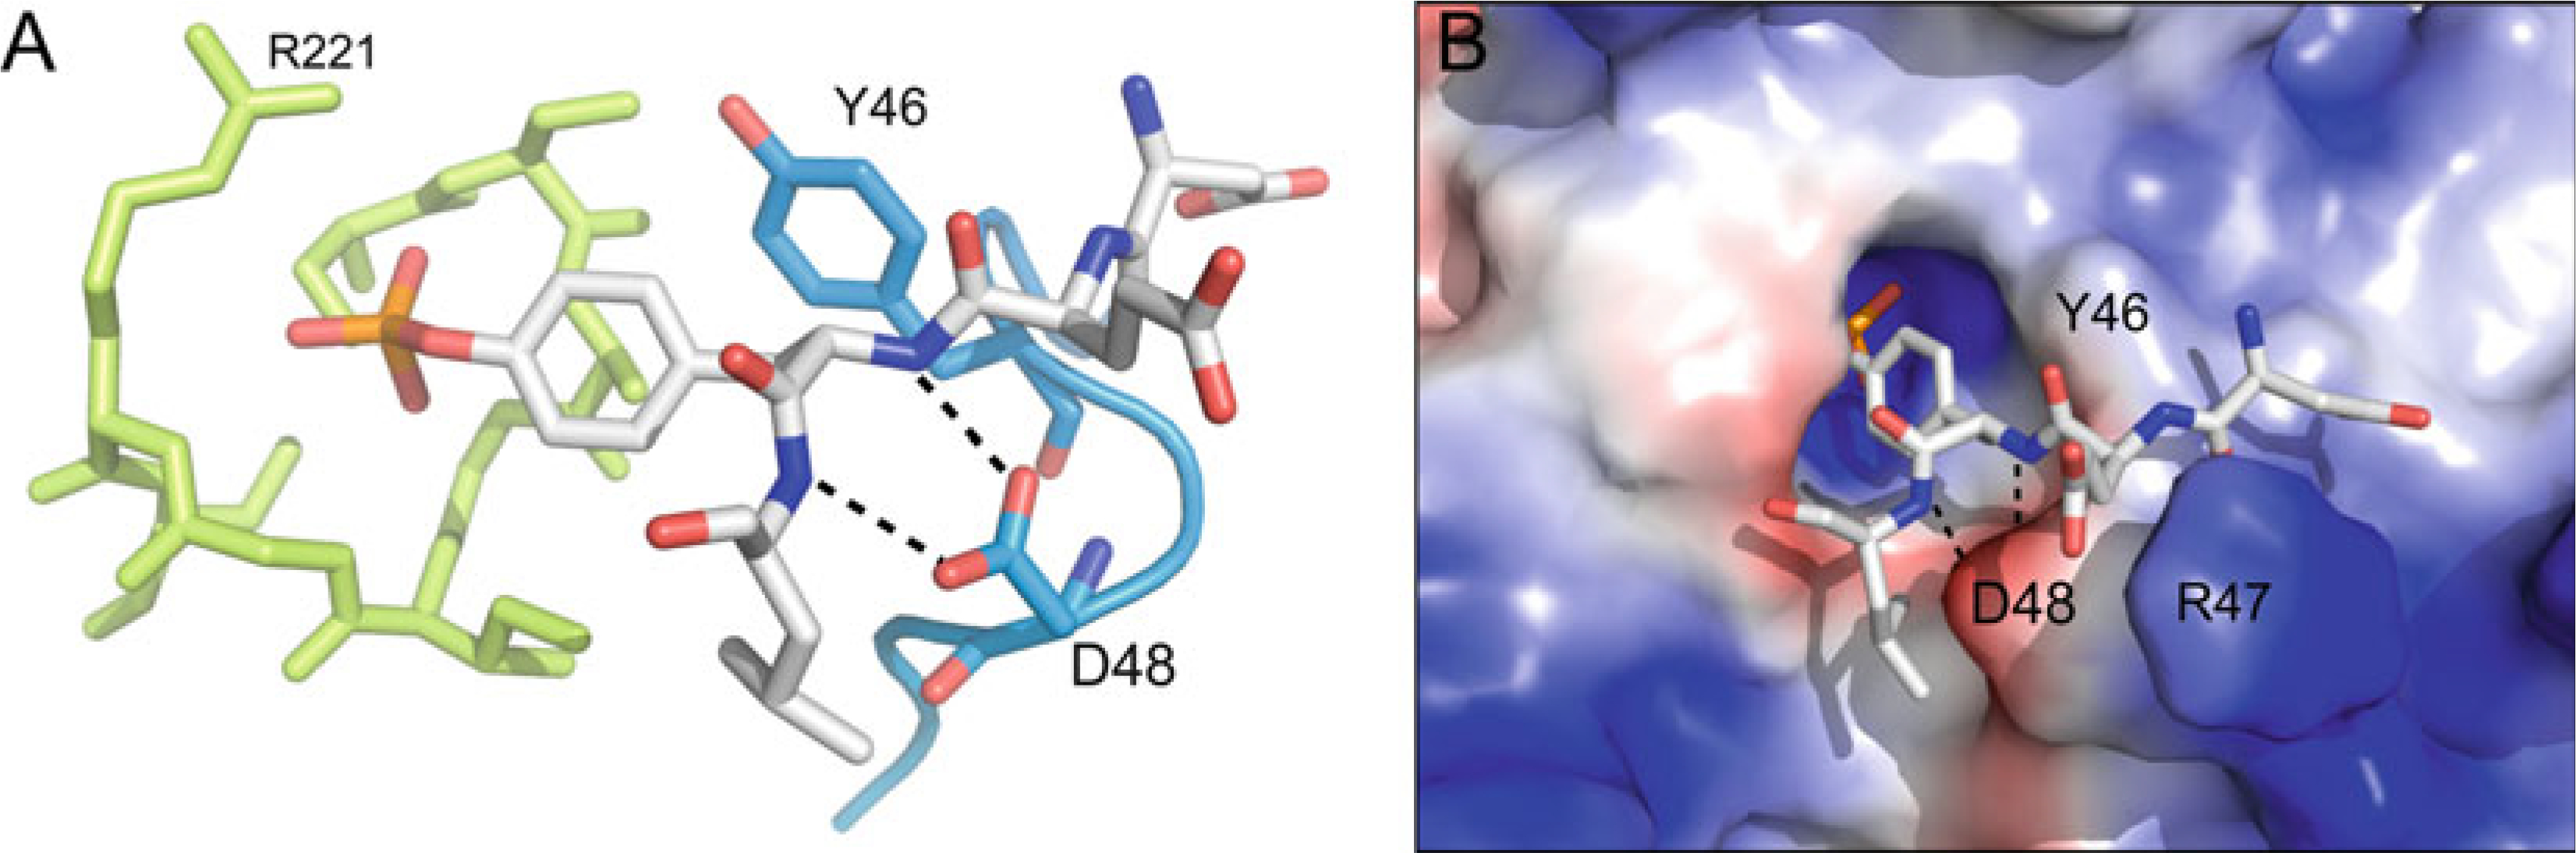
The pTyr-loop. (a) pTyr-loop (blue)
relative to the P-loop (lime), with bound pTyr-peptide
(white) (PTP1B; PDB ID: 1PTT). The conserved tyrosine (Y46
in PTP1B) defines the depth of the catalytic pocket and facilitates pTyr binding
through aromatic π−π interactions. The conserved aspartate
or asparagine (D48 in PTP1B) stabilizes substrate binding through bipartite
hydrogen bonding interaction with backbone nitrogen atoms of the substrate
peptide. (b) Same complex as in (a) but with PTP1B
rendered in surface representation (blue, most positive;
red, most negative). (In addition to the interactions
listed in (a), R47 of the PTP1B pTyr-loop is labeled, the side
chain of which interacts with the glutamate in the −1 position of the
substrate peptide, highlighting the fact that PTP1B favors substrates with
acidic residues at this position)
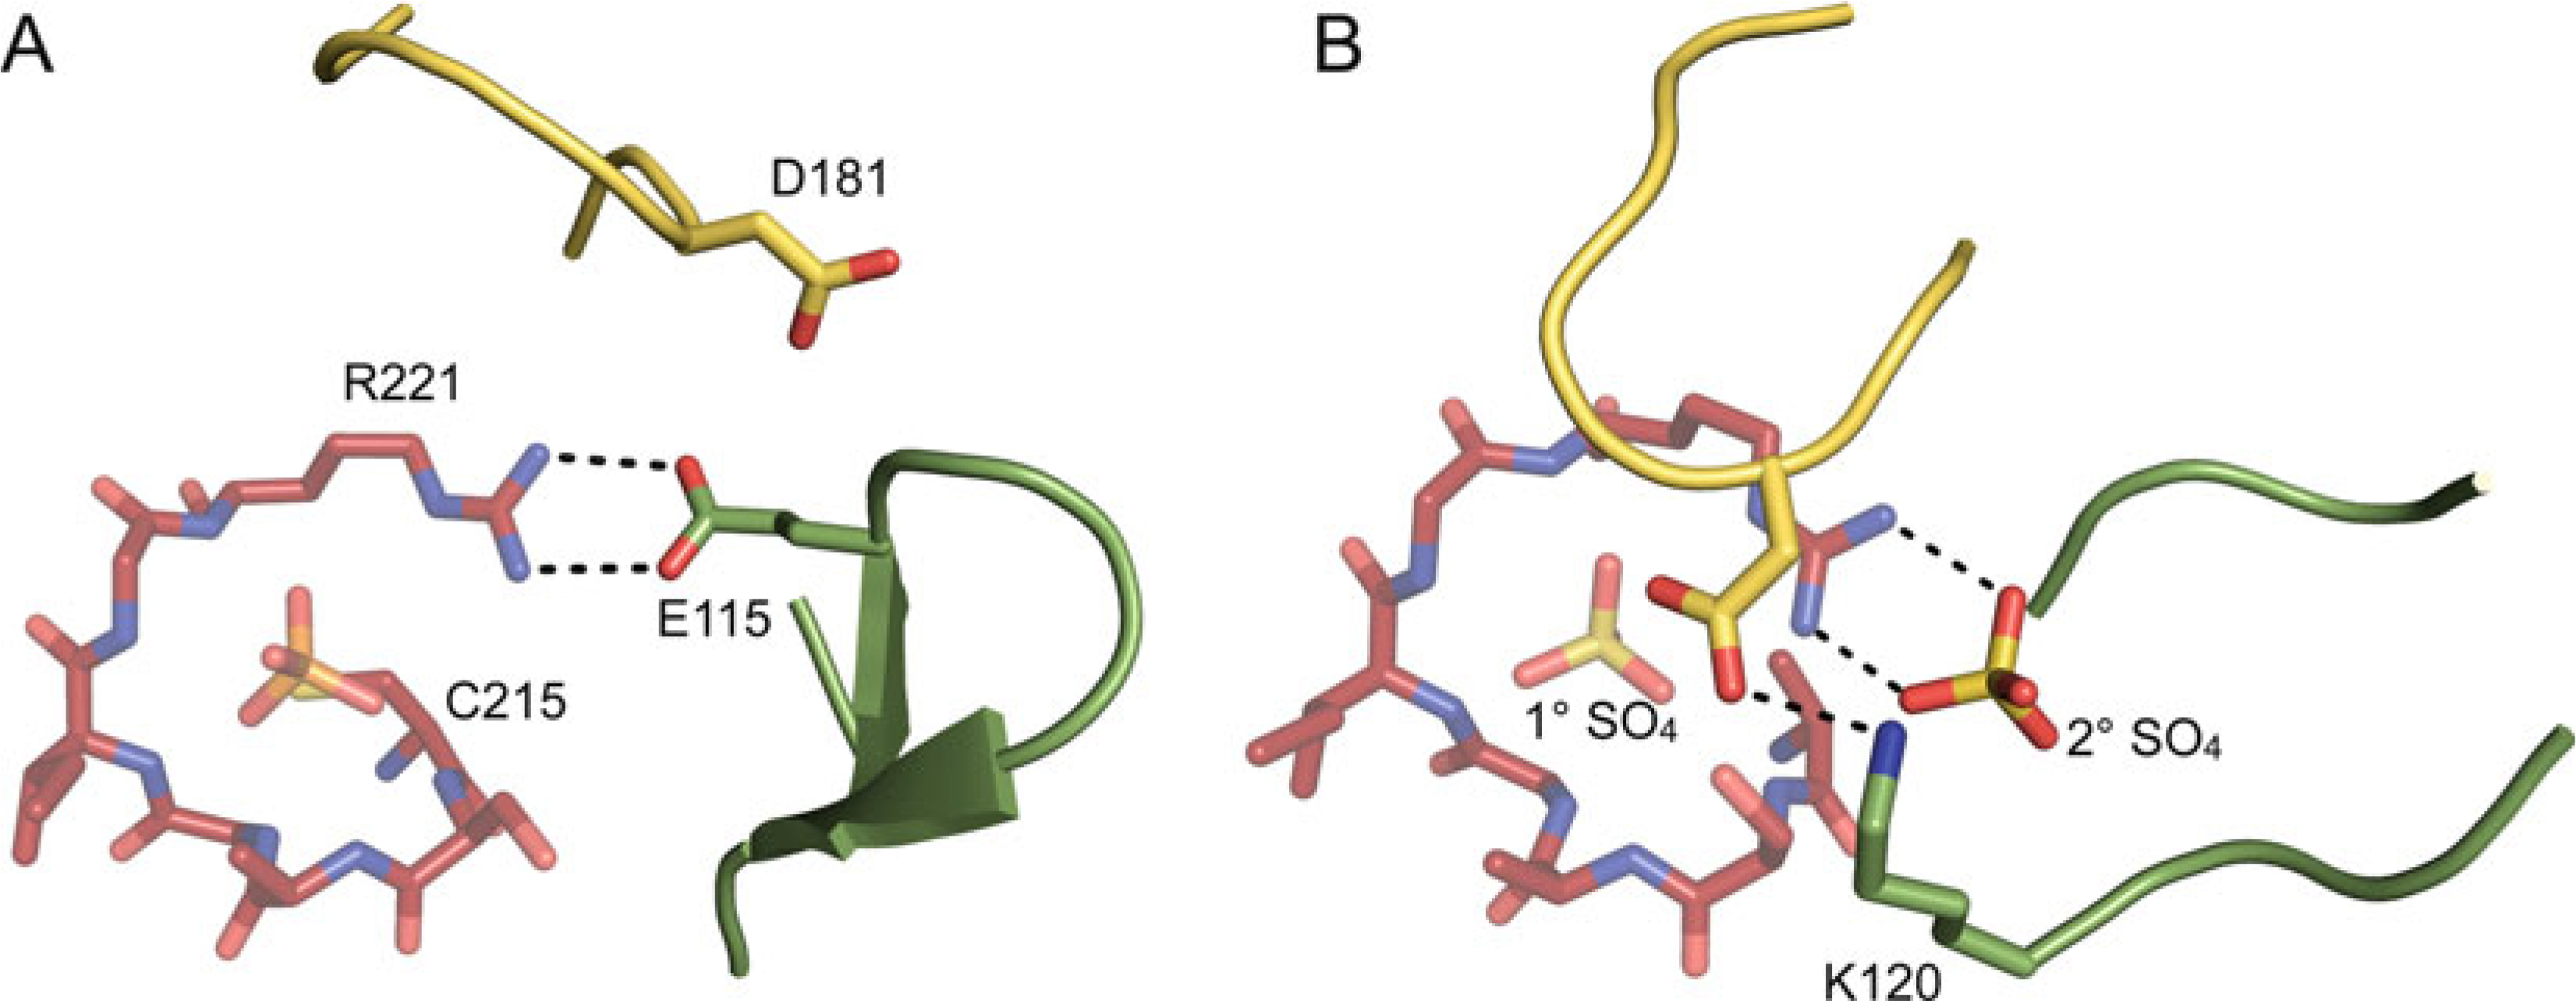
The E-loop. (a) The E-loop (green)
relative to the P-loop (red) and WPD-loop
(yellow) (PTP1B; PDB ID: 2HNQ). In this structure, the
WPD-loop is in the open conformation and the E-loop forms a tight
β-hairpin, with the E-loop glutamate (E115, shown in stick
representation) neutralizing the charge of the conserved P-loop arginine (R221).
(b) The E-loop (green) relative to the P-loop
(red) and WPD-loop (yellow) (PTP1B; PDB
ID: 2B4S). In this structure, the WPD-loop is in the closed conformation and the
E-loop does not form a β-hairpin and is partially disordered. The E-loop
lysine (K120) and catalytic aspartate of the WPD-loop (both shown in stick
representation) form a hydrogen bond, and a sulfate molecule is bound at the
active site (1° SO4) and at a secondary binding site
(2° SO4), which neutralizes the charge of the P-loop
arginine
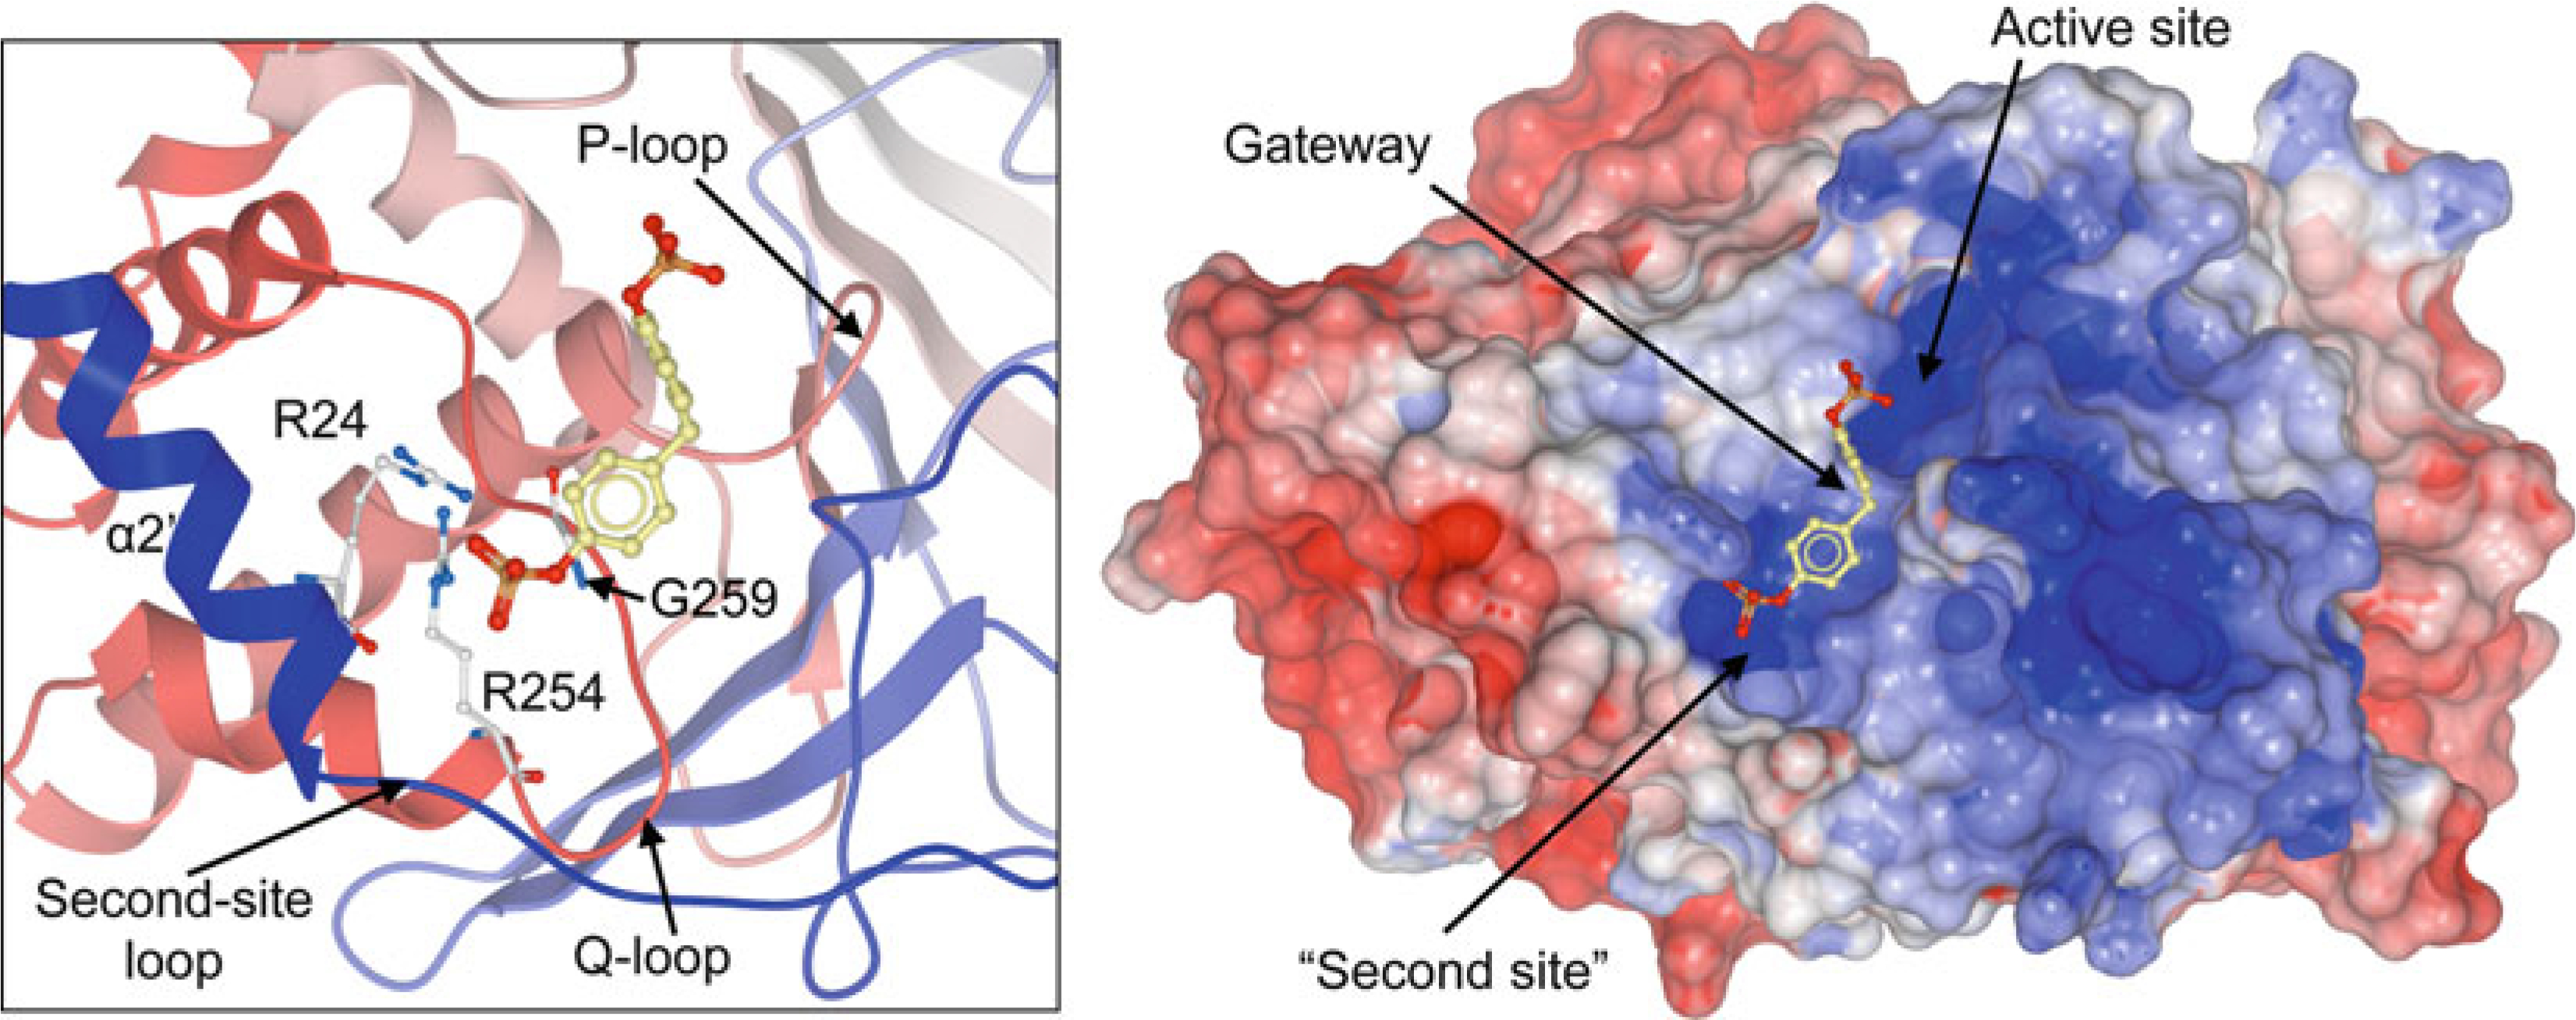
Binding of a small-molecule phosphate (methylenebis(4,1-phenylene)
bis(dihydrogen phosphate); shown in stick representation) to the “second
site” in PTP1B (PDB ID: 1AAX; shown as ribbon diagram (left
panel) and surface representation (right panel;
blue, most positive; red, most negative).
Second-site residues Arg24 and Arg 254, as well as gateway residue Gly259 are
shown in stick representation (left panel)
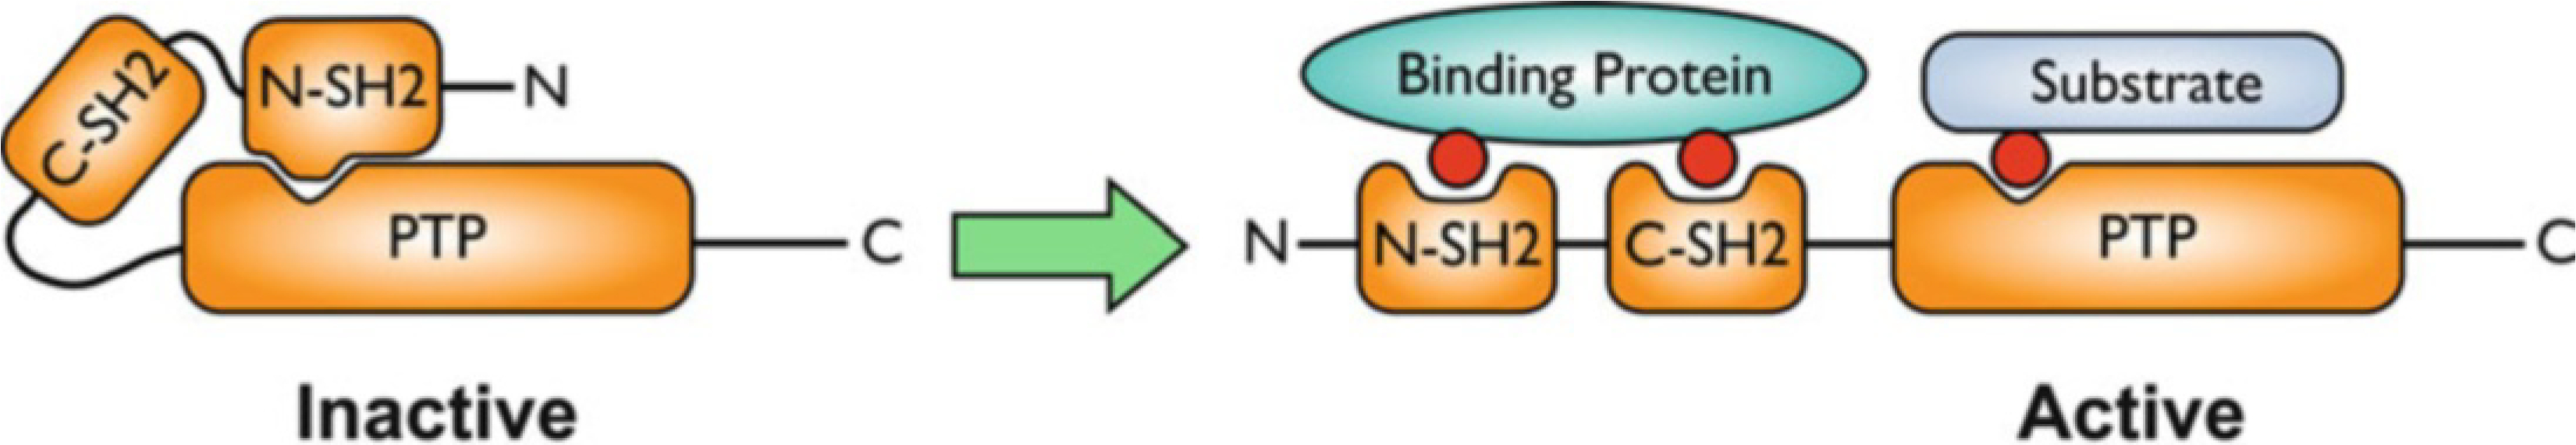
Activation of SHP2 by binding of specific pTyr-containing proteins
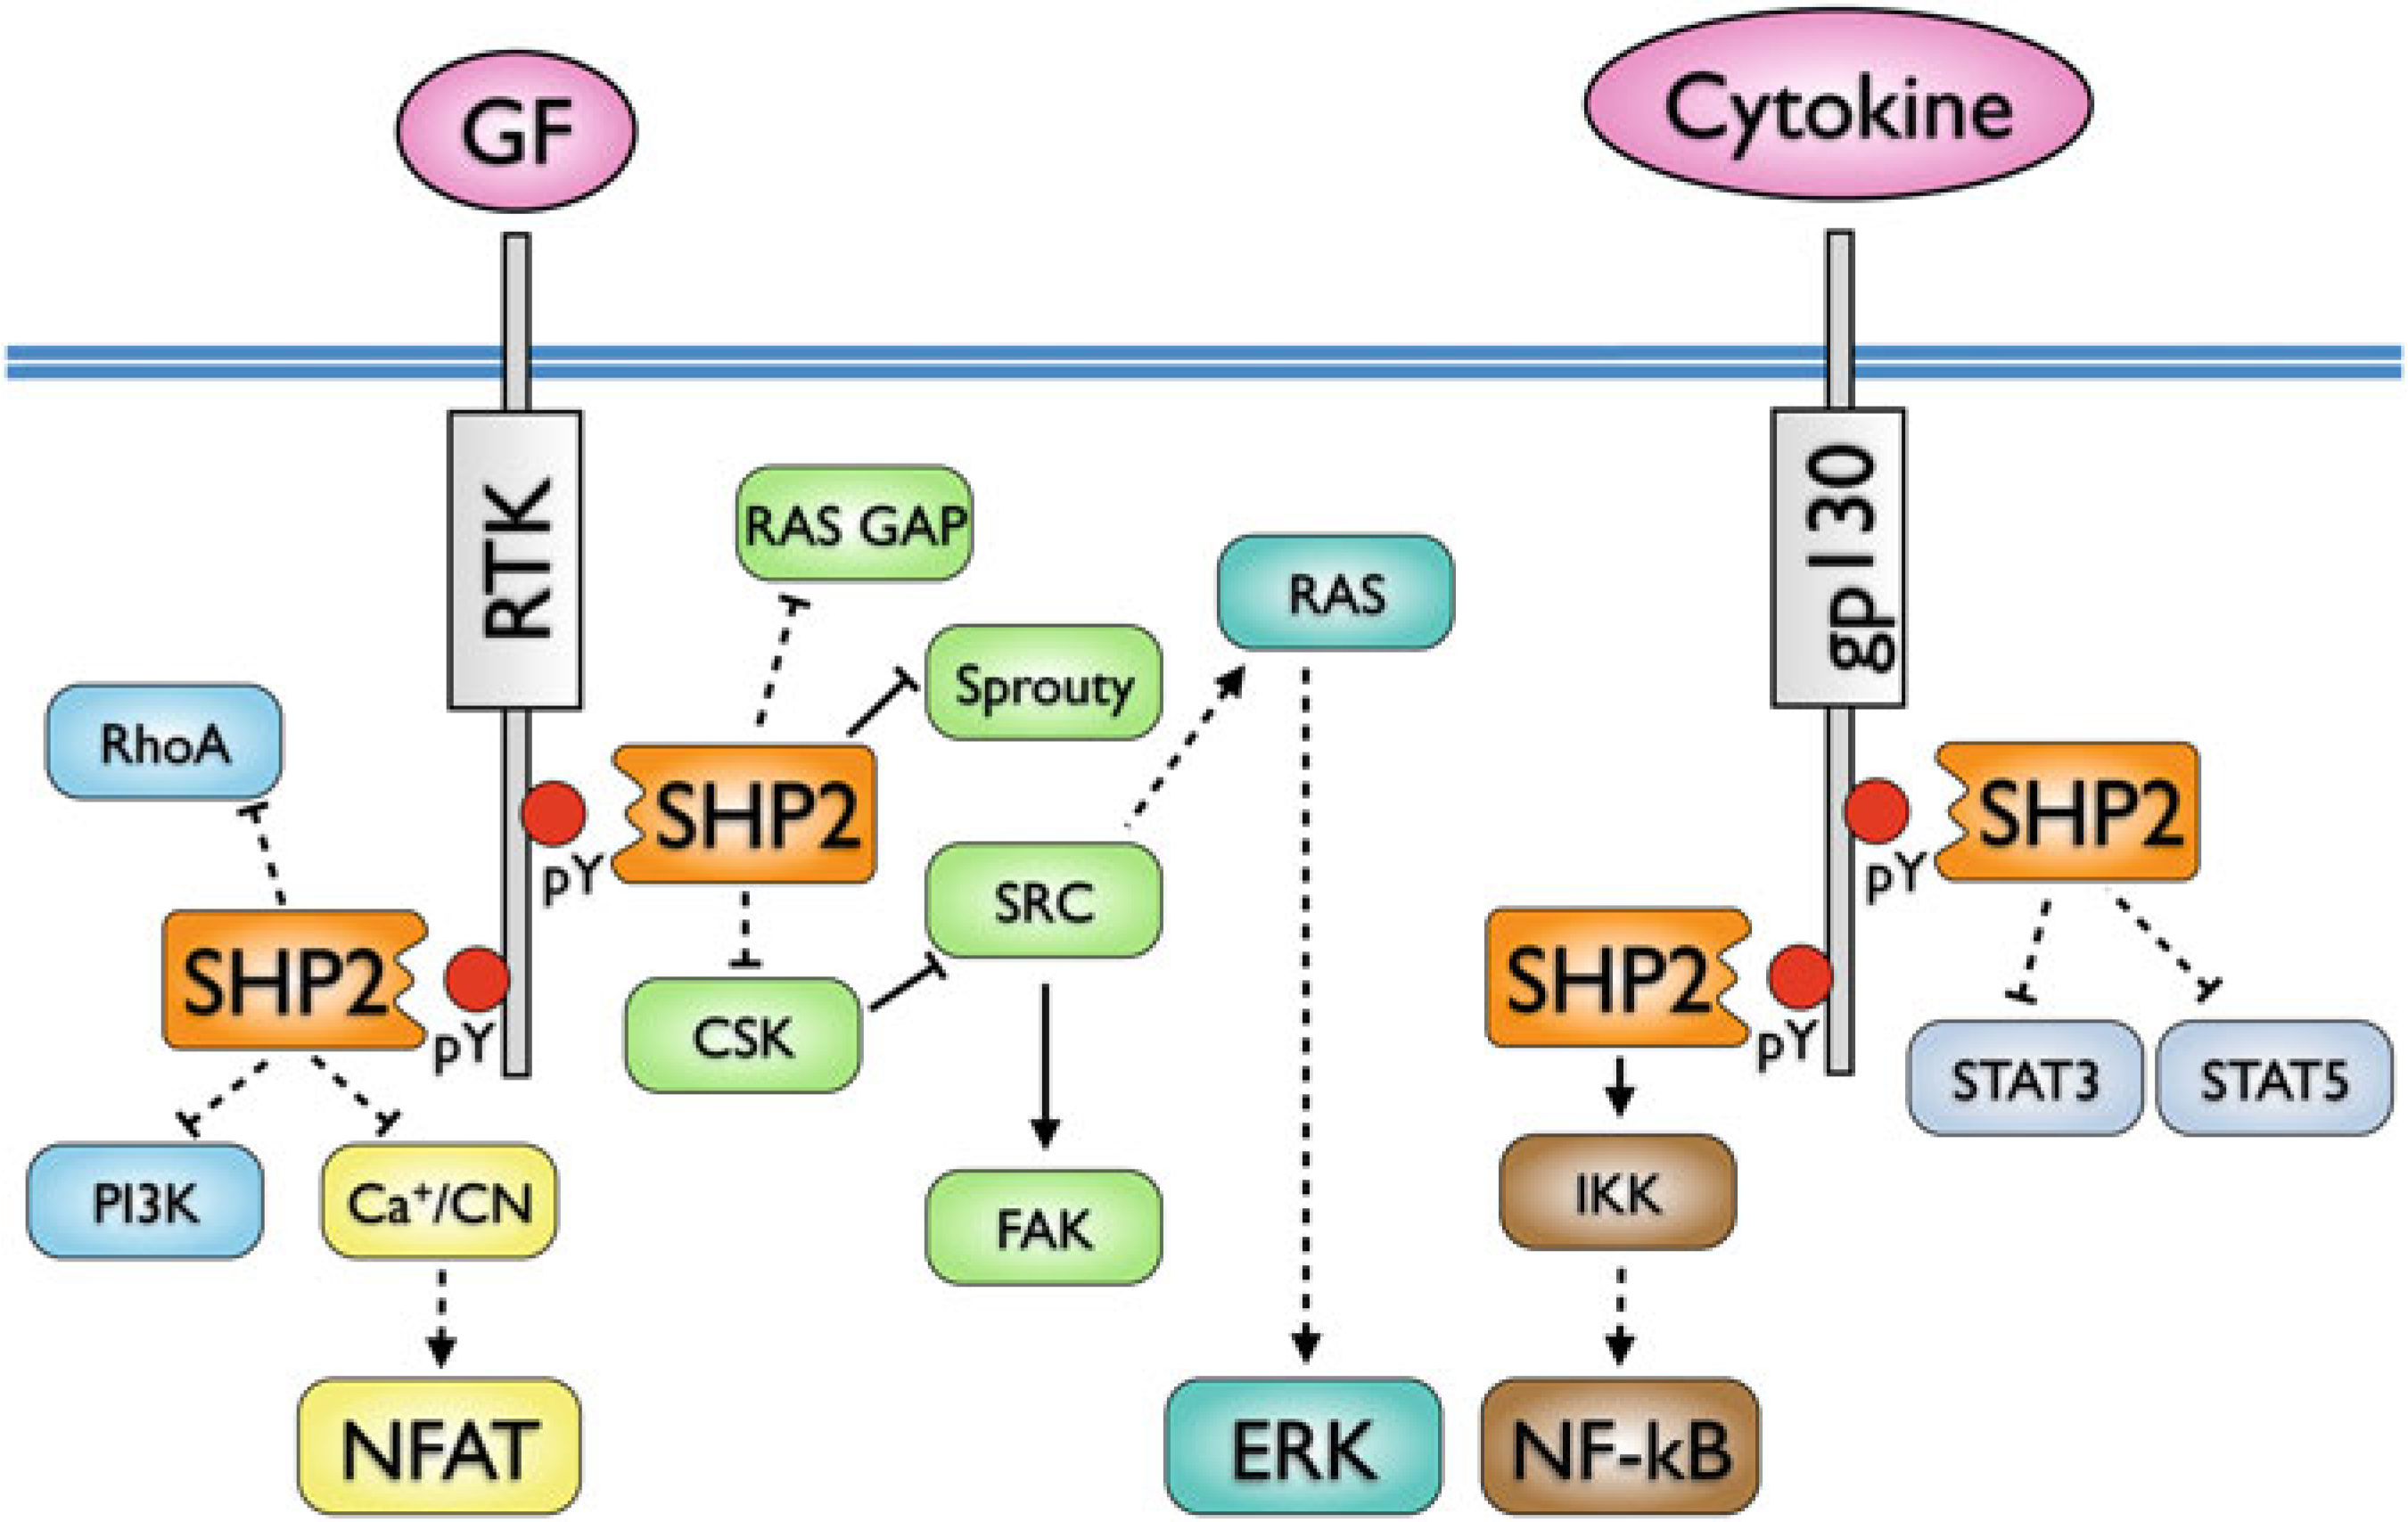
SHP2 interactions and signaling pathways in hematopoietic cells. Direct
interactions are indicated by solid lines, indirect
interactions by dashed lines (adapted from ref. 158)
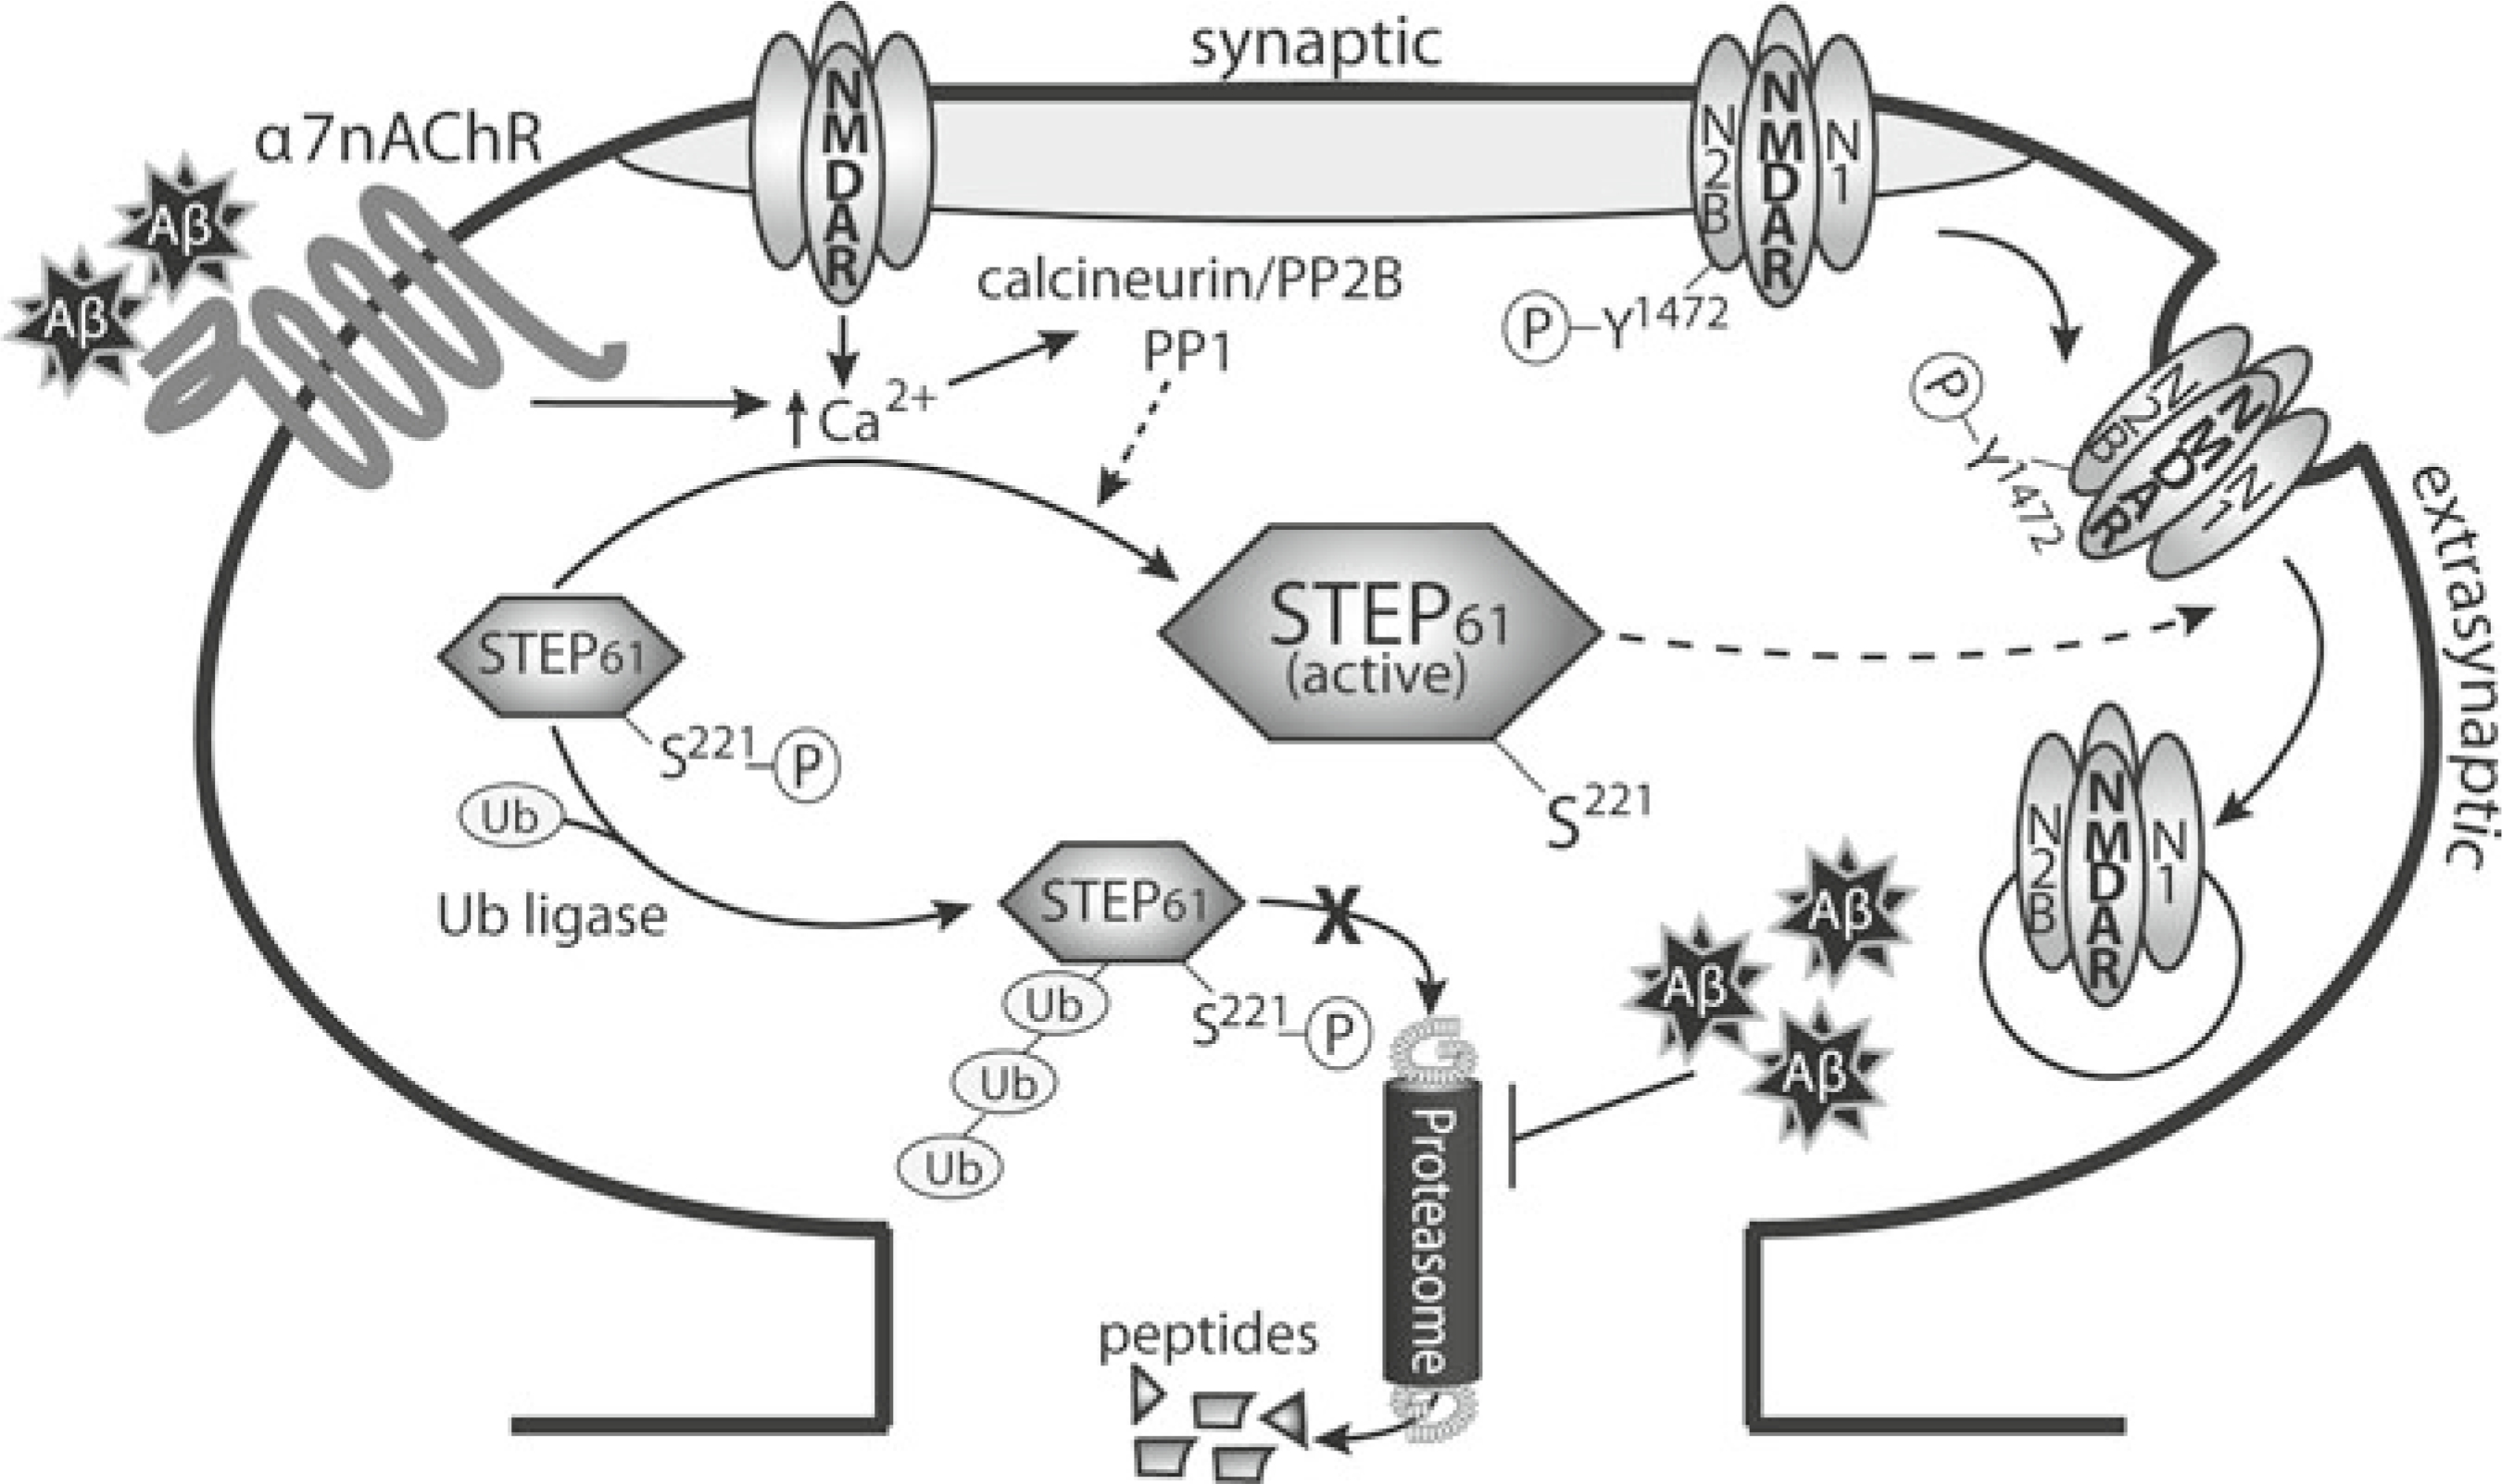
Model of glutamate receptor internalization through Aβ-mediated
activation of STEP. Aβ activates the α7 nicotinic receptor,
leading to Ca2+ influx and activation of calcineurin [197]. Calcineurin subsequently
dephosphorylates and activates STEP. Concomitantly, Aβ also elevates STEP
protein levels through inhibition of the ubiquitin proteasome system [203]. STEP dephosphorylates a regulatory
tyrosine residue in both the NR2B and GluR2 glutamate receptor subunits, leading
to internalization of the receptors [199, 200]. As a result, synaptic
function is disrupted (Figure from ref. , with permission)
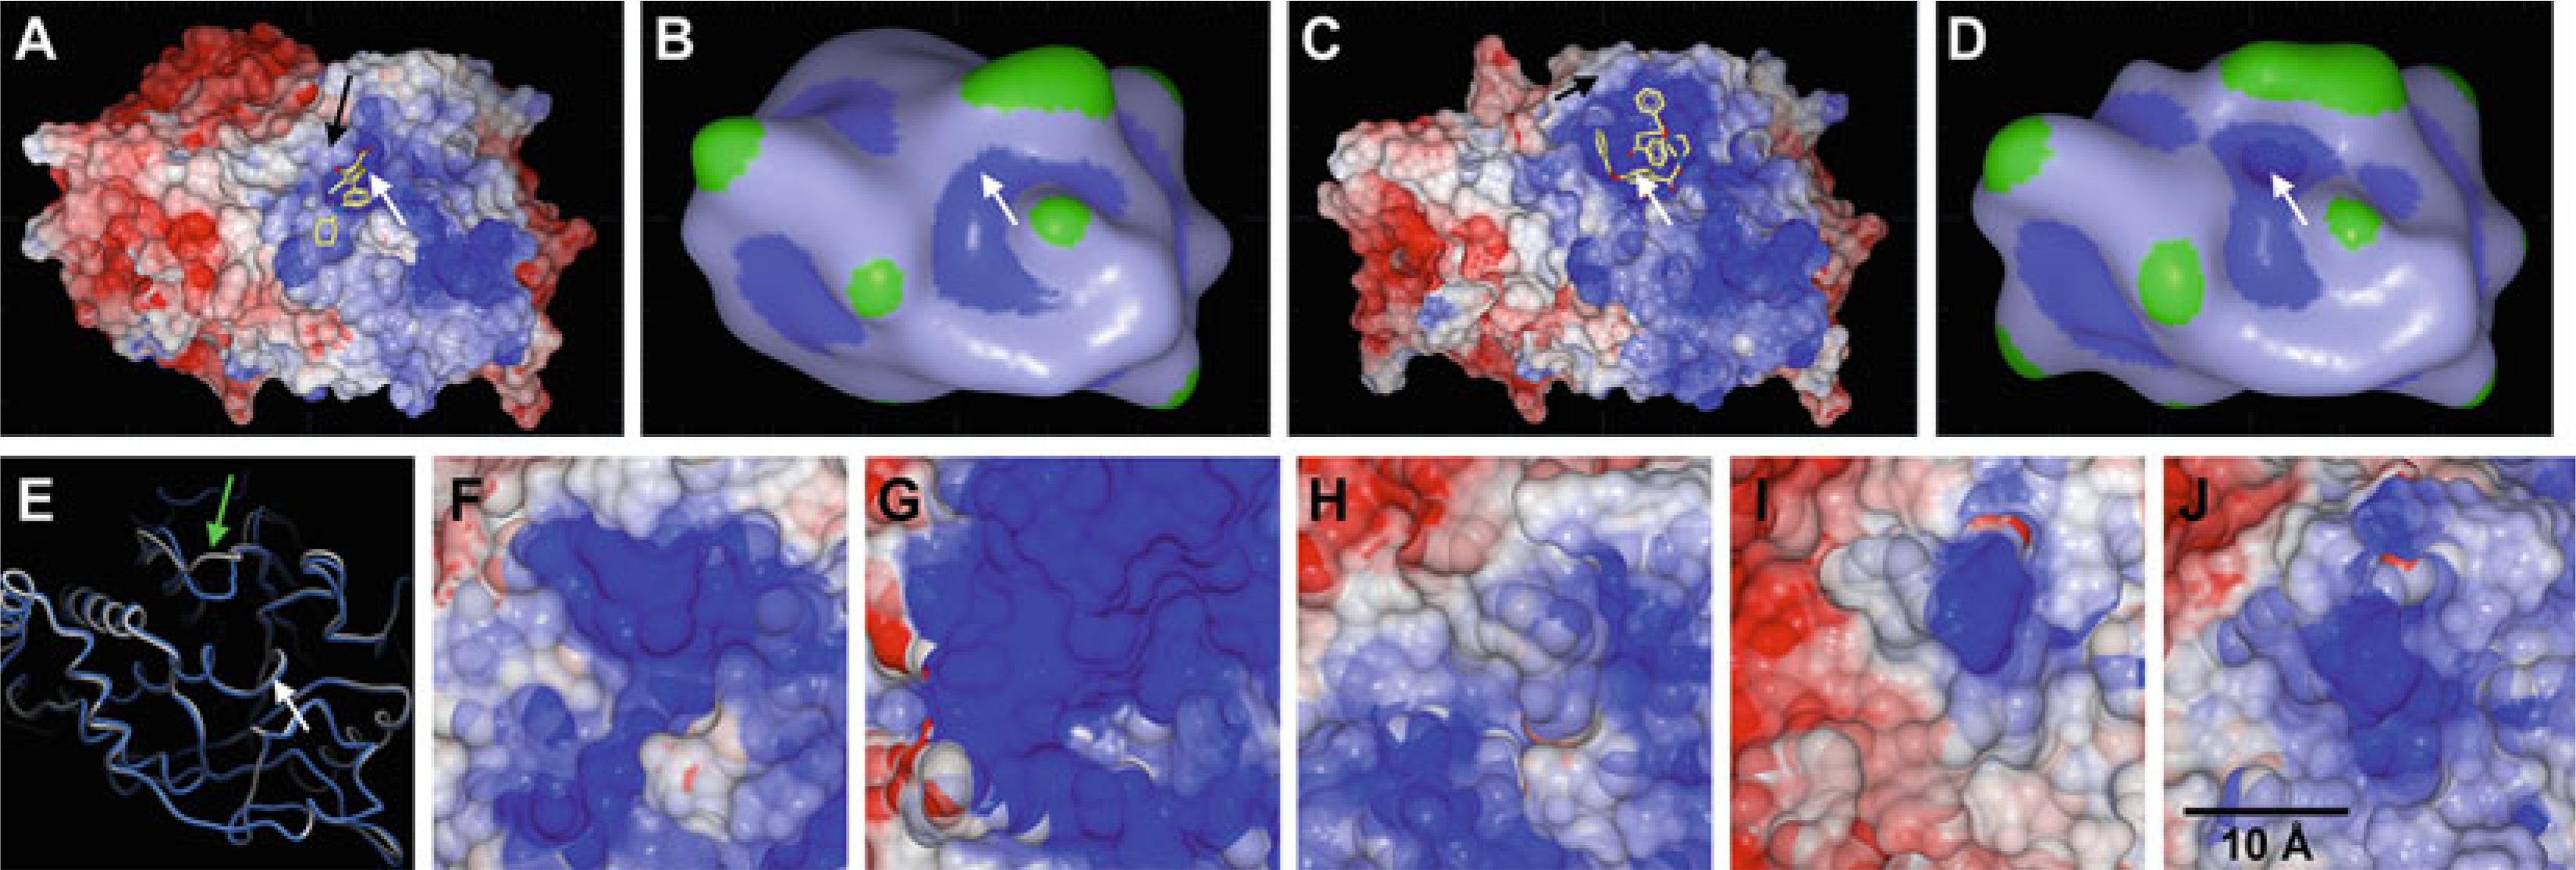
(a–d) Comparison of ligand binding to
PTP1B in closed state (a/b; PDB ID: 2QBS) and open state
(c/d; PDB ID: 3EAX). The protein surface in (a)
and (c) is colored by electrostatic potential as calculated and
rendered in ICM (blue, most positive; red,
most negative; the colors were capped at ±5 kcal/electron units).
Macroshape representations as rendered in ICM (blue, deepest
depression; green, largest protrusion) illustrate the
differences between the active site pockets in closed (b) and open
conformation (d). White arrows indicate the
position of the P-loop, black arrows indicate the WPD-loop in
closed state (a) and open state (c). (e)
Comparison of PTP1B with WPD-loop in closed (blue; PDB ID 2QBS)
and open (grey; PDB ID 3EAX) conformation. The white
arrow indicates the P-loop, the green arrow
indicates the WPD-loop. (f–j) Comparison of
open state conformation in PTP1B (f; PDB ID 3EB1), TCPTP
(g; PDB ID 1L8K), LYP (h; PDB ID 2P6X), LAR
(i; PDB ID 1LAR), and RPTPγ (j; PDB ID
2H4V). The protein surface is colored by electrostatic potential as calculated
and rendered in ICM (blue, most positive; red,
most negative; the colors were capped at ±5 kcal/electron units)
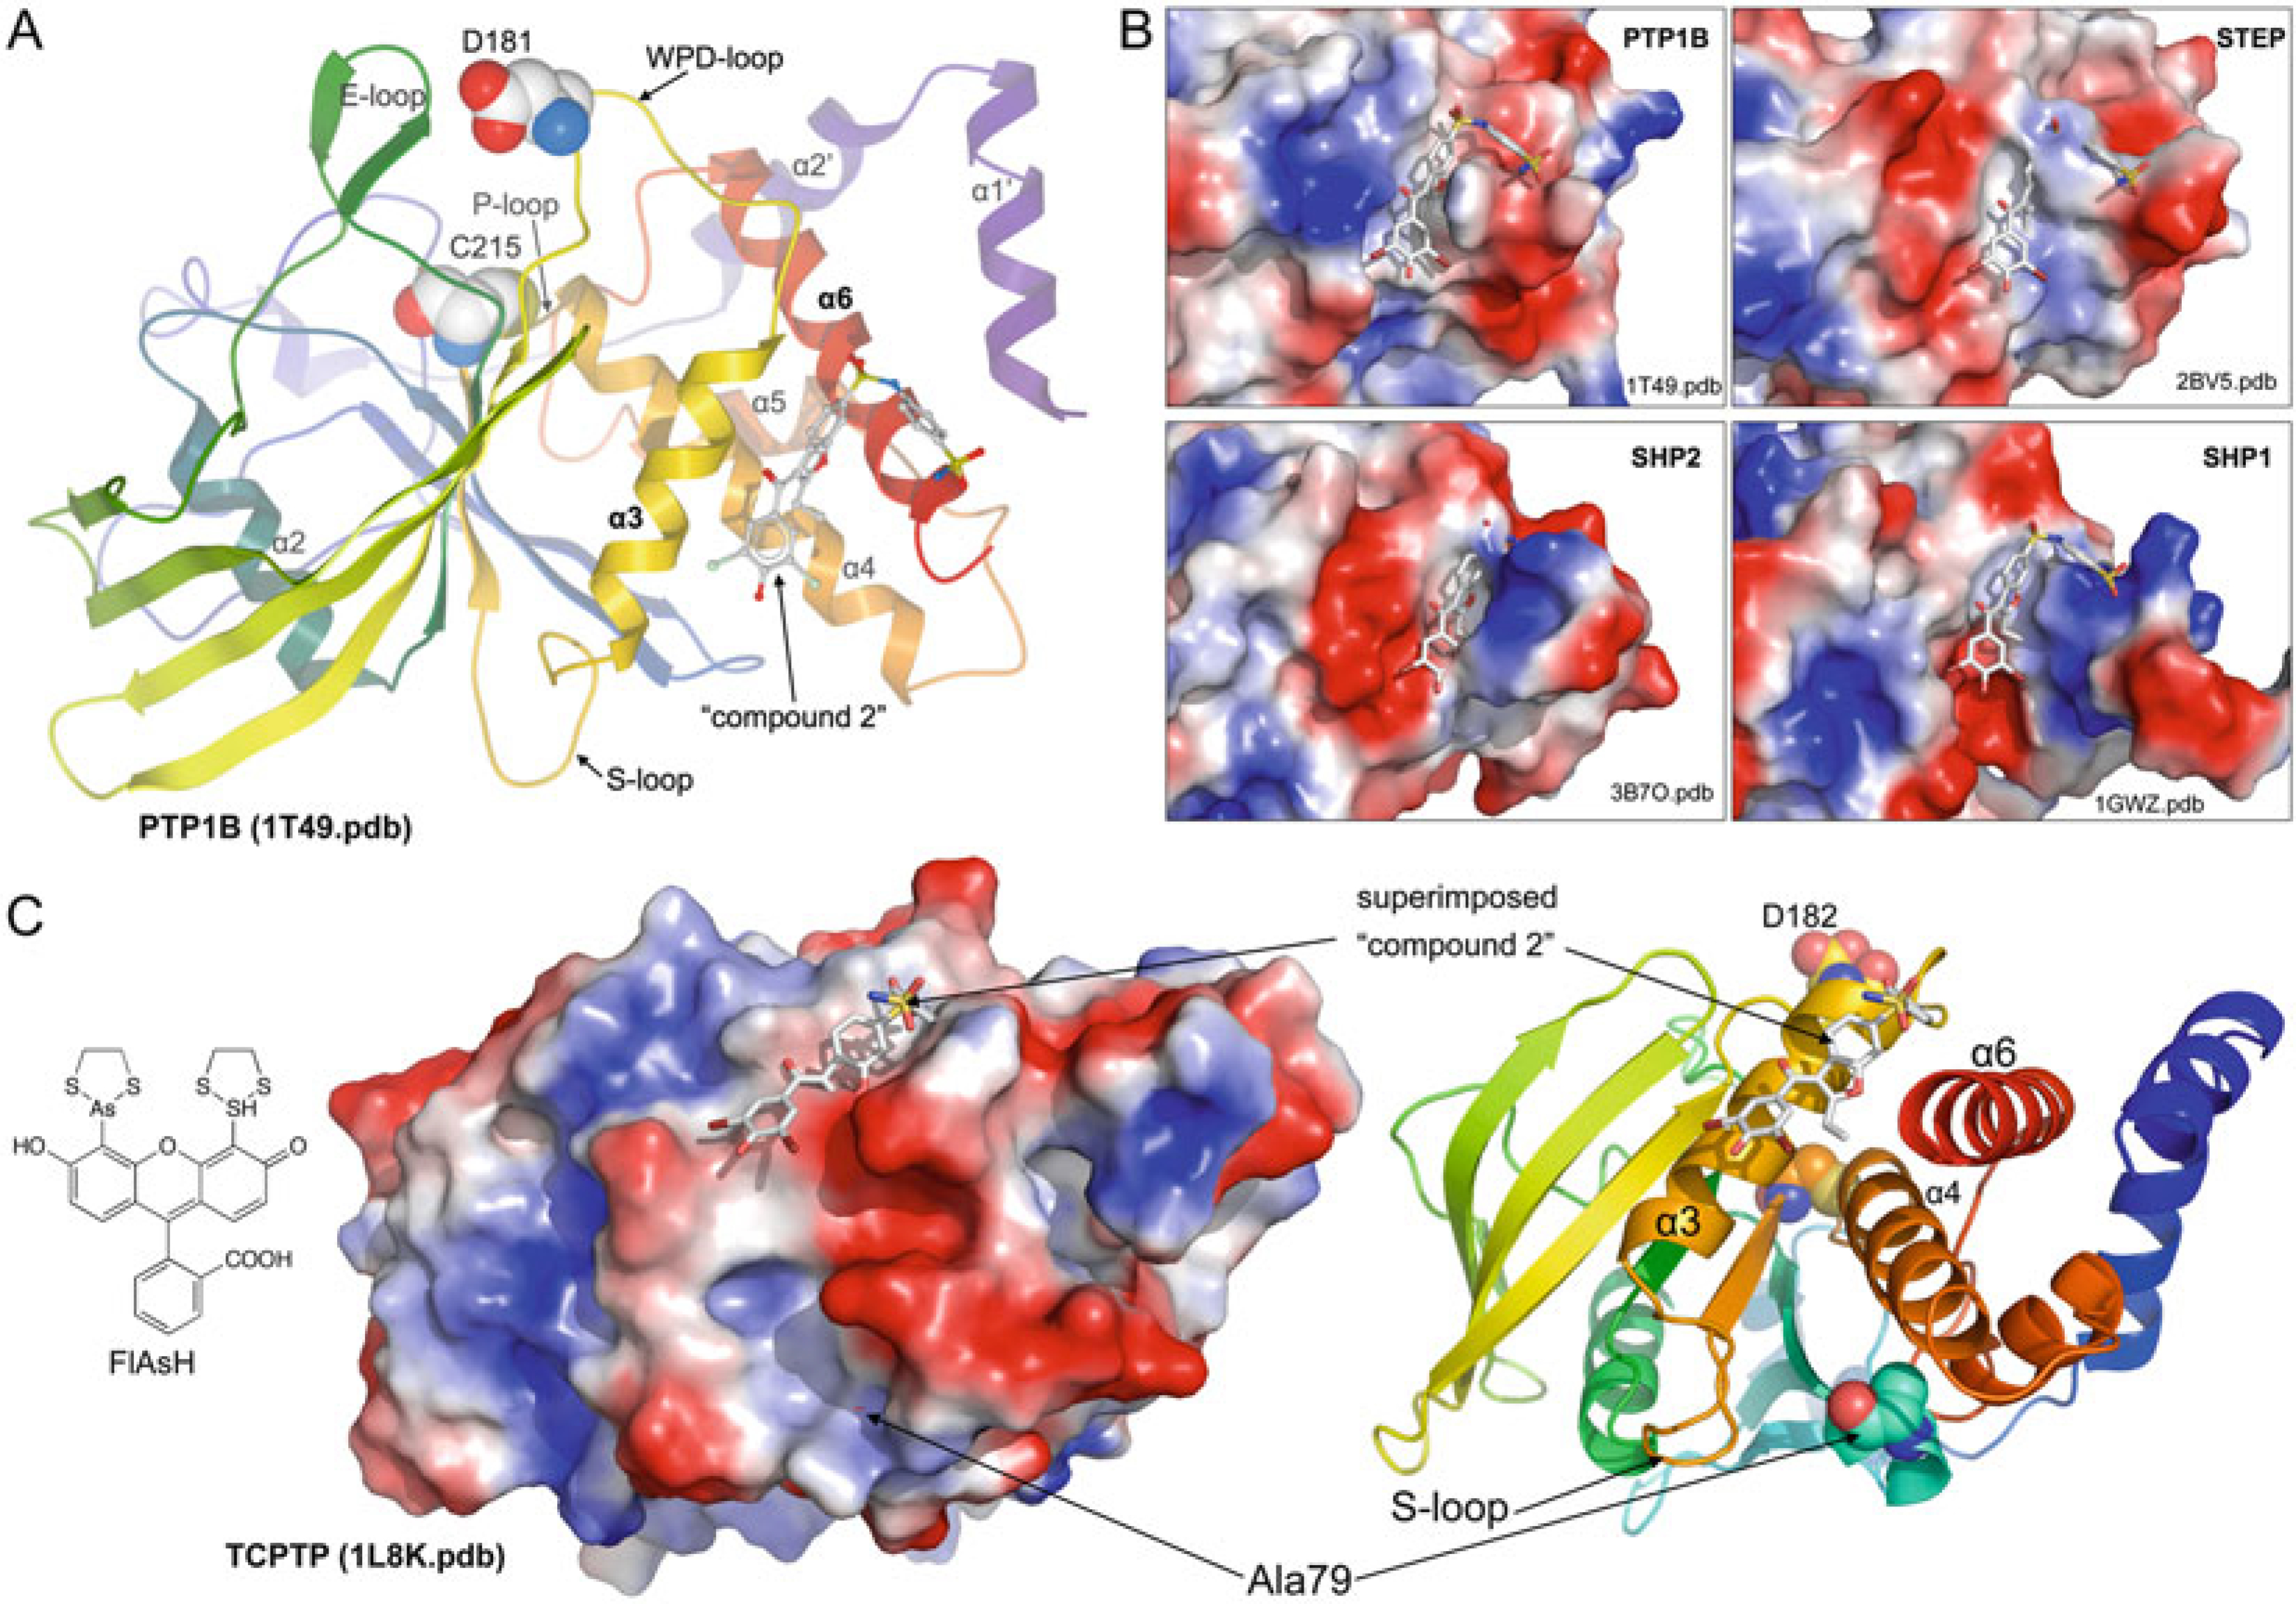
Allosteric inhibition of PTPs. (a) Crystal structure of
PTP1B complexed with an allosteric inhibitor (compound 2, shown in
ball-and-stick representation); catalytic Cys215 and Asp181 are shown as spheres
(PDB ID: 1T49, ref. 34). (b)
Comparison of the allosteric site in PTP1B (as in (a)) with
corresponding sites in STEP (PDB ID: 2BV5), SHP2 (PDB ID: 3B7O), and SHP1 (PDB
ID: 1GWZ). Structures are superimposed; proteins are shown in surface
representation (blue, most positive; red, most
negative); compound 2 is shown as reference in all structures. (c)
Scanning-insertional mutagenesis using FlAsH and a FlAsH-binding peptide
(TetraCys: CCPGCC) inserted at position Ala79 identifies a potential allosteric
site in TCPTP. To illustrate the location of the identified allosteric site, the
crystal structure of TCPTP (PDB ID: 1L8K) is shown as surface and ribbon
representation; Ala79, Cys216, and D182 are shown as spheres.
The PTP allosteric inhibitor (compound 2) is superimposed for orientation
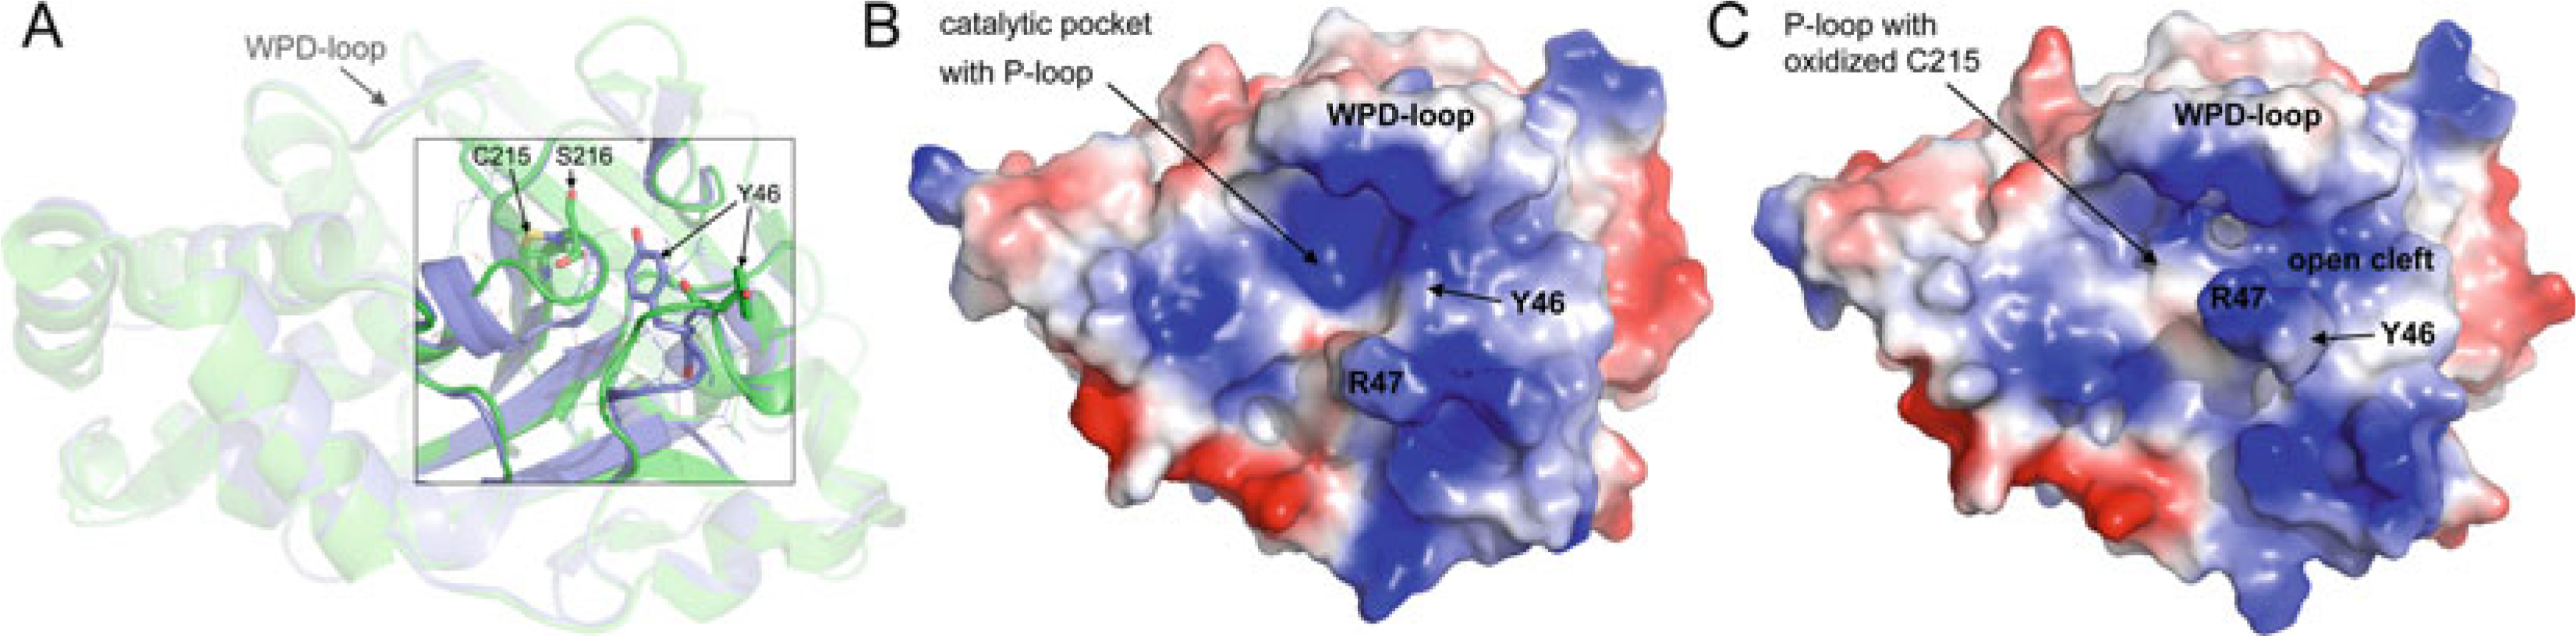
Comparison of reduced and oxidized states of PTP1B. (a)
Ribbon diagram of PTP1B in reduced state (blue; PDB ID: 2HNP)
and PTP1B in oxidized, sulphenyl-amide state (green, PDB ID:
1OEM). P-loop Cys215 and Ser216 residues, which form the sulphenyl-amide
five-membered ring, and pTyr-loop Tyr46 residues are shown in stick
representation. (b/c) Surface representation
(blue, most positive; red, most negative) of
PTP1B in the reduced state (b) and oxidized state
(c)
References
-
- Hunter T (2000) Signaling—2000 and beyond. Cell 100:113–127 - PubMed
-
- Pawson T, Scott JD (2005) Protein phosphorylation in signaling—50 years and counting. Trends Biochem Sci 30:286–290 - PubMed
-
- Luan S (2003) Protein phosphatases in plants. Annu Rev Plant Biol 54:63–92 - PubMed
-
- Deutscher J, Saier MHJ (2005) Ser/Thr/Tyr protein phosphorylation in bacteria—for long time neglected, now well established. J Mol Microbiol Biotechnol 9:125–131 - PubMed
-
- Feher Z, Szirak K (1999) Signal transduction in fungi—the role of protein phosphorylation. Acta Microbiol Immunol Hung 46:269–271 - PubMed
Publication types
MeSH terms
Substances
Grants and funding
LinkOut - more resources
Full Text Sources
Other Literature Sources
