

Quantitative fundus autofluorescence in healthy eyes
- PMID: 23860757
- PMCID: PMC3759220
- DOI: 10.1167/iovs.13-12445
Quantitative fundus autofluorescence in healthy eyes
Abstract
Purpose: Fundus autofluorescence was quantified (qAF) in subjects with healthy retinae using a standardized approach. The objective was to establish normative data and identify factors that influence the accumulation of RPE lipofuscin and/or modulate the observed AF signal in fundus images.
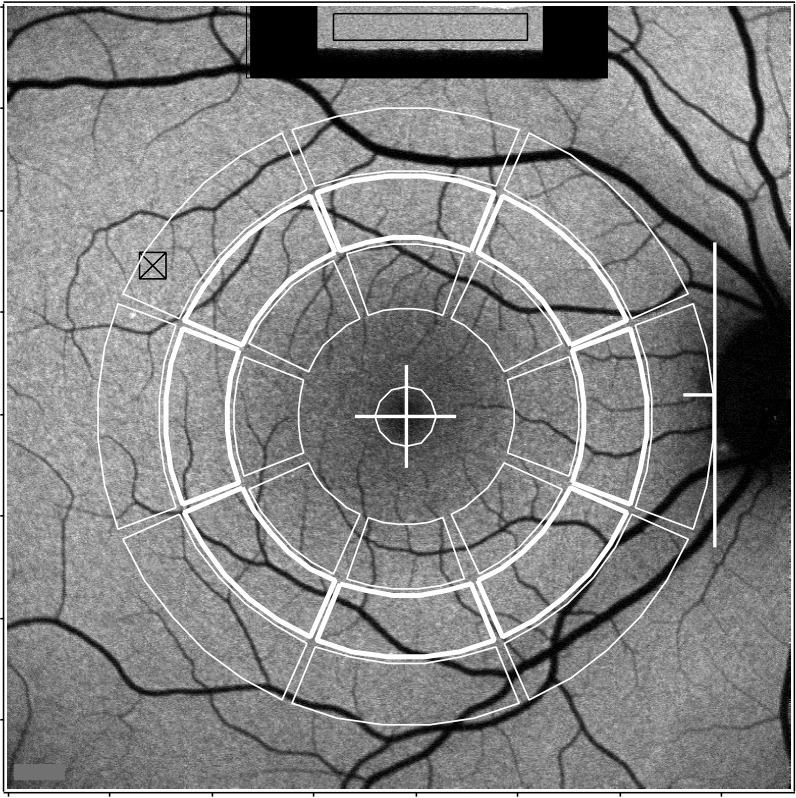
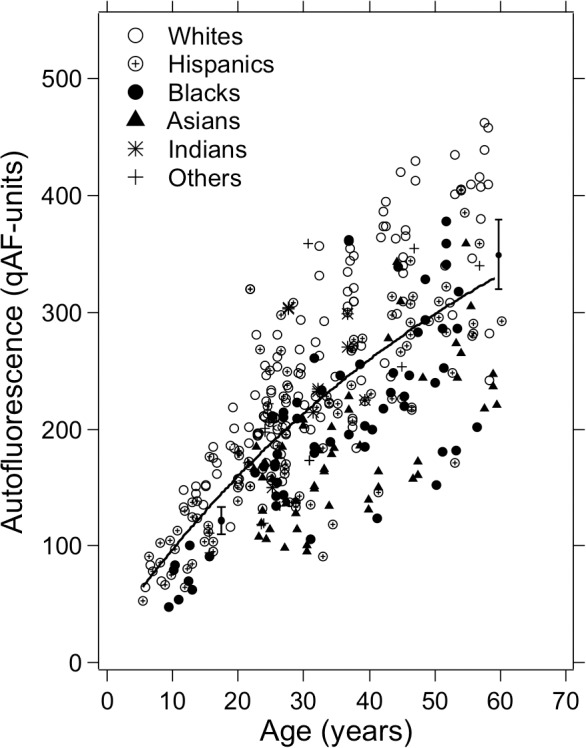
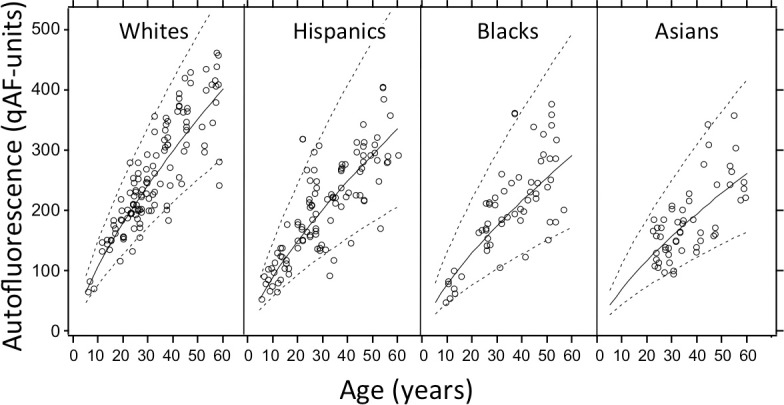
Methods: AF images were acquired from 277 healthy subjects (age range: 5-60 years) by employing a Spectralis confocal scanning laser ophthalmoscope (cSLO; 488-nm excitation; 30°) equipped with an internal fluorescent reference. For each image, mean gray level was calculated as the average of eight preset regions, and was calibrated to the reference, zero-laser light, magnification, and optical media density from normative data on lens transmission spectra. Relationships between qAF and age, sex, race/ethnicity, eye color, refraction/axial length, and smoking status were evaluated as was measurement repeatability and the qAF spatial distribution.
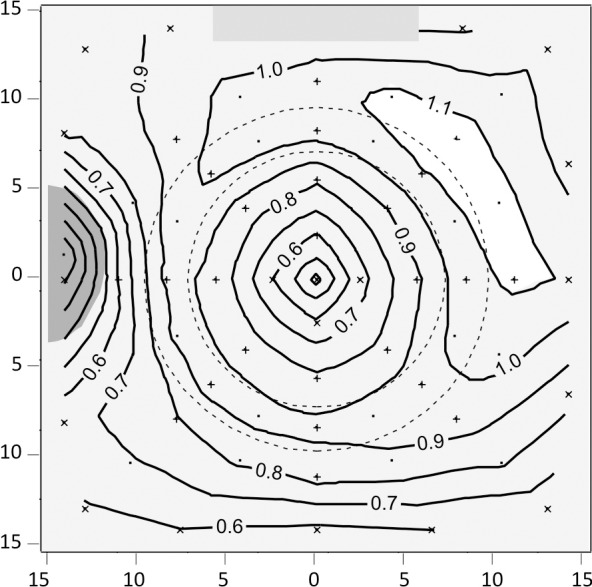
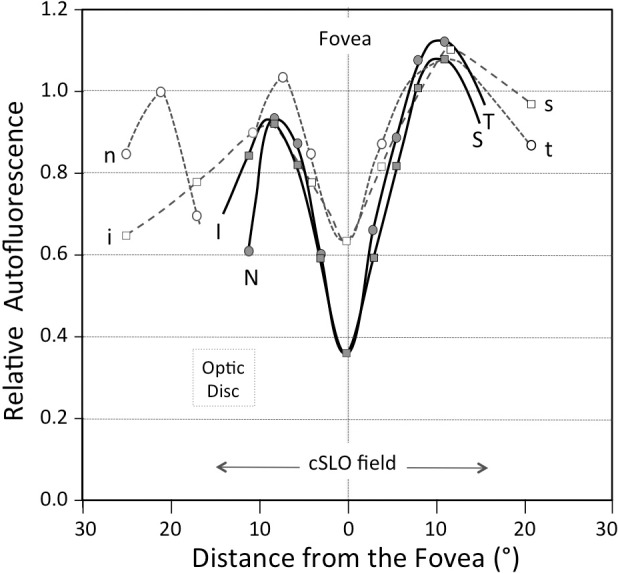
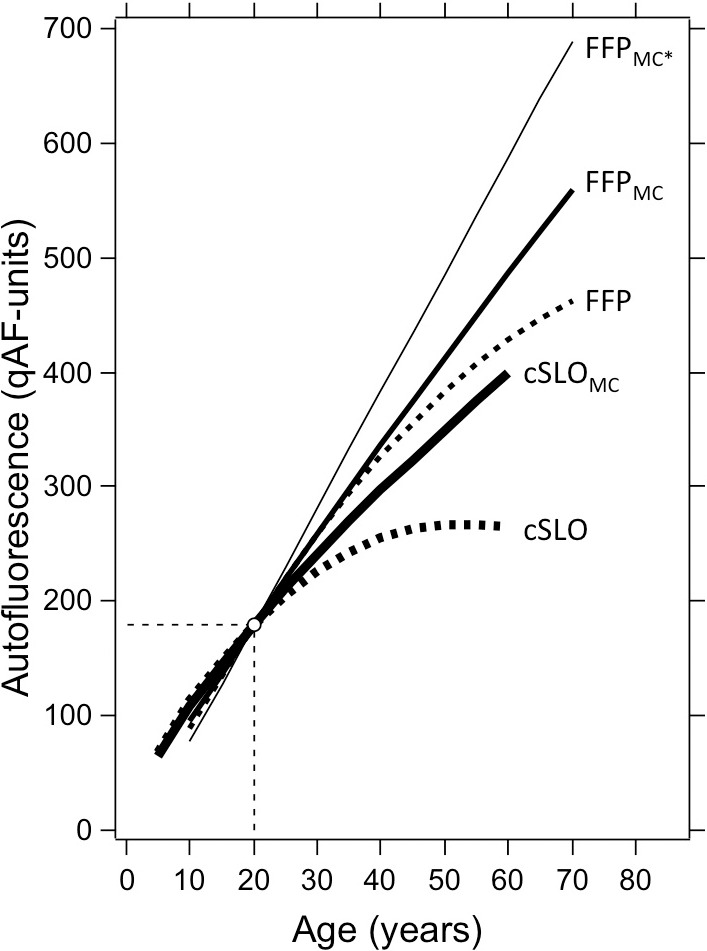
Results: qAF levels exhibited a significant increase with age. qAF increased with increasing eccentricity up to 10° to 15° from the fovea and was highest superotemporally. qAF values were significantly greater in females, and, compared with Hispanics, qAF was significantly higher in whites and lower in blacks and Asians. No associations with axial length and smoking were observed. For two operators, between-session repeatability was ± 9% and ± 12%. Agreement between the operators was ± 13%.
Conclusions: Normative qAF data are a reference tool essential to the interpretation of qAF measurements in ocular disease.
Keywords: lipofuscin; melanin; quantitative fundus autofluorescence; retina; retinal pigment epithelium; scanning laser ophthalmoscope.
Figures
Similar articles
-
Quantitative fundus autofluorescence in smokers compared to non-smokers.Exp Eye Res. 2019 Jul;184:48-55. doi: 10.1016/j.exer.2019.04.004. Epub 2019 Apr 13. Exp Eye Res. 2019. PMID: 30991052
-
Quantitative fundus autofluorescence in recessive Stargardt disease.Invest Ophthalmol Vis Sci. 2014 May 1;55(5):2841-52. doi: 10.1167/iovs.13-13624. Invest Ophthalmol Vis Sci. 2014. PMID: 24677105 Free PMC article.
-
Quantitative fundus autofluorescence in mice: correlation with HPLC quantitation of RPE lipofuscin and measurement of retina outer nuclear layer thickness.Invest Ophthalmol Vis Sci. 2013 Apr 17;54(4):2812-20. doi: 10.1167/iovs.12-11490. Invest Ophthalmol Vis Sci. 2013. PMID: 23548623 Free PMC article.
-
Lessons learned from quantitative fundus autofluorescence.Prog Retin Eye Res. 2020 Jan;74:100774. doi: 10.1016/j.preteyeres.2019.100774. Epub 2019 Aug 28. Prog Retin Eye Res. 2020. PMID: 31472235 Free PMC article. Review.
-
[Fundus autofluorescence examination using a confocal scanning laser ophthalmoscope HRA (Heidelberg Retina Angiograph)].Klin Oczna. 2005;107(7-9):544-7. Klin Oczna. 2005. PMID: 16417019 Review. Polish.
Cited by
-
Ex Vivo Confocal Spectroscopy of Autofluorescence in Age-Related Macular Degeneration.PLoS One. 2016 Sep 15;11(9):e0162869. doi: 10.1371/journal.pone.0162869. eCollection 2016. PLoS One. 2016. PMID: 27631087 Free PMC article.
-
Fundus autofluorescence in premature infants.Sci Rep. 2021 Apr 23;11(1):8823. doi: 10.1038/s41598-021-88262-z. Sci Rep. 2021. PMID: 33893363 Free PMC article.
-
Adaptive optics fluorescence lifetime imaging ophthalmoscopy of in vivo human retinal pigment epithelium.Biomed Opt Express. 2022 Feb 25;13(3):1737-1754. doi: 10.1364/BOE.451628. eCollection 2022 Mar 1. Biomed Opt Express. 2022. PMID: 35414970 Free PMC article.
-
Repeatability of Quantitative Autofluorescence Imaging in a Multicenter Study Involving Patients With Recessive Stargardt Disease 1.Transl Vis Sci Technol. 2023 Feb 1;12(2):1. doi: 10.1167/tvst.12.2.1. Transl Vis Sci Technol. 2023. PMID: 36723966 Free PMC article.
-
Spatial and spatio-temporal statistical analyses of retinal images: a review of methods and applications.BMJ Open Ophthalmol. 2020 May 28;5(1):e000479. doi: 10.1136/bmjophth-2020-000479. eCollection 2020. BMJ Open Ophthalmol. 2020. PMID: 32537517 Free PMC article. Review.
References
Publication types
MeSH terms
Substances
Grants and funding
LinkOut - more resources
Full Text Sources
Other Literature Sources
