. 2013 Oct;154(10):3539-51.
doi: 10.1210/en.2012-2127. Epub 2013 Jul 16.

A novel experimental strategy to assess the metabolic effects of selective activation of a G(q)-coupled receptor in hepatocytes in vivo

Affiliations

A novel experimental strategy to assess the metabolic effects of selective activation of a G(q)-coupled receptor in hepatocytes in vivo

Jian Hua Li et al. Endocrinology. 2013 Oct.

Abstract

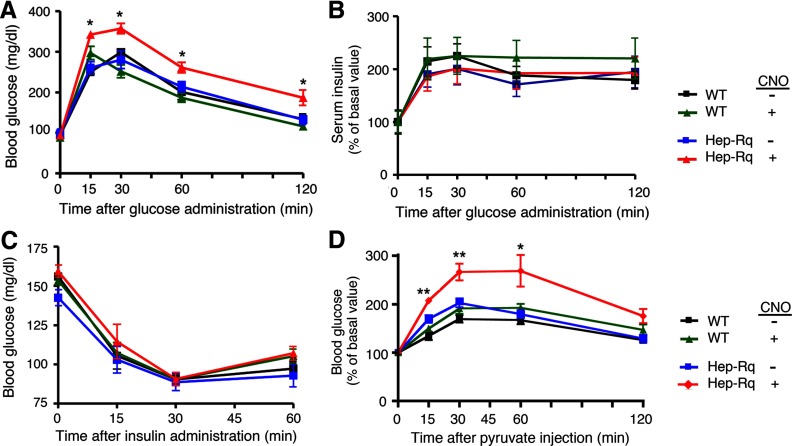
Increased hepatic glucose production is a key pathophysiological feature of type 2 diabetes. Like all other cell types, hepatocytes express many G protein-coupled receptors (GPCRs) that are linked to different functional classes of heterotrimeric G proteins. The important physiological functions mediated by G(s)-coupled hepatic glucagon receptors are well-documented. In contrast, little is known about the in vivo physiological roles of hepatocyte GPCRs that are linked to G proteins of the G(q) family. To address this issue, we established a transgenic mouse line (Hep-Rq mice) that expressed a G(q)-linked designer receptor (Rq) in a hepatocyte-selective fashion. Importantly, Rq could no longer bind endogenous ligands but could be selectively activated by a synthetic drug, clozapine-N-oxide. Clozapine-N-oxide treatment of Hep-Rq mice enabled us to determine the metabolic consequences caused by selective activation of a G(q)-coupled GPCR in hepatocytes in vivo. We found that acute Rq activation in vivo led to pronounced increases in blood glucose levels, resulting from increased rates of glycogen breakdown and gluconeogenesis. We also demonstrated that the expression of the V(1b) vasopressin receptor, a G(q)-coupled receptor expressed by hepatocytes, was drastically increased in livers of ob/ob mice, a mouse model of diabetes. Strikingly, treatment of ob/ob mice with a selective V(1b) receptor antagonist led to reduced glucose excursions in a pyruvate challenge test. Taken together, these findings underscore the importance of G(q)-coupled receptors in regulating hepatic glucose fluxes and suggest novel receptor targets for the treatment of type 2 diabetes.


Figures

Figure 1.
Figure 1.
Liver-specific expression of the Rq designer GPCR in Hep-Rq mice. A, Schematic diagram of the transgene construct that was injected into fertilized mouse oocytes. The Rq receptor (white box) represents a mutant M3 muscarinic receptor containing the Y148C and A238G point mutations within the transmembrane receptor core (16). Rq expression was under the transcriptional control of the albumin promoter/enhancer. The 3′ untranslated region (UTR) consisted of a sequence derived from the human GH gene (hGH). To facilitate genotyping studies, a 9–amino-acid hemagglutinin (HA) epitope tag was added to the N terminus of the Rq construct. B, RT-PCR analysis of Rq transgene expression in different tissues from Hep-Rq mice. RT-PCR experiments were performed as described in Materials and Methods using an Rq-specific primer pair. As expected, Rq expression was found only with RNA derived from the liver. Control samples (indicated by the − signs above the lanes) that had not been treated with reverse transcriptase (RT) did not give any detectable signal (C. Cortex; cerebral cortex; Hypot., hypothalamus; Subm. gland, submandibular gland). C, Real-time qRT-PCR analysis of hepatic Rq and glucagon receptor (GCGR) expression in Hep-Rq mice. qRT-PCR experiments were carried out using mouse liver cDNA derived from Hep-Rq mice as described in Materials and Methods, using receptor-specific primers. Gene expression data are expressed as Ct values. Cyclophilin A expression was monitored for control purposes. The cyclophilin A and GCGR Ct values found with Hep-Rq mice did not differ significantly from the corresponding values obtained with WT mice. Data represent means ± SEM of 3 independent experiments. D, CNO-induced calcium mobilization in primary hepatocytes from Hep-Rq mice. Primary hepatocytes were isolated from WT and Hep-Rq mice, and agonist-induced changes in intracellular calcium levels were determined by using FLIPR technology (see Materials and Methods for details). AVP (10μM) served as a control agonist. CNO was used at a concentration of 100μM. Data are expressed as means ± SEM of 2 independent experiments performed in duplicate. **, P < .01; ***, P < .001, as compared with non–drug-treated mice of the same genotype. E, CNO triggers calcium release in hepatocytes from Hep-Rq but not WT mice. Primary hepatocytes prepared from Hep-Rq and WT mice were cultured on glass coverslips as described in Materials and Methods. Cells were treated with CNO (10μM) and AVP (100nM) at the indicated time points, and changes in cytosolic calcium were visualized via microscopy with fura-2. Data are expressed as means ± SEM (WT, 21 cells; Hep-Rq, 19 cells).
Figure 2.
Figure 2.
CNO treatment of Hep-Rq mice leads to dose-dependent increases in blood glucose levels. A and B, Effect of increasing doses of CNO on blood glucose levels in Hep-Rq mice. Hep-Rq mice (6-week-old males) that had been fasted for 5 hours received a single ip injection of increasing doses of CNO or vehicle (saline), and blood glucose levels were measured at the indicated time points. WT littermates received a single high dose of CNO (10 mg/kg ip). Data are expressed as percent increase in blood glucose levels above basal levels (100%) measured before injections. Basal blood glucose levels were as follows: WT, 132 ± 4 mg/dL; Hep-Rq, 129 ± 7 mg/dL. Blood glucose levels were significantly increased (P < .05) at 15 and 30 minutes in Hep-Rq mice treated with 0.1, 1, and 10 mg/kg CNO (ip), as compared with saline-injected Hep-Rq mice. B, Plot illustrating that the acute effects of CNO on blood glucose levels in Hep-Rq mice are dose-dependent. Data were taken from A (15-minute time point). C, CNO treatment of Hep-Rq mice has no significant effect on serum insulin levels. Hep-Rq mice and WT littermates (6-week-old males) that had been fasted for 5 hours received a single ip injection of CNO (10 mg/kg) or vehicle (saline), and serum insulin levels were measured at the indicated time points. Data are given as means ± SEM (n = 5 per group).
Figure 3.
Figure 3.
Physiological analysis of Hep-Rq mice and WT littermates. A, Glucose tolerance test. Hep-Rq mice and WT littermates were injected with either glucose alone (2 mg/g ip) (−CNO) or together with CNO (10 mg/kg ip). Blood glucose levels were measured at the indicated time points. B, Glucose-induced insulin release. Serum insulin levels were measured at the indicated time points, after treatment of Hep-Rq mice and WT littermates with either glucose alone (2 mg/g ip) (−CNO) or in combination with CNO (10 mg/kg ip). Basal (preinjection) serum insulin levels were set equal to 100%. Actual basal serum insulin levels were as follows: WT, 0.80 ± 0.12 ng/mL (n = 12); Hep-Rq, 1.01 ± 0.15 ng/mL (n = 12). C, Insulin tolerance test. Hep-Rq mice and WT littermates were injected with either insulin alone (0.75 U/kg ip) (−CNO) or together with CNO (10 mg/kg ip), and blood glucose levels were measured at the indicated time points. *, P < .05, as compared with the other 3 groups of mice. D, Pyruvate challenge test. Hep-Rq mice and WT littermates received a single ip injection of sodium pyruvate (2 mg/g) either alone or in combination with CNO (10 mg/kg). Blood glucose levels were measured at the indicated time points. All experiments were carried out with 8- to 10-week-old male mice. Data are given as means ± SEM (n = 6 per group). *, P < .05; **, P < .01, as compared with the other 3 groups of mice.
Figure 4.
Figure 4.
Comparison of the effects of CNO and glucagon on blood glucose levels in WT and Hep-Rq mice. Hep-Rq mice and WT littermates received a single ip injection of saline (control), glucagon (16 μg/kg), or CNO (10 mg/kg) (mice were fasted for 5 hours before injections). Blood glucose levels were determined at the indicated time points. All experiments were carried out with 8-week-old males. Data are given as means ± SEM (n = 6 per group).
Figure 5.
Figure 5.
Effect of CNO on hepatic glucose fluxes in conscious Hep-Rq mice in vivo. The time course of arterial blood glucose concentrations and the rate of glucose appearance (A) and the rates of gluconeogenesis and glycogenolysis (B) were determined as described in detail in Materials and Methods. At time 0, chronically catheterized conscious Hep-Rq mice (4-month-old females) that had been fasted for 5 hours were injected with an ip bolus of CNO (200 μg per mouse) or saline (control). Data are given as means ± SEM (n = 6 per group). *, P < 05 vs saline.
Figure 6.
Figure 6.
Effects of CNO treatment of Hep-Rq mice on liver gene expression levels. Hep-Rq mice (freely fed 5-month-old males) received 2 ip injections of CNO (10 mg/kg) or saline that were given 2 hours apart. Livers were harvested for the preparation of total RNA 6 hours after the first injection. Gene expression was studied by real-time qRT-PCR using total hepatic RNA as a template. Data were normalized relative to the expression of cyclophilin A RNA (internal control) and are presented as fold change in gene expression in CNO-treated vs saline-treated Hep-Rq mice. CNO had no significant effect on the expression of cyclophilin A. Data are given as means ± SEM (n = 4 for all genes except PEPCK [n = 8]). *, P < .05; **, P < .01 vs saline-treated Hep-Rq mice. Full gene names are given in Supplemental Table 1.
Figure 7.
Figure 7.
The ob/ob mice show a pronounced increase in V1b vasopressin receptor expression in the liver. Total hepatic RNA was prepared from livers of ob/ob and WT lean control mice (4- to 5-month-old males). The expression of GPCRs linked to Gq-type G proteins expressed in mouse liver was studied by real-time qRT-PCR using total hepatic RNA as a template. Primers specific for the following receptors were used (for primer sequences, see Supplemental Table 2): GPR91 (succinate receptor 1), AT1a angiotensin II receptor (AT1a), V1a and V1b vasopressin receptors (V1a and V1b), α1b-adrenergic receptor (α1b), PAR1 thrombin receptor (PAR1), S1P2 lysophospholipid receptor (S1P2), and M3 muscarinic receptor (M3). Data were normalized relative to the expression of 18S RNA (internal control) and are presented as fold change in gene expression in ob/ob vs WT mice. Ct values for 18S RNA expression were not significantly different between ob/ob mice and control (lean) littermates. Data are given as means ± SEM (n = 4 per group). *, P < .05; **, P < .01; ***, P < .01 vs WT.
Figure 8.
Figure 8.
A selective V1b vasopressin receptor antagonist reduces glucose excursions in ob/ob mice in a pyruvate challenge test. A, Pyruvate challenge test. The ob/ob and WT lean control mice (12-week-old males) received an ip injection of 1.5 mg/g sodium pyruvate, either alone or in combination with SSR149415 (20 mg/kg ip), a selective V1b vasopressin receptor antagonist. Blood glucose levels were measured at the indicated time points. Data are given as means ± SEM (n = 4 per group). *, P < .05; **, P < .01 vs the other 3 groups of mice. B, Glucose tolerance test. The ob/ob mice and WT lean littermates (16-week-old males) received an ip injection of glucose (2 mg/g), either alone or in combination with SSR149415 (20 mg/kg ip). Blood glucose levels were measured at the indicated time points. Data are given as means ± SEM (n = 4 per group).

Comment in

References

    1. Taylor SI. Deconstructing type 2 diabetes. Cell. 1999;97:9–12 - PubMed
    1. Postic C, Dentin R, Girard J. Role of the liver in the control of carbohydrate and lipid homeostasis. Diabetes Metab. 2004;30:398–408 - PubMed
    1. Lin HV, Accili D. Hormonal regulation of hepatic glucose production in health and disease. Cell Metab. 2011;14:9–19 - PMC - PubMed
    1. Regard JB, Sato IT, Coughlin SR. Anatomical profiling of G protein-coupled receptor expression. Cell. 2008;135:561–571 - PMC - PubMed
    1. Jiang G, Zhang BB. Glucagon and regulation of glucose metabolism. Am J Physiol Endocrinol Metab. 2003;284:E671–E678 - PubMed

Publication types

MeSH terms

Substances