. 2013 Nov;269(2):534-41.
doi: 10.1148/radiol.13130375. Epub 2013 Jul 16.

Ectopic and serum lipid levels are positively associated with bone marrow fat in obesity

Affiliations

Ectopic and serum lipid levels are positively associated with bone marrow fat in obesity

Miriam A Bredella et al. Radiology. 2013 Nov.

Abstract

Purpose: To investigate the associations between ectopic and serum lipid levels and bone marrow fat, as a marker of stem cell differentiation, in young obese men and women, with the hypothesis that ectopic and serum lipid levels would be positively associated with bone marrow fat.

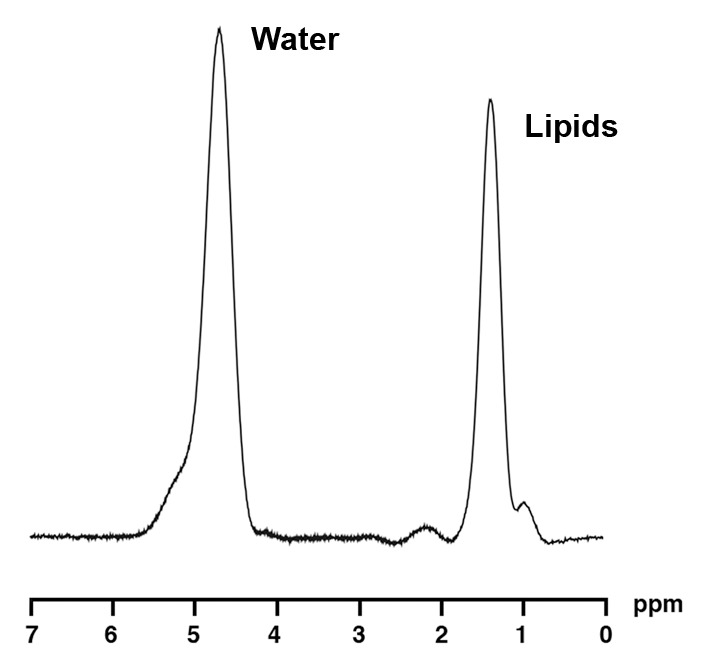
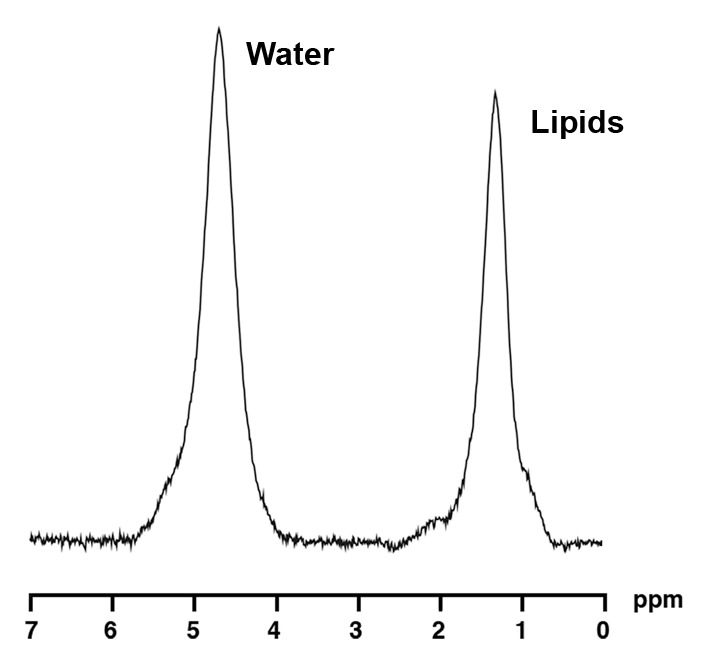
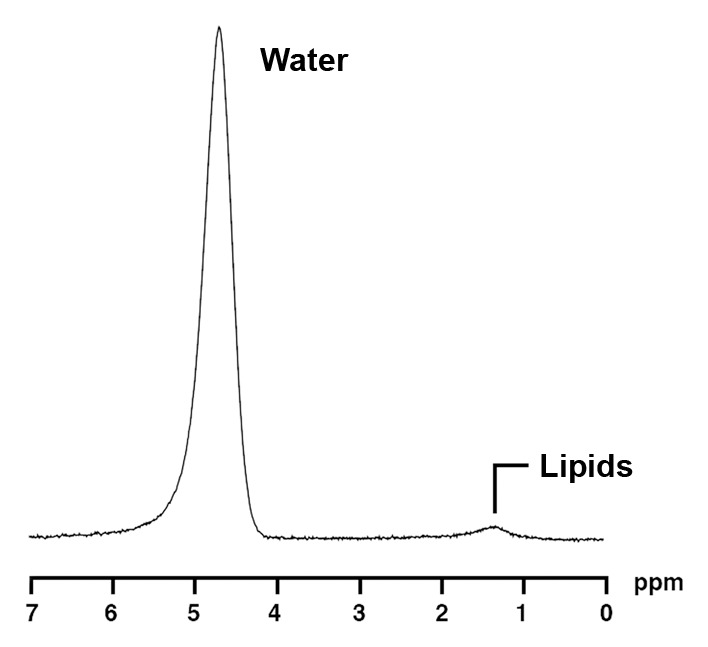
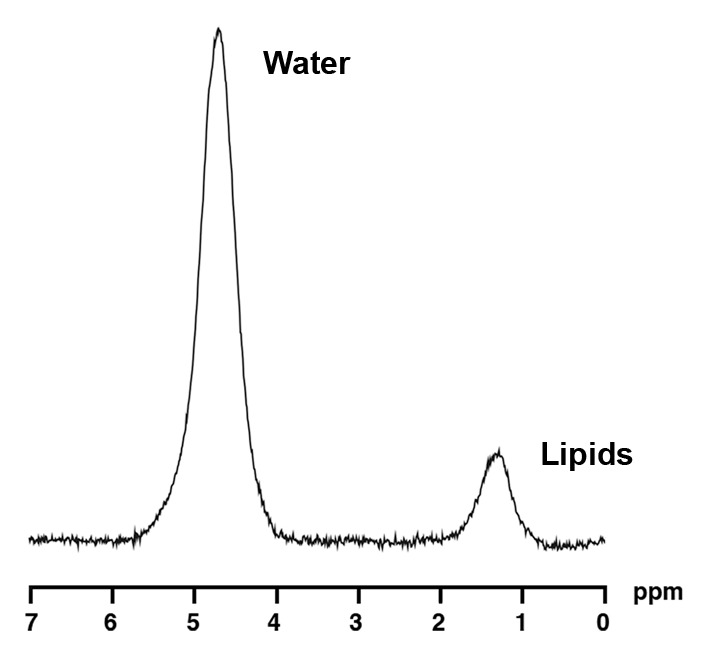
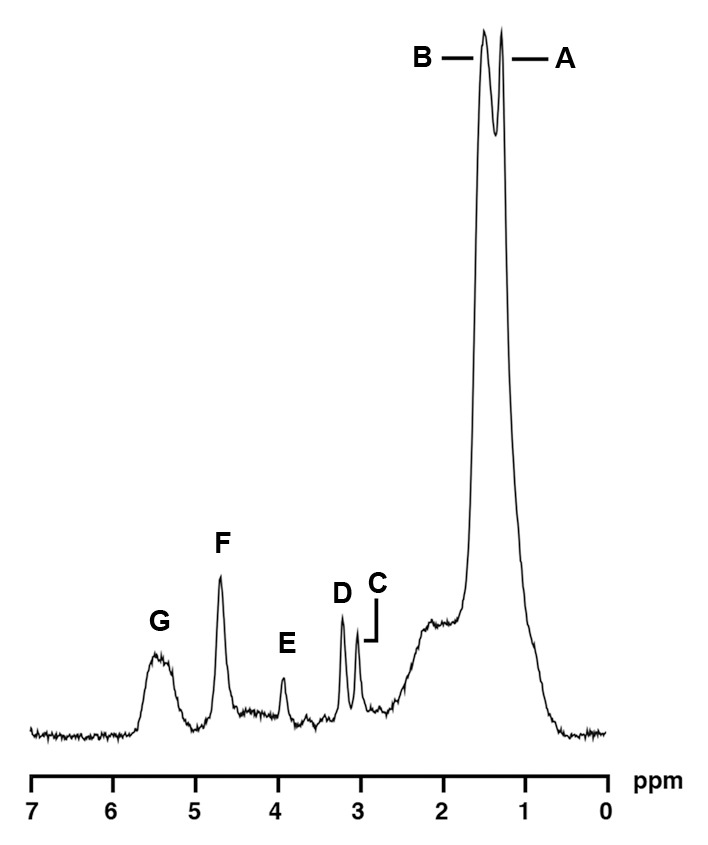
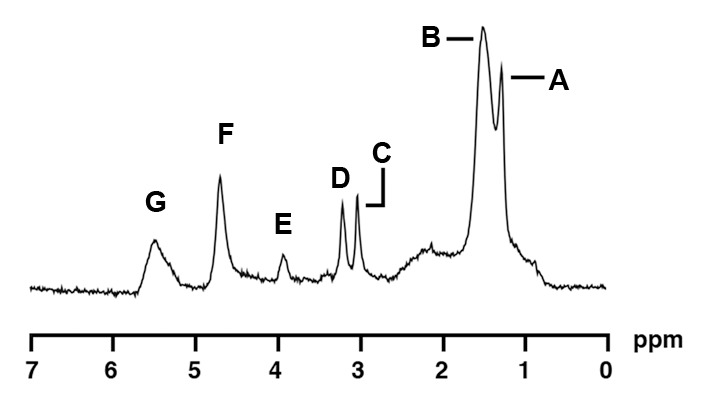
Materials and methods: The study was institutional review board approved and complied with HIPAA guidelines. Written informed consent was obtained. The study group comprised 106 healthy young men and women (mean age, 33.7 years ± 6.8 [standard deviation]; range, 19-45 years; mean body mass index (BMI), 33.1 kg/m(2) ± 7.1; range, 18.1-48.8 kg/m(2)) who underwent hydrogen 1((1)H) magnetic resonance (MR) spectroscopy by using a point-resolved spatially localized spectroscopy sequence at 3.0 T of L4 for bone marrow fat content, of soleus muscle for intramyocellular lipids (IMCL), and liver for intrahepatic lipids (IHL), serum cholesterol level, serum triglyceride level, and measures of insulin resistance (IR). Exercise status was assessed with the Paffenbarger activity questionnaire.

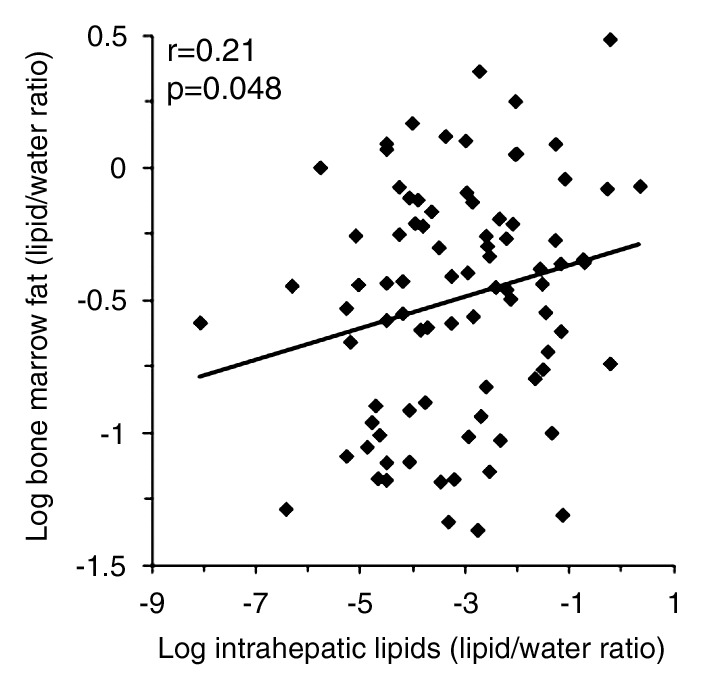
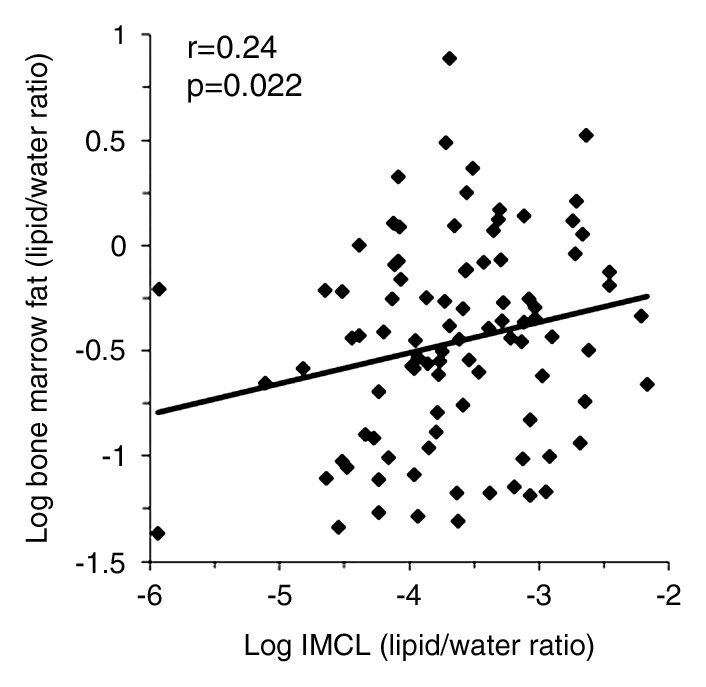
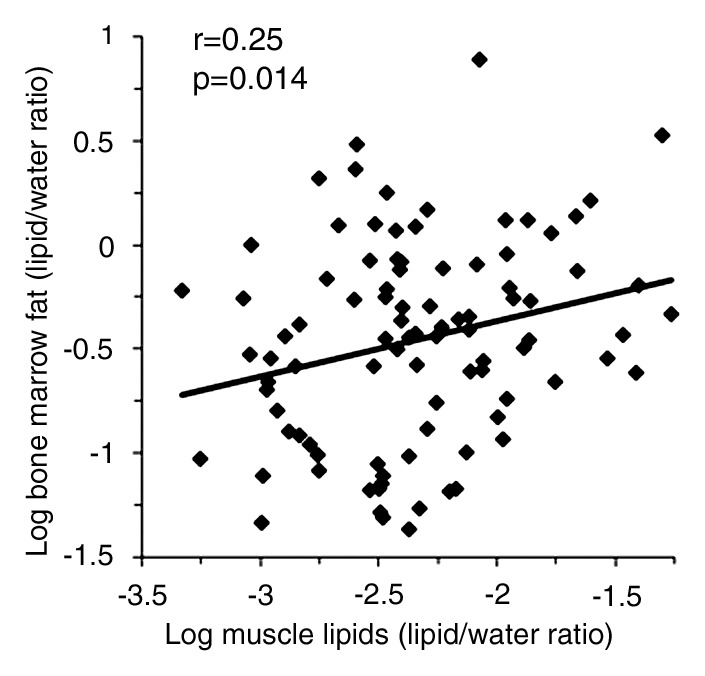
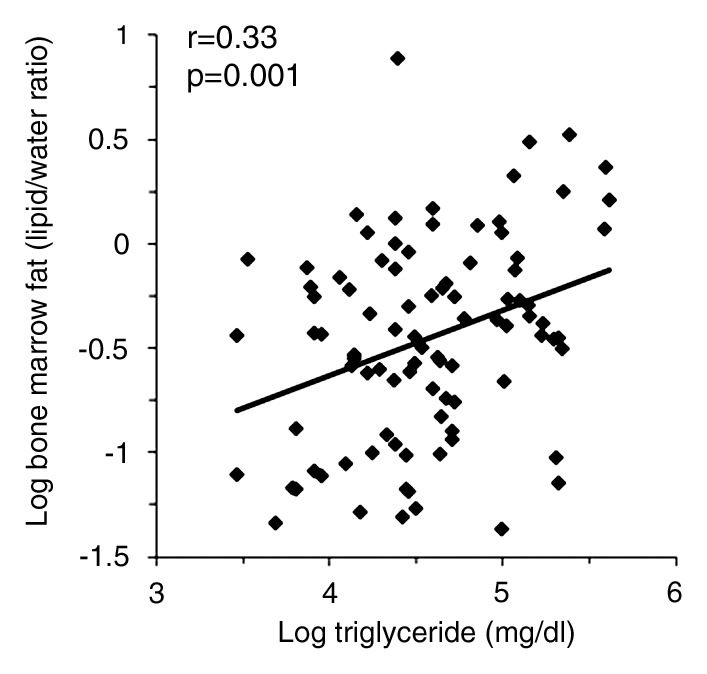
Results: There was a positive correlation between bone marrow fat and IHL (r = 0.21, P = .048), IMCL (r = 0.27, P = .02), and serum triglyceride level (r = 0.33, P = .001), independent of BMI, age, IR, and exercise status (P < .05). High-density lipoprotein cholesterol levels were inversely associated with bone marrow fat content, independent of BMI, age, IR, and exercise status (r = -0.21, P = .019).

Conclusion: Results of this study suggest that ectopic and serum lipid levels are positively associated with bone marrow fat in obese men and women.


Figures

Figure 1a:
Figure 1a:
(a–d) Nonadjusted regression analysis between bone marrow fat and ectopic and serum lipid levels. There are positive correlations between bone marrow fat and (a) IHL, (b) IMCL, (c) total muscle lipid levels, and (d) serum triglyceride levels.
Figure 1b:
Figure 1b:
(a–d) Nonadjusted regression analysis between bone marrow fat and ectopic and serum lipid levels. There are positive correlations between bone marrow fat and (a) IHL, (b) IMCL, (c) total muscle lipid levels, and (d) serum triglyceride levels.
Figure 1c:
Figure 1c:
(a–d) Nonadjusted regression analysis between bone marrow fat and ectopic and serum lipid levels. There are positive correlations between bone marrow fat and (a) IHL, (b) IMCL, (c) total muscle lipid levels, and (d) serum triglyceride levels.
Figure 1d:
Figure 1d:
(a–d) Nonadjusted regression analysis between bone marrow fat and ectopic and serum lipid levels. There are positive correlations between bone marrow fat and (a) IHL, (b) IMCL, (c) total muscle lipid levels, and (d) serum triglyceride levels.
Figure 2a:
Figure 2a:
1H MR spectroscopy of liver and bone marrow in a 35-year-old obese man (BMI, 37.4 kg/m2) with high IHL content. For purposes of visual comparison, the amplitude of unsuppressed water in Figures 2 and 3 were scaled identically. (a) 1H MR spectrum of liver shows lipid (1.3 ppm) and unsuppressed water (4.7 ppm) resonances. (b) 1H MR spectrum of bone marrow at L4 shows lipid (1.3 ppm) and unsuppressed water (4.7 ppm) resonances.
Figure 2b:
Figure 2b:
1H MR spectroscopy of liver and bone marrow in a 35-year-old obese man (BMI, 37.4 kg/m2) with high IHL content. For purposes of visual comparison, the amplitude of unsuppressed water in Figures 2 and 3 were scaled identically. (a) 1H MR spectrum of liver shows lipid (1.3 ppm) and unsuppressed water (4.7 ppm) resonances. (b) 1H MR spectrum of bone marrow at L4 shows lipid (1.3 ppm) and unsuppressed water (4.7 ppm) resonances.
Figure 3a:
Figure 3a:
1H MR spectroscopy of liver and bone marrow in a 37-year-old obese man with similar BMI as subject in Figure 2 (BMI, 37.2 kg/m2) but with lower IHL content. Despite similar age and BMI, this obese man has lower bone marrow fat content (0.3 vs 0.93 lipid-water ratio). (a) 1H MR spectrum of liver shows lipid (1.3 ppm) and unsuppressed water (4.7 ppm) resonances. (b) 1H MR spectrum of bone marrow at L4 shows lipid (1.3 ppm) and unsuppressed water (4.7 ppm) resonances.
Figure 3b:
Figure 3b:
1H MR spectroscopy of liver and bone marrow in a 37-year-old obese man with similar BMI as subject in Figure 2 (BMI, 37.2 kg/m2) but with lower IHL content. Despite similar age and BMI, this obese man has lower bone marrow fat content (0.3 vs 0.93 lipid-water ratio). (a) 1H MR spectrum of liver shows lipid (1.3 ppm) and unsuppressed water (4.7 ppm) resonances. (b) 1H MR spectrum of bone marrow at L4 shows lipid (1.3 ppm) and unsuppressed water (4.7 ppm) resonances.
Figure 4:
Figure 4:
1H MR spectroscopy of soleus muscle in a 35-year-old obese woman (BMI, 41.0 kg/m2) with high IMCL and high bone marrow fat content. For purposes of visual comparison, the amplitude of total creatine peaks in Figures 4 and 5 were scaled identically. 1H MR spectrum of soleus muscle shows the following metabolite peaks: A, IMCL methylene protons (−CH2) at 1.3 ppm; B, extramyocellular lipid methylene protons (−CH2) at 1.5 ppm; C, total creatine (−CH3) resonance at 3.0 ppm; D, trimethylamines peak at 3.2 ppm; E, creatine (−CH2) resonance at 3.96 ppm; F, residual water peak at 4.7 ppm; and G, olefinic proton (HC=CH) resonances at 5.3–5.5 ppm.
Figure 5:
Figure 5:
1H MR spectroscopy of soleus muscle in a 34-year-old obese woman (BMI, 38.0 kg/m2) with low IMCL content. Despite similar age and BMI, this obese woman had lower bone marrow fat content (0.33 vs 1.06 lipid-water ratio). 1H MR spectrum of soleus muscle shows the following metabolite peaks: A, IMCL methylene protons (−CH2) at 1.3 ppm; B, extramyocellular lipid methylene protons (−CH2) at 1.5 ppm; C, total creatine (−CH3) resonance at 3.0 ppm; D, trimethylamines peak at 3.2 ppm; E, creatine (−CH2) resonance at 3.96 ppm; F, residual water peak at 4.7 ppm; and G, olefinic proton (HC=CH) resonances at 5.3–5.5 ppm.

References

    1. Goulding A, Jones IE, Taylor RW, Williams SM, Manning PJ. Bone mineral density and body composition in boys with distal forearm fractures: a dual-energy x-ray absorptiometry study. J Pediatr 2001;139(4):509–515. - PubMed
    1. Nielson CM, Marshall LM, Adams AL, et al. BMI and fracture risk in older men: the osteoporotic fractures in men study (MrOS). J Bone Miner Res 2011;26(3):496–502. - PMC - PubMed
    1. Bredella MA, Lin E, Gerweck AV, et al. Determinants of bone microarchitecture and mechanical properties in obese men. J Clin Endocrinol Metab 2012;97(11):4115–4122. - PMC - PubMed
    1. Bredella MA, Torriani M, Ghomi RH, et al. Determinants of bone mineral density in obese premenopausal women. Bone 2011;48(4):748–754. - PMC - PubMed
    1. Gilsanz V, Chalfant J, Mo AO, Lee DC, Dorey FJ, Mittelman SD. Reciprocal relations of subcutaneous and visceral fat to bone structure and strength. J Clin Endocrinol Metab 2009;94(9):3387–3393. - PMC - PubMed