. 2013 Jul 16;6(284):ra58.
doi: 10.1126/scisignal.2003994.

Receptor tyrosine kinases fall into distinct classes based on their inferred signaling networks

Affiliations

Receptor tyrosine kinases fall into distinct classes based on their inferred signaling networks

Joel P Wagner et al. Sci Signal. .

Abstract

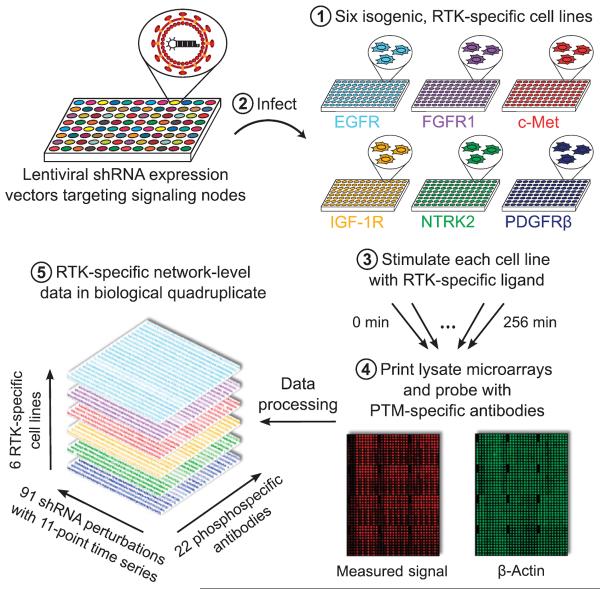
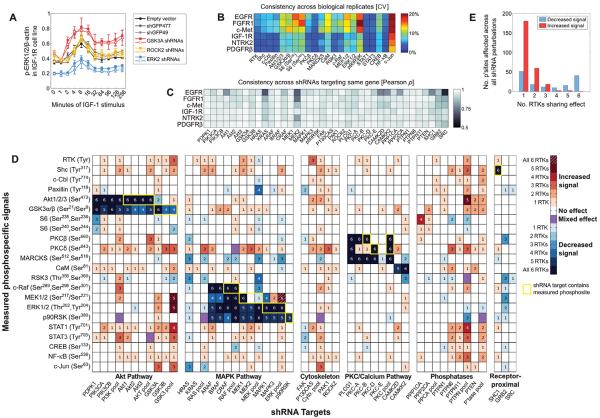
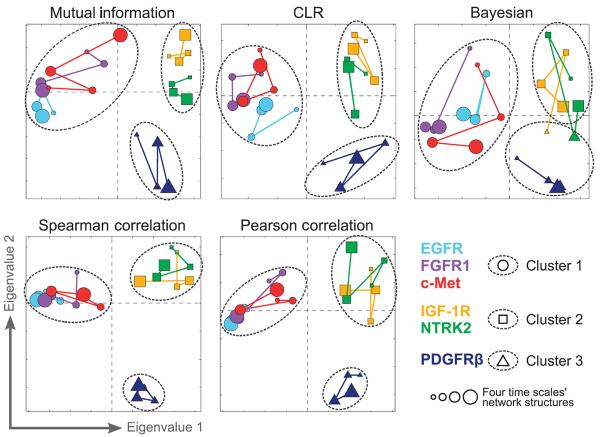
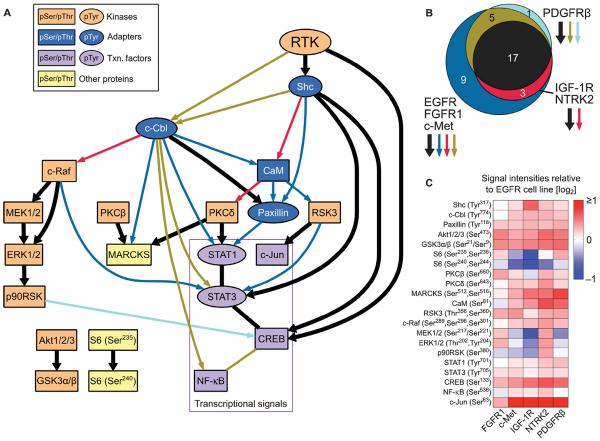
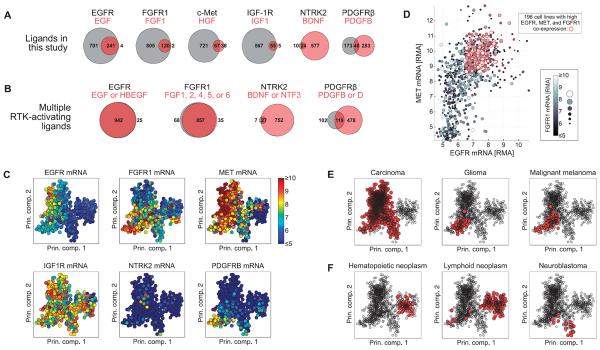
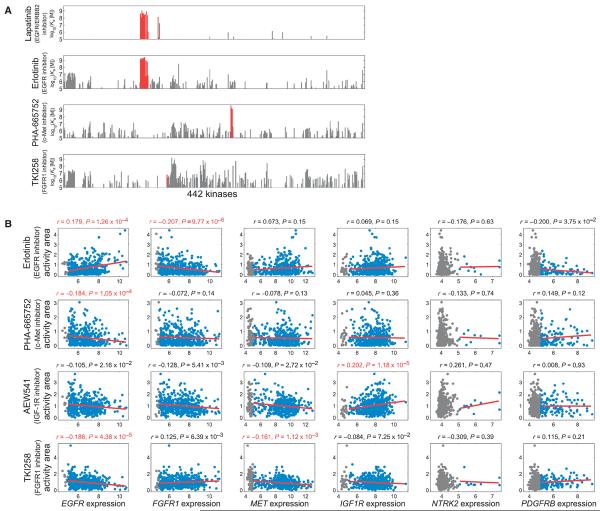
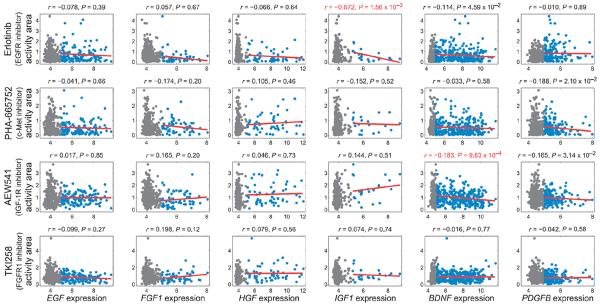
Although many anticancer drugs that target receptor tyrosine kinases (RTKs) provide clinical benefit, their long-term use is limited by resistance that is often attributed to increased abundance or activation of another RTK that compensates for the inhibited receptor. To uncover common and unique features in the signaling networks of RTKs, we measured time-dependent signaling in six isogenic cell lines, each expressing a different RTK as downstream proteins were systematically perturbed by RNA interference. Network models inferred from the data revealed a conserved set of signaling pathways and RTK-specific features that grouped the RTKs into three distinct classes: (i) an EGFR/FGFR1/c-Met class constituting epidermal growth factor receptor, fibroblast growth factor receptor 1, and the hepatocyte growth factor receptor c-Met; (ii) an IGF-1R/NTRK2 class constituting insulin-like growth factor 1 receptor and neurotrophic tyrosine receptor kinase 2; and (iii) a PDGFRβ class constituting platelet-derived growth factor receptor β. Analysis of cancer cell line data showed that many RTKs of the same class were coexpressed and that increased abundance of an RTK or its cognate ligand frequently correlated with resistance to a drug targeting another RTK of the same class. In contrast, abundance of an RTK or ligand of one class generally did not affect sensitivity to a drug targeting an RTK of a different class. Thus, classifying RTKs by their inferred networks and then therapeutically targeting multiple receptors within a class may delay or prevent the onset of resistance.


Figures

Fig. 1
Fig. 1. Schematic of perturbation-based profiling for analysis of RTK-specific signaling networks
Six isogenic cell lines expressing EGFR, FGFR1, c-Met, IGF-1R, NTRK2, or PDGFRβ were treated with lentiviral shRNA expression vectors to modulate the abundance of 38 downstream signaling proteins. Upon stimulation with RTK-specific ligands, time-dependent signaling events were monitored by probing for changes in the phosphorylation [post-translational modification (PTM)] of specific sites in downstream proteins using high-throughput lysate microarrays. The resulting compendium of signaling measurements, constituting more than half a million individual data points, served as a starting point for network inference.
Fig. 2
Fig. 2. Perturbations reveal specificity in RTK-induced signal transduction
(A) Time courses showing examples of shRNA perturbations that affect the phosphorylation of ERK1/2 in the IGF-1R cell line. Values shown are means ± SD of four biological replicates at each time point. Solid and empty squares of the same color represent data from two different shRNAs. (B) The CV across four biological replicates was calculated at each time point under each shRNA perturbation for each of the indicated phosphorylated proteins or sites (along the bottom). The first column, RTK, indicates the phosphorylation of the respective receptor (along the side). The median of the resultant CV values is shown. (C) Pearson correlation between measured signals resulting from two shRNAs targeting the same gene, when considering all signals and time points together. Values approaching 1 are highly consistent. (D) Conservative summary of network-wide shRNA effects, showing only significant effects (against 1% FDR) that were observed consistently with both hairpin clones. The phosphorylation of sites in network proteins (rows) after knocking down downstream RTK target proteins (columns) was categorized as increased (red shades) or decreased (blue shades) relative to shRNA controls. Yellow outlines denote conditions where a phosphosite was measured on a protein that was targeted by a shRNA, such as Akt1-Ser473 by Akt1 shRNA. (E) Number of RTK-specific cell lines in which the phosphorylation of target sites is affected similarly by shRNA-mediated knockdown of network proteins.
Fig. 3
Fig. 3. Clustering RTK-specific network models reveals three RTK classes
Connectivities of RTK signaling networks were derived from large-scale signaling data using five different network inference algorithms. Relationships between RTK-specific networks were visualized in two dimensions using MDS. Marker color denotes receptor cell line. Marker size denotes the four time scales from basal (0 min; smallest markers) to late (32 to 256 min; largest markers). Marker shape and dashed outlines represent k-means clustering assignments.
Fig. 4
Fig. 4. A consensus model for the six RTKs reveals a core signaling backbone and RTK class-specific interactions
(A) RTK backbone edges (relationships) are shown in thick black lines, whereas class-specific relationships are colored and correspond to (B). Nodes are colored according to their approximate biological function, and tyrosine- and serine/threonine-containing phosphorylation epitopes are shown as ovals and boxes, respectively (noted in insert; Txn, transcription). (B) Venn diagram showing shared and class-specific edges across the three RTK classes. All IGF-1R/NTRK2 edges and all but one of the PDGFRβ edges are present in the EGFR/FGFR1/c-Met network. (C) Median signal values (across all time points, shRNA conditions, and biological replicates) for each phosphosite in each cell line relative to the EGFR cell line.
Fig. 5
Fig. 5. RTK and ligand expression in CCLE cell lines
(A) Number of cell lines expressing a given receptor but no ligand (value displayed inside or to left of gray circle), a given ligand but no receptor (value displayed inside or to right of light red circle), or coexpressing receptor and ligand (value displayed inside dark red overlapping region) across 967 cell lines in the CCLE. (B) Including additional cognate ligands increases the number of cell lines in the CCLE that coexpress receptor and at least one ligand. (C) Gene expression values of the six RTKs displayed in principal component (Prin. comp.) space. Each circle represents a cell line, and the color represents the abundance of the indicated mRNA. (D) mRNA abundance expressed as RMA for EGFR (x axis), MET (y axis), and FGFR1 (gray scale) plotted against one another. Red circles indicate cell lines with greater than median expression of each of the three RTKs. (E and F) Tumor histologies enriched (E) or depleted (F) for coexpression of EGFR, FGFR1, and MET. Red markers indicate cell lines derived from the indicated tumor histology type. Significance of enrichment or depletion by hypergeometric test: P = 8.7 × 10⁻²⁶, P = 3.0 × 10⁻⁶, P = 1.9 × 10⁻³ for carcinoma, glioma, and melanoma, respectively (E); P = 2.0 × 10⁻³⁰, P = 1.7 × 10⁻²⁴, and P = 7.8 × 10⁻³ for hematopoietic neoplasm, lymphoid neoplasm, and neuroblastoma, respectively (F). The PCA results plotted in (C), (E), and (F) represent the first two components of the PCA coefficients, or loadings.
Fig. 6
Fig. 6. RTK expression correlates with decreased sensitivity to same-class RTK-directed drugs
(A) Affinity and specificity of kinase inhibitors lapatinib, erlotinib, PHA-665752, and TKI258 for 442 kinases [data from (28)]. On-target effects are shown in red. (B) Correlating RTK gene expression with responses to EGFR, FGFR1, c-Met, and IGF-1R inhibitors across hun dreds of cancer cell lines. Cell lines with RMA expression values >5 or <5 are shown in blue or gray, respectively. Red lines indicate linear fits to the data. Values above subplots are Spearman correlation coefficients and P values, shown in red for genes that significantly correlated (1% FDR) with drug response.
Fig. 7
Fig. 7. Relationships between ligand gene expression and response to RTK-directed drugs
Correlations between ligand gene expression and responses to EGFR, FGFR1, c-Met, or IGF-1R inhibitors were determined across hundreds of cancer cell lines. Cell lines with RMA expression values >5 or <5 are shown in blue or gray, respectively. Red lines indicate linear fits to the data. Values above subplots are Spearman correlation coefficients and P values, shown in red for genes that significantly correlated (1% FDR) with drug response.

References

    1. Lemmon MA, Schlessinger J. Cell signaling by receptor tyrosine kinases. Cell. 2010;141:1117–1134. - PMC - PubMed
    1. Hubbard SR, Till JH. Protein tyrosine kinase structure and function. Annu. Rev. Biochem. 2000;69:373–398. - PubMed
    1. Stommel JM, Kimmelman AC, Ying H, Nabioullin R, Ponugoti AH, Wiedemeyer R, Stegh AH, Bradner JE, Ligon KL, Brennan C, Chin L, DePinho RA. Coactivation of receptor tyrosine kinases affects the response of tumor cells to targeted therapies. Science. 2007;318:287–290. - PubMed
    1. Turke AB, Zejnullahu K, Wu YL, Song Y, Dias-Santagata D, Lifshits E, Toschi L, Rogers A, Mok T, Sequist L, Lindeman NI, Murphy C, Akhavanfard S, Yeap BY, Xiao Y, Capelletti M, Iafrate AJ, Lee C, Christensen JG, Engelman JA, Jänne PA. Preexistence and clonal selection of MET amplification in EGFR mutant NSCLC. Cancer Cell. 2010;17:77–88. - PMC - PubMed
    1. Qi J, McTigue MA, Rogers A, Lifshits E, Christensen JG, Jänne PA, Engelman JA. Multiple mutations and bypass mechanisms can contribute to development of acquired resistance to MET inhibitors. Cancer Res. 2011;71:1081–1091. - PMC - PubMed

Publication types

MeSH terms

Substances

LinkOut - more resources