

Prostate Health Index (Phi) and Prostate Cancer Antigen 3 (PCA3) significantly improve prostate cancer detection at initial biopsy in a total PSA range of 2-10 ng/ml
- PMID: 23861782
- PMCID: PMC3701535
- DOI: 10.1371/journal.pone.0067687
Prostate Health Index (Phi) and Prostate Cancer Antigen 3 (PCA3) significantly improve prostate cancer detection at initial biopsy in a total PSA range of 2-10 ng/ml
Abstract
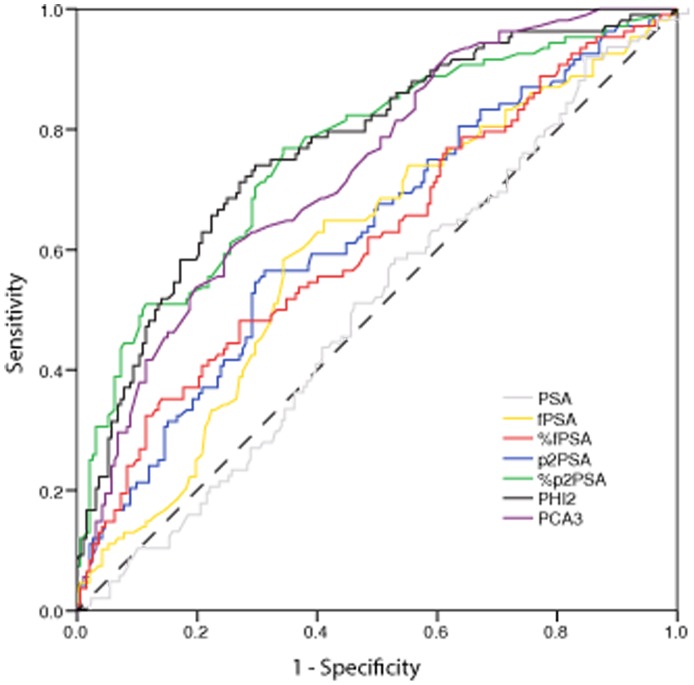
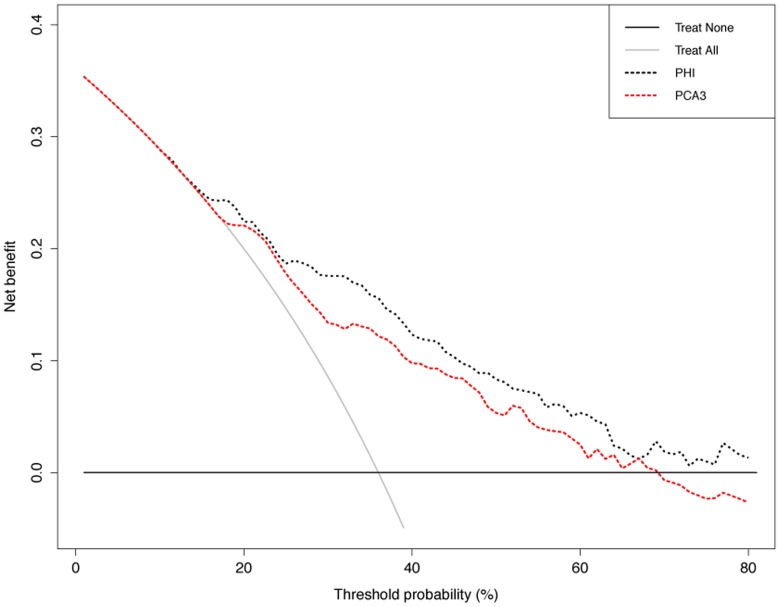
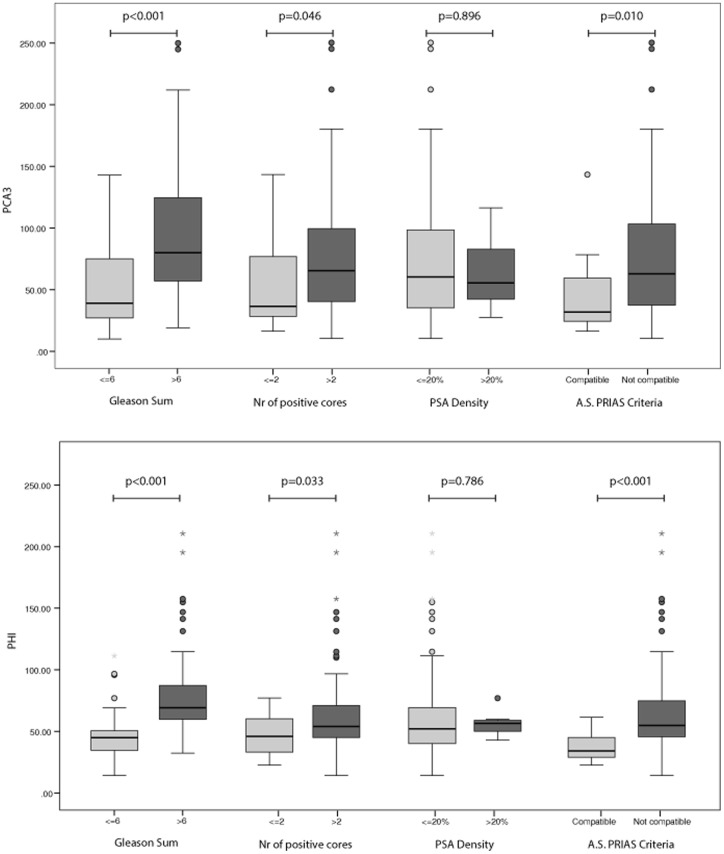
Many efforts to reduce prostate specific antigen (PSA) overdiagnosis and overtreatment have been made. To this aim, Prostate Health Index (Phi) and Prostate Cancer Antigen 3 (PCA3) have been proposed as new more specific biomarkers. We evaluated the ability of phi and PCA3 to identify prostate cancer (PCa) at initial prostate biopsy in men with total PSA range of 2-10 ng/ml. The performance of phi and PCA3 were evaluated in 300 patients undergoing first prostate biopsy. ROC curve analyses tested the accuracy (AUC) of phi and PCA3 in predicting PCa. Decision curve analyses (DCA) were used to compare the clinical benefit of the two biomarkers. We found that the AUC value of phi (0.77) was comparable to those of %p2PSA (0.76) and PCA3 (0.73) with no significant differences in pairwise comparison (%p2PSA vs phi p = 0.673, %p2PSA vs. PCA3 p = 0.417 and phi vs. PCA3 p = 0.247). These three biomarkers significantly outperformed fPSA (AUC = 0.60), % fPSA (AUC = 0.62) and p2PSA (AUC = 0.63). At DCA, phi and PCA3 exhibited a very close net benefit profile until the threshold probability of 25%, then phi index showed higher net benefit than PCA3. Multivariable analysis showed that the addition of phi and PCA3 to the base multivariable model (age, PSA, %fPSA, DRE, prostate volume) increased predictive accuracy, whereas no model improved single biomarker performance. Finally we showed that subjects with active surveillance (AS) compatible cancer had significantly lower phi and PCA3 values (p<0.001 and p = 0.01, respectively). In conclusion, both phi and PCA3 comparably increase the accuracy in predicting the presence of PCa in total PSA range 2-10 ng/ml at initial biopsy, outperforming currently used %fPSA.
Conflict of interest statement
Figures
References
-
- Loeb S, Gonzalez CM, Roehl KA, Han M, Antenor JA, et al. (2006) Pathological characteristics of prostate cancer detected through prostate specific antigen based screening. J Urol 175: 902–906. - PubMed
-
- Auprich M, Bjartell A, Chun FK, de la Taille A, Freedland SJ, et al. (2011) Contemporary role of prostate cancer antigen 3 in the management of prostate cancer. Eur Urol 60: 1045–1054. - PubMed
-
- Auprich M, Haese A, Walz J, Pummer K, de la Taille A, et al. (2010) External validation of urinary PCA3-based nomograms to individually predict prostate biopsy outcome. Eur Urol 58: 727–732. - PubMed
-
- Catalona WJ, Partin AW, Sanda MG, Wei JT, Klee GG, et al. (2011) A multicenter study of [−2]pro-prostate specific antigen combined with prostate specific antigen and free prostate specific antigen for prostate cancer detection in the 2.0 to 10.0 ng/ml prostate specific antigen range. J Urol 185: 1650–1655. - PMC - PubMed
-
- Ferro M, Bruzzese D, Perdona S, Mazzarella C, Marino A, et al. (2012) Predicting prostate biopsy outcome: Prostate health index (phi) and prostate cancer antigen 3 (PCA3) are useful biomarkers. Clin Chim Acta 413: 1274–1278. - PubMed
Publication types
MeSH terms
Substances
LinkOut - more resources
Full Text Sources
Other Literature Sources
Medical
Research Materials
Miscellaneous
