

Why has the number of scientific retractions increased?
- PMID: 23861902
- PMCID: PMC3704583
- DOI: 10.1371/journal.pone.0068397
Why has the number of scientific retractions increased?
Erratum in
- PLoS One. 2013;8(7). doi:10.1371/annotation/0d28db18-e117-4804-b1bc-e2da285103ac
Abstract
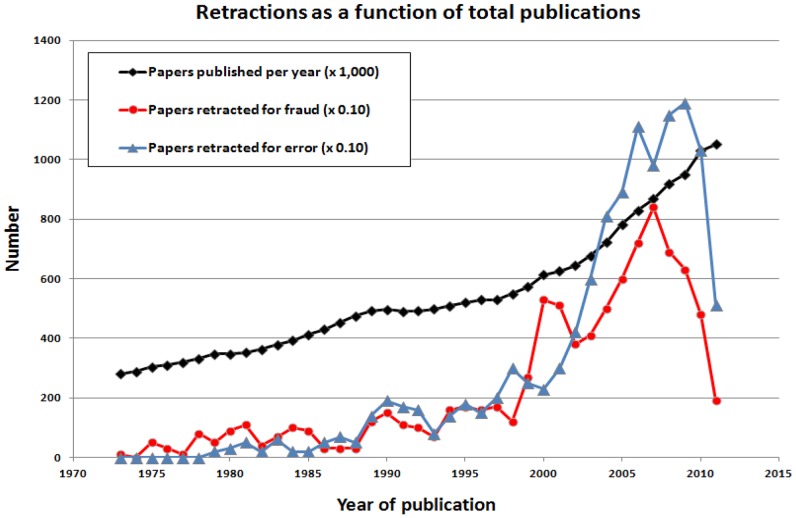
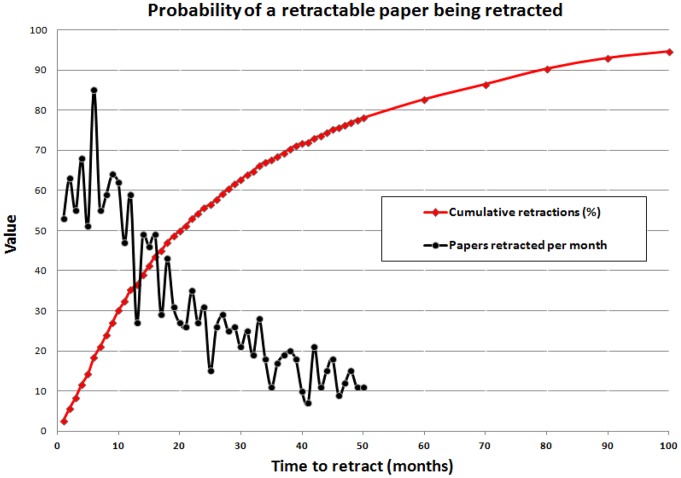
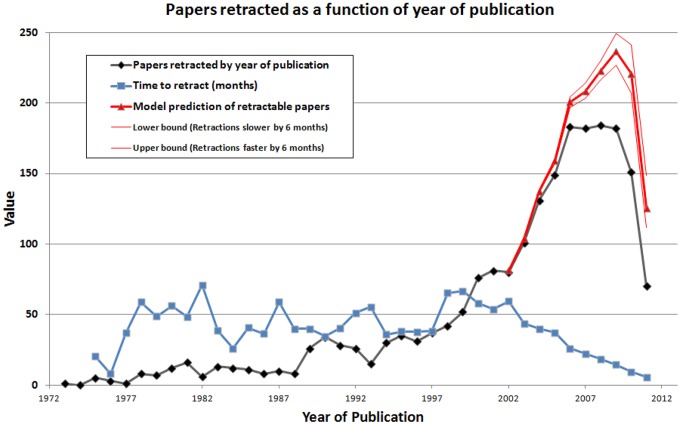
Background: The number of retracted scientific publications has risen sharply, but it is unclear whether this reflects an increase in publication of flawed articles or an increase in the rate at which flawed articles are withdrawn.
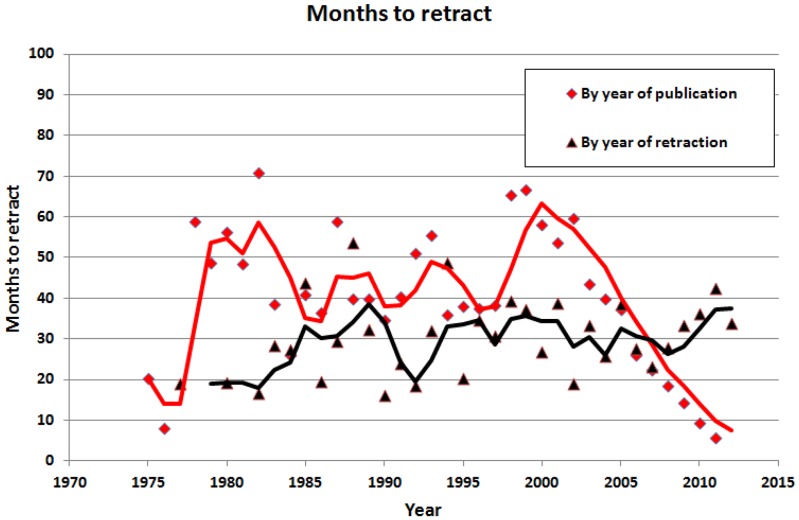
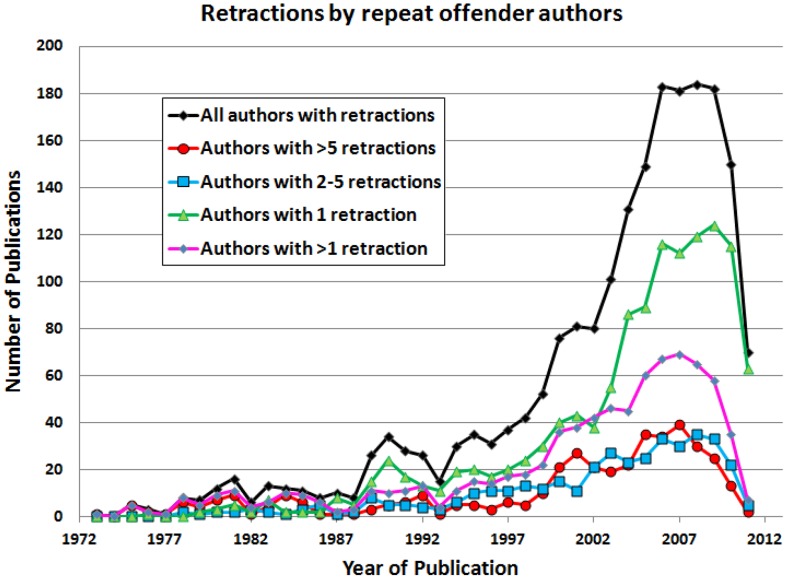
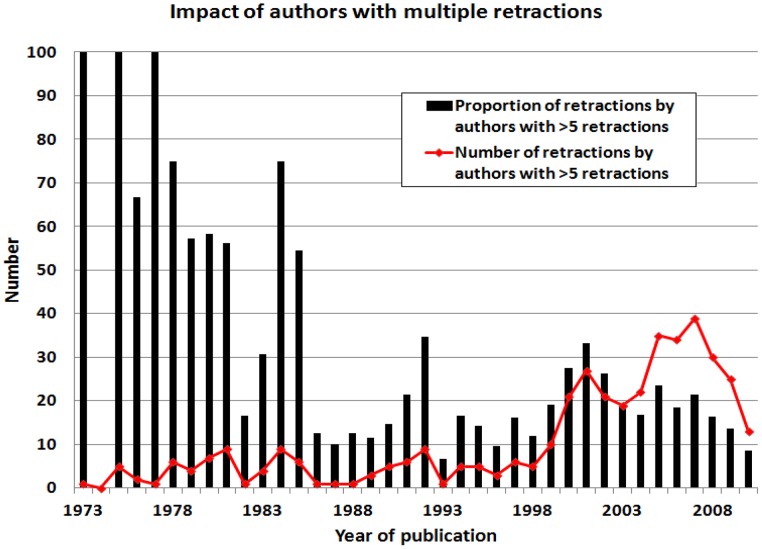
Methods and findings: We examined the interval between publication and retraction for 2,047 retracted articles indexed in PubMed. Time-to-retraction (from publication of article to publication of retraction) averaged 32.91 months. Among 714 retracted articles published in or before 2002, retraction required 49.82 months; among 1,333 retracted articles published after 2002, retraction required 23.82 months (p<0.0001). This suggests that journals are retracting papers more quickly than in the past, although recent articles requiring retraction may not have been recognized yet. To test the hypothesis that time-to-retraction is shorter for articles that receive careful scrutiny, time-to-retraction was correlated with journal impact factor (IF). Time-to-retraction was significantly shorter for high-IF journals, but only ∼1% of the variance in time-to-retraction was explained by increased scrutiny. The first article retracted for plagiarism was published in 1979 and the first for duplicate publication in 1990, showing that articles are now retracted for reasons not cited in the past. The proportional impact of authors with multiple retractions was greater in 1972-1992 than in the current era (p<0.001). From 1972-1992, 46.0% of retracted papers were written by authors with a single retraction; from 1993 to 2012, 63.1% of retracted papers were written by single-retraction authors (p<0.001).
Conclusions: The increase in retracted articles appears to reflect changes in the behavior of both authors and institutions. Lower barriers to publication of flawed articles are seen in the increase in number and proportion of retractions by authors with a single retraction. Lower barriers to retraction are apparent in an increase in retraction for "new" offenses such as plagiarism and a decrease in the time-to-retraction of flawed work.
Conflict of interest statement
Figures
References
-
- Weissmann G (2006) Science fraud: from patchwork mouse to patchwork data. FASEB J 20: 587–590. - PubMed
-
- Korpela KM (2010) How long does it take for scientific literature to purge itself of fraudulent material?: the Breuning case revisited. Curr Med Res Opin 26: 843–847. - PubMed
-
- Steen RG (2011) Retractions in the medical literature: Who is responsible for scientific integrity? AMWA J 26: 2–7.
-
- Steen RG (2011) Retractions in the scientific literature: Do authors deliberately commit research fraud? J Med Ethics 37: 113–117. - PubMed
MeSH terms
LinkOut - more resources
Full Text Sources
Other Literature Sources
Miscellaneous
