. 2013 Aug;140(16):3323-34.
doi: 10.1242/dev.096537. Epub 2013 Jul 17.

Tumor suppressor Nf2 limits expansion of the neural progenitor pool by inhibiting Yap/Taz transcriptional coactivators

Affiliations

Tumor suppressor Nf2 limits expansion of the neural progenitor pool by inhibiting Yap/Taz transcriptional coactivators

Alfonso Lavado et al. Development. 2013 Aug.

Abstract

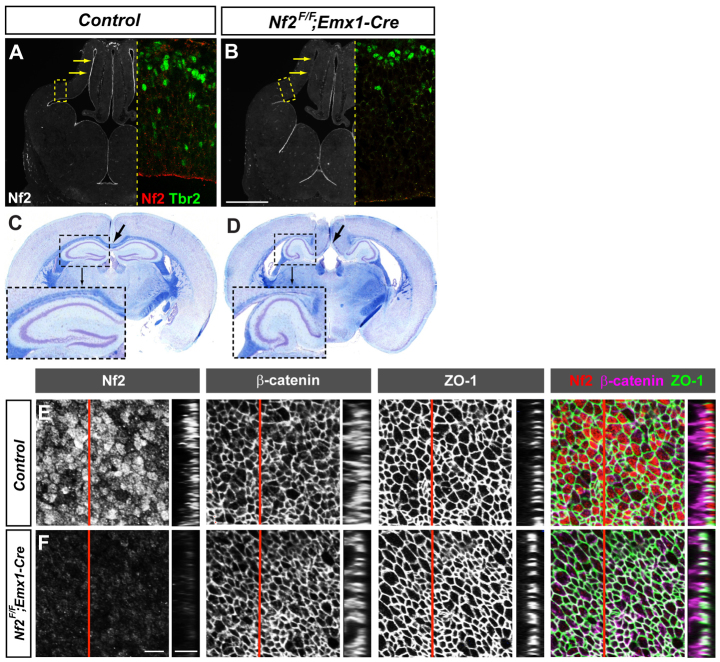
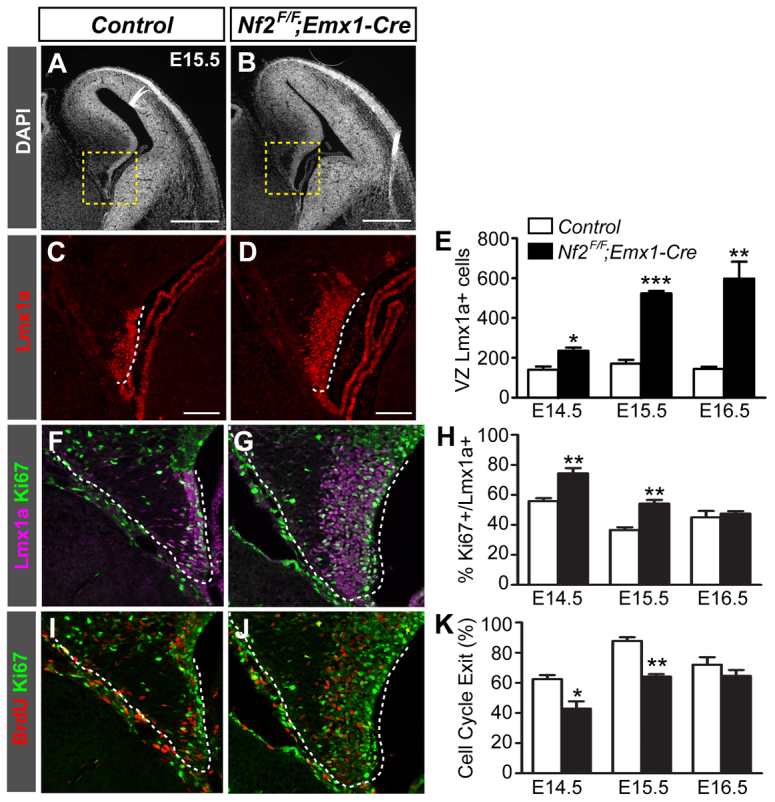
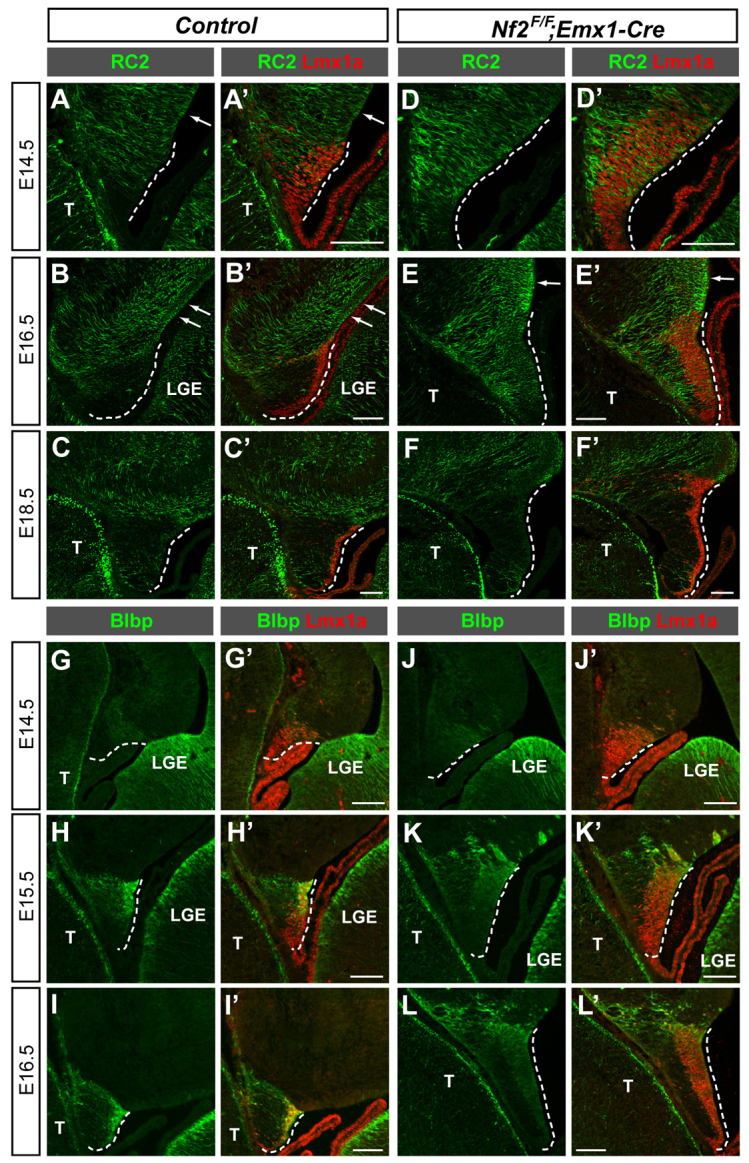
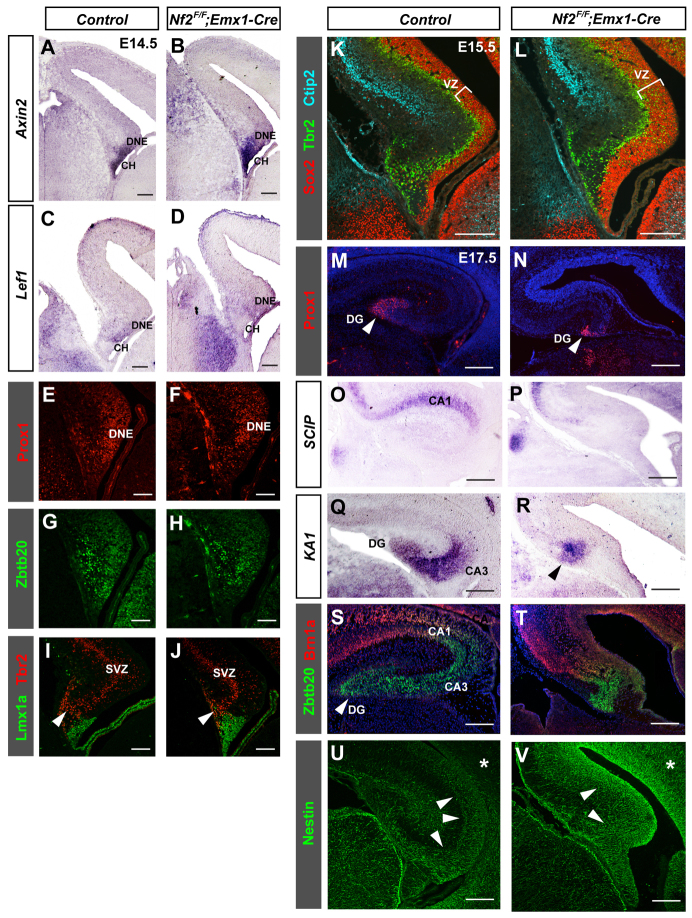
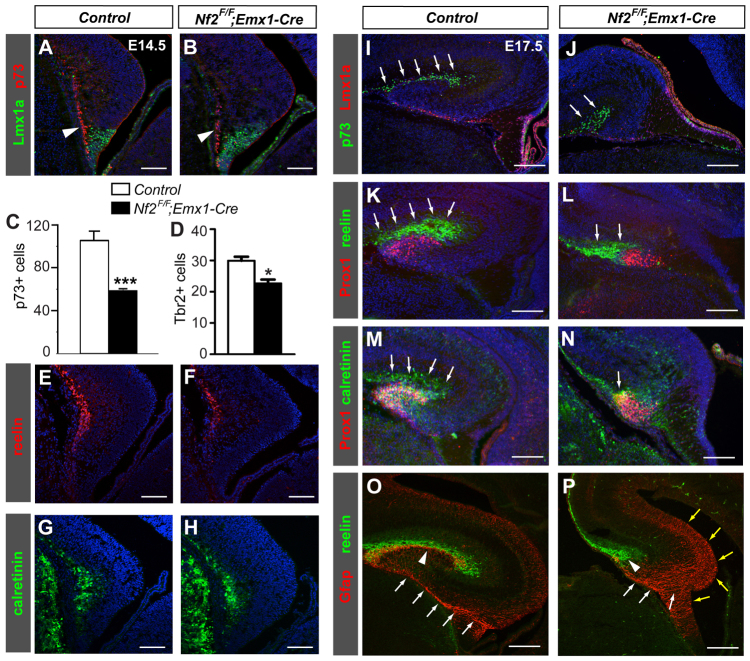
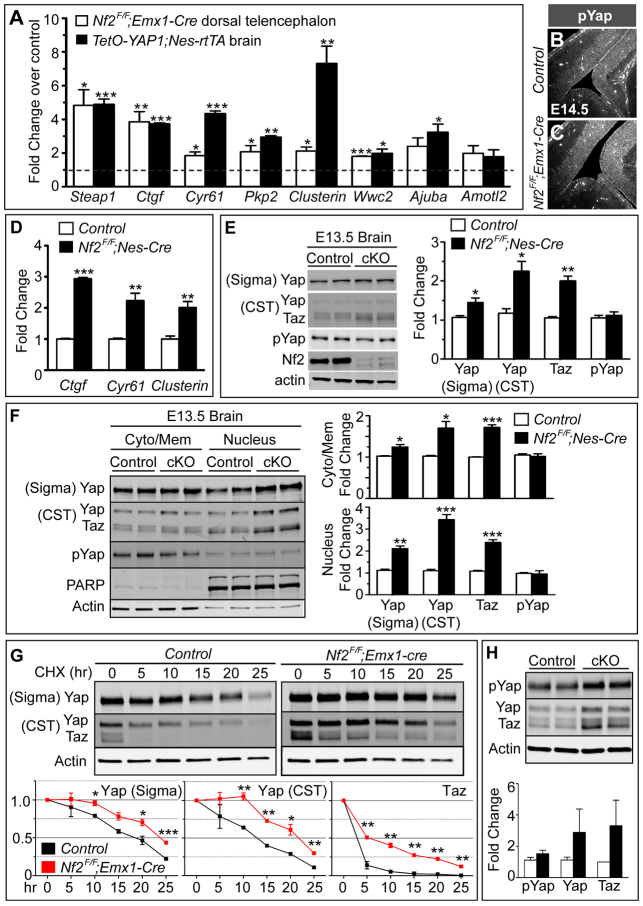
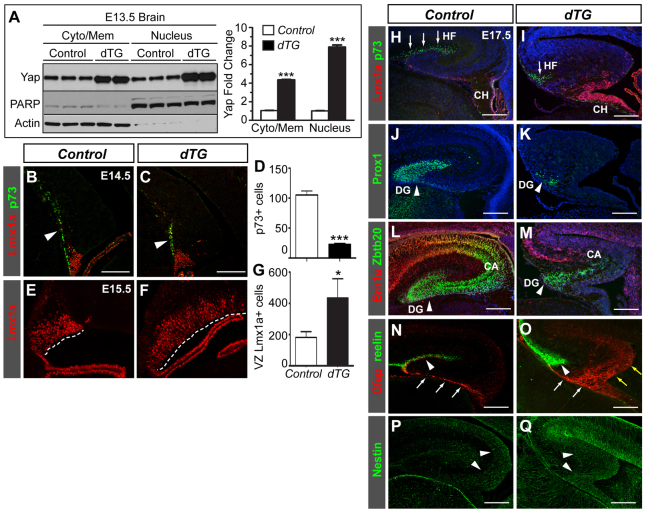
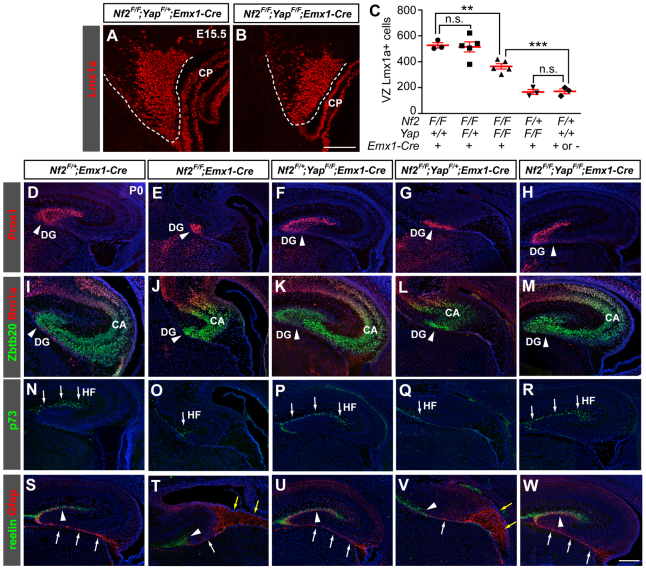
Brain development requires a precise balance between expansion of the neural progenitor pool and the production of postmitotic neurons and glia. Disruption of this equilibrium results in a myriad of structural abnormalities and disorders of the nervous system. The molecular mechanism that restricts neural progenitor expansion is poorly understood. Here we show that the tumor suppressor neurofibromatosis 2 (Nf2; merlin) limits the expansion of neural progenitor cells (NPCs) in the mammalian dorsal telencephalon. Nf2 is localized at the apical region of NPCs. In the absence of Nf2, NPCs of the cortical hem, hippocampal primordium and neocortical primordium overexpand, while production of Cajal-Retzius cells and hippocampal neurons decreases, resulting in severe malformation of the hippocampus in adult mice. We further show that Nf2 functions by inhibiting the Yap/Taz transcriptional coactivators, probably through a mechanism that is distinct from the canonical Hippo pathway. Overexpressing human YAP in NPCs causes a hippocampal malformation phenotype that closely resembles that of Nf2 mutants and, importantly, deleting Yap in the Nf2 mutant background largely restores hippocampal development. Our studies uncover Nf2 as an important inhibitor of neural progenitor expansion and establish Yap/Taz as key downstream effectors of Nf2 during brain development.

Keywords: Archicortex; Mouse; Neurogenesis; Radial glial cells; Wwtr1; Yap1.


Figures

Fig. 1.
Fig. 1.
Loss of Nf2 results in dysgenesis of the corpus callosum and malformation of the hippocampus. (A,B) Immunostaining showing Nf2 concentrated at the apical/ventricular surface of E12.5 control brains (arrows, A). Nf2 immunoreactivity is specifically eliminated in the dorsal telencephalon of Nf2F/F;Emx1-Cre embryos (arrows, B). Magnified views of the boxed areas are shown to the right. (C,D) Luxol Blue staining for myelinated axons (blue) and Cresyl Violet for neuronal cell bodies (purple) show dysgenesis of the corpus callosum (arrows) and malformation of the hippocampus (boxed) in 2-month-old Nf2F/F;Emx1-Cre mice (D) as compared with control (C). (E,F) Whole-mount immunostaining of E12.5 neocortex, viewed from the ventricular surface (single plane views and corresponding 5 μm z-stack views at the position of the red line), showing Nf2 enrichment at NPC apical regions in the control (E). Nf2 immunoreactivity is greatly reduced in Nf2F/F;Emx1-Cre neocortices without affecting β-catenin or ZO-1 localization (F). Scale bars: 500 μm in A,B; 5 μm in E,F.
Fig. 2.
Fig. 2.
Loss of Nf2 leads to a marked expansion of the cortical hem. (A,B) DAPI staining shows the overall structure of control and Nf2F/F;Emx1-Cre dorsal telencephalons. (C,D) Lmx1a immunostaining shows enlargement of the cortical hem (dashed lines) in Nf2F/F;Emx1-Cre mouse embryos. C and D are enlargements of the boxed areas in A and B, respectively. (E) Quantification of the number of ventricular zone (VZ) Lmx1a+ hem cells per section. (F-H) Ki67 staining showing increased proliferation of VZ Lmx1a+ hem cells in Nf2F/F;Emx1-Cre embryos at E14.5 and E15.5. (I-K) After a 24-hour BrdU pulse, quantification of Ki67- cells among BrdU+ cells show decreased cell cycle exit of Nf2F/F;Emx1-Cre hem cells at E14.5 and E15.5. All images correspond to the medial level along the anterior-posterior axis of the hem. Quantifications were performed on sections at a similar level. Values are mean ± s.e.m. of three embryos. *P<0.05, **P<0.01, ***P<0.001. Scale bars: 500 μm in A,B; 100 μm in C,D.
Fig. 3.
Fig. 3.
Loss of Nf2 impairs the developmental progression of cortical hem cells. (A-C′) RC2 immunoreactivity is detected at the E14.5 cortical hem (dashed line) and is diminished by E16.5 in control brains. (D-F′) RC2 immunoreactivity is notably stronger at the E14.5 Nf2F/F;Emx1-Cre hem, which persists past E16.5, and becomes diminished by E18.5. (G-I′) In control brains, weak Blbp immunoreactivity is detected at the dorsal hem at E14.5 and the immunoreactivity reaches high levels by E15.5. (J-L′) Although Blbp expression is induced normally at E14.5 Nf2F/F;Emx1-Cre hem, it remains expressed at low levels at E15.5 and E16.5, except for a few cells at the dorsal end of the hem. Arrows point to the dentate neuroepithelium. T, thalamus; LGE, lateral ganglionic eminence. Scale bars: 100 μm.
Fig. 4.
Fig. 4.
Loss of Nf2 leads to defective hippocampal development. (A-H) Similar expression patterns of Axin2, Lef1, Prox1 and Zbtb20 in control and Nf2F/F;Emx1-Cre E14.5 hippocampal primordium. (I,J) In both control and Nf2F/F;Emx1-Cre E14.5 brains, Tbr2+ cells are found in the subventricular zone (SVZ) of the hippocampal primordium and in the migratory stream leaving the dentate SVZ (arrowheads). (K,L) Immunostaining for the NPC marker Sox2 shows the increased width of the hippocampal VZ of E15.5 Nf2F/F;Emx1-Cre brains. (M-T) At E17.5, the dentate gyrus (DG) labeled by Prox1 (M,N, arrowheads) and the pyramidal cell layer (CA1 and CA3) labeled by SCIP (Pou3f1), KA1 (Grik4) and Zbtb20/Brn1a, are much smaller in Nf2F/F;Emx1-Cre brains. At this stage, KA1 is normally expressed in both CA3 and DG (Q), but these two fields are morphologically not well-separated in Nf2 mutants (R, arrowhead). Blue signals in M,N,S,T are DAPI staining. (U,V) The nestin expression level is considerably stronger in hippocampal (arrowheads) and neocortical (asterisks) neuroepithelia of E17.5 Nf2F/F;Emx1-Cre mouse embryos. Scale bars: 100 μm in A-J; 200 μm in K-V.
Fig. 5.
Fig. 5.
Loss of Nf2 results in fewer Cajal-Retzius cells at the hippocampal region, a smaller hippocampal fissure and malformation of the radial glial scaffold. (A-H) Immunostaining for the Cajal-Retzius (CR) cell markers p73 (arrowheads in A,B), reelin and calretinin shows fewer CR cells at the E14.5 Nf2F/F;Emx1-Cre hippocampal primordium. Tbr2+ cells at the hem are also reduced (D). (C,D) Mean number of positive cells per section ± s.d. (n=3 embryos). *P<0.05, ***P<0.001. (I-N) The hippocampal fissures (arrows) are much smaller in E17.5 Nf2F/F;Emx1-Cre brains. (O,P) Gfap immunostaining showing abnormal dentate glial scaffolds in E17.5 Nf2F/F;Emx1-Cre brains, manifested by the presence of ectopic Gfap+ fibers at the hippocampal and hem regions (yellow arrows), lack of a tightly bundled radial glial shaft (white arrows), and absence of glial fibers below the reelin+ hippocampal fissure (arrowheads). Blue signals are DAPI staining. Scale bars: 100 μm in A-H; 200 μm in I-P.
Fig. 6.
Fig. 6.
Loss of Nf2 results in increased Yap/Taz transcriptional activity. (A) Quantitative RT-PCR analysis of eight genes found by microarray to be upregulated in both E13.5 Nf2F/F;Emx1-Cre dorsal telencephalon and E11.5 TetO-YAP1;Nes-rtTA brain confirms significant upregulation of six genes in both genotypes compared with their respective controls. (B,C) No noticeable difference in phospho-S112-Yap (pYap) immunoreactivity between E14.5 control and Nf2F/F;Emx1-Cre dorsal telencephalon. (D) Quantitative RT-PCR shows upregulation of Ctgf, Cyr61 and clusterin (Clu) transcripts in E13.5 Nf2F/F;Nes-Cre brain. (E) Quantitative western blot analysis shows increased Yap/Taz levels in E13.5 Nf2F/F;Nes-Cre brain, but the amount of pYap is unchanged. Two Yap antibodies were used; that from Cell Signaling Technology (CST) recognizes both Yap and Taz. (F) Subcellular fractionation followed by quantitative western blots shows increased Yap/Taz proteins in the nuclear and, to a lesser extent, the cytosol/membrane fractions of E13.5 Nf2F/F;Nes-Cre brains compared with those of control brains. Values are mean ± s.e.m. of three (A,D) or four (E,F) embryos per group. (G) Quantitative western blot analysis of NPC cultures treated with cycloheximide (CHX) for the indicated time showing increased stability of Yap/Taz proteins in Nf2F/F;Emx1-Cre NPCs. 20 μg protein was loaded per lane. The protein level at the zero time point is set at 1. Graphs show the mean ± s.e.m. of two control and three Nf2F/F;Emx1-Cre NPC lines. (H) The steady-state levels of pYap do not differ between control and Nf2F/F;Emx1-Cre NPCs, and those of Yap/Taz show a trend of increase. Values are mean±s.d. of two control and three Nf2F/F;Emx1-Cre NPC lines. *P<0.05, **P<0.01, ***P<0.001.
Fig. 7.
Fig. 7.
YAP overexpression causes similar hippocampal defects to Nf2 loss. (A) Quantitative western blots showing increased YAP in the cytosol/membrane and nuclear fractions of E13.5 TetO-YAP1;Nes-rtTA double-transgenic (dTG) brains. (B-D) p73+ CR cells (arrowheads in B,C) are reduced at the hippocampal primordium of E14.5 dTG mouse embryos. (E-G) Lmx1a immunostaining shows enlargement of the hem (dashed lines) in E15.5 dTG embryos. (H-M) At E17.5, the size of the hippocampal fissure (HF, arrows), the dentate gyrus (DG, arrowheads), and the pyramidal cell layer (CA) are all reduced in dTG brains. CH, cortical hem. (N,O) The Gfap+ radial glial scaffold is defective in E17.5 dTG embryos, as shown by the presence of ectopic Gfap+ fibers at the hippocampal and hem regions (yellow arrows), lack of a tightly bundled shaft (white arrows) and absence of Gfap+ fibers below the reelin+ HF (arrowheads). (P,Q) Nestin immunoreactivity is stronger at the E17.5 dTG hippocampus (arrowheads). Blue signals are DAPI staining. Values in A are the mean ± s.e.m. of five control and four dTG embryos; values in D,G are the mean number of positive cells per section ± s.d. (n=3 embryos). *P<0.05, ***P<0.001. Scale bars: 100 μm in B,C; 200 μm in H-Q.
Fig. 8.
Fig. 8.
Loss of Yap suppresses the hippocampal defects associated with Nf2 deletion. (A-C) Lmx1a immunostaining shows that deleting both alleles of Yap significantly suppresses hem enlargement in E15.5 Nf2 mutants. Values are mean ± s.e.m. of a series of Nf2 and Yap single and double mutants, the genotypes of which are shown below the x-axis. **P<0.01, ***P<0.001; n.s., not significant (P>0.05). CP, choroid plexus. (D-R) Prox1, Zbtb20/Brn1a and p73 immunostaining showing the dentate gyrus (DG; D-H, arrowheads), the pyramidal cell layer (CA, I-M) and the hippocampal fissure (HF; N-R, arrows), respectively, of P0 mice of the indicated genotypes. Note the much smaller DG, CA and HF in Nf2F/F;Emx1-Cre mice (E,J,O versus D,I,N) and the normal sized DG, CA and HF in Nf2F/F;YapF/F;Emx1-Cre mice (H,M,R). Deleting one allele of Yap does not suppress the hippocampal phenotype of Nf2 mutants (G,L,Q). The hippocampus of Nf2F/+;YapF/F;Emx1-Cre mice appears normal (F,K,P). (S-W) Gfap and reelin immunostaining showing the dentate glial scaffold and HF, respectively. Note the defects associated with the dentate glial scaffold of Nf2F/F;Emx1-Cre mice (T versus S), including the excessive Gfap+ fibers at the hem (yellow arrows), the absence of the subpial glial shaft (white arrows) and the absence of glial fibers below the reelin+ HF (arrowheads). These defects are suppressed by deleting Yap (W). Blue signals are DAPI staining. Scale bars: 100 μm in A,B; 200 μm in D-W.

References

    1. Akhmametyeva E. M., Mihaylova M. M., Luo H., Kharzai S., Welling D. B., Chang L. S. (2006). Regulation of the neurofibromatosis 2 gene promoter expression during embryonic development. Dev. Dyn. 235, 2771–2785 - PubMed
    1. Altman J., Bayer S. A. (1990). Migration and distribution of two populations of hippocampal granule cell precursors during the perinatal and postnatal periods. J. Comp. Neurol. 301, 365–381 - PubMed
    1. Barry E. R., Camargo F. D. (2013). The Hippo superhighway: signaling crossroads converging on the Hippo/Yap pathway in stem cells and development. Curr. Opin. Cell Biol. 25, 247–253 - PubMed
    1. Baser M. E., R Evans D. G., Gutmann D. H. (2003). Neurofibromatosis 2. Curr. Opin. Neurol. 16, 27–33 - PubMed
    1. Benhamouche S., Curto M., Saotome I., Gladden A. B., Liu C. H., Giovannini M., McClatchey A. I. (2010). Nf2/Merlin controls progenitor homeostasis and tumorigenesis in the liver. Genes Dev. 24, 1718–1730 - PMC - PubMed

Publication types

MeSH terms