. 2013 Aug;140(16):3335-47.
doi: 10.1242/dev.095018. Epub 2013 Jul 17.

Notch3 signaling gates cell cycle entry and limits neural stem cell amplification in the adult pallium

Affiliations

Notch3 signaling gates cell cycle entry and limits neural stem cell amplification in the adult pallium

Alessandro Alunni et al. Development. 2013 Aug.

Abstract

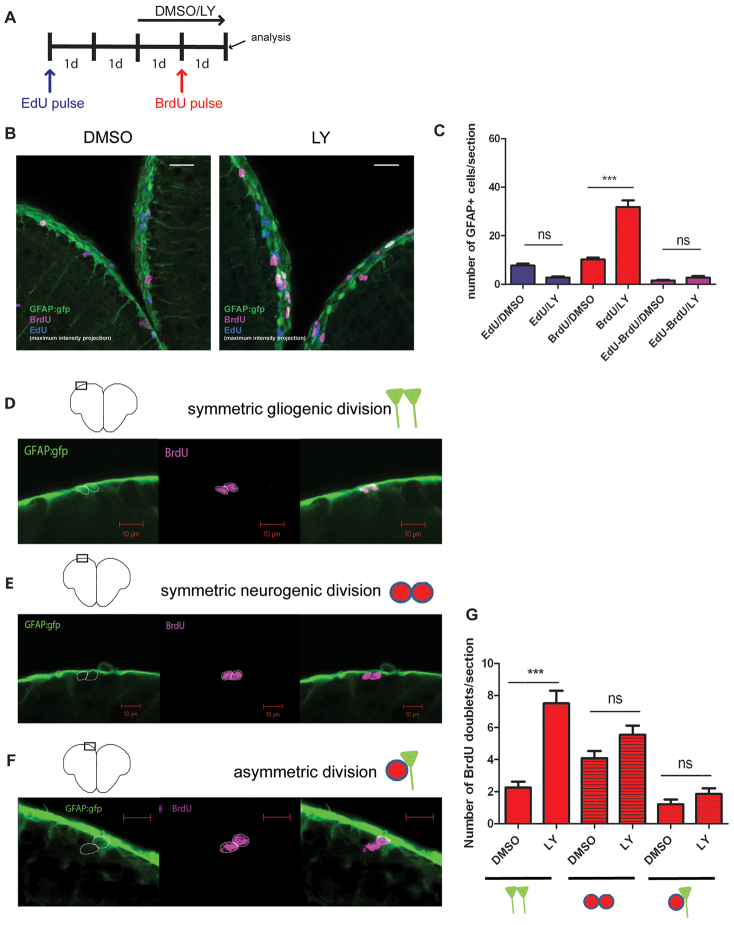
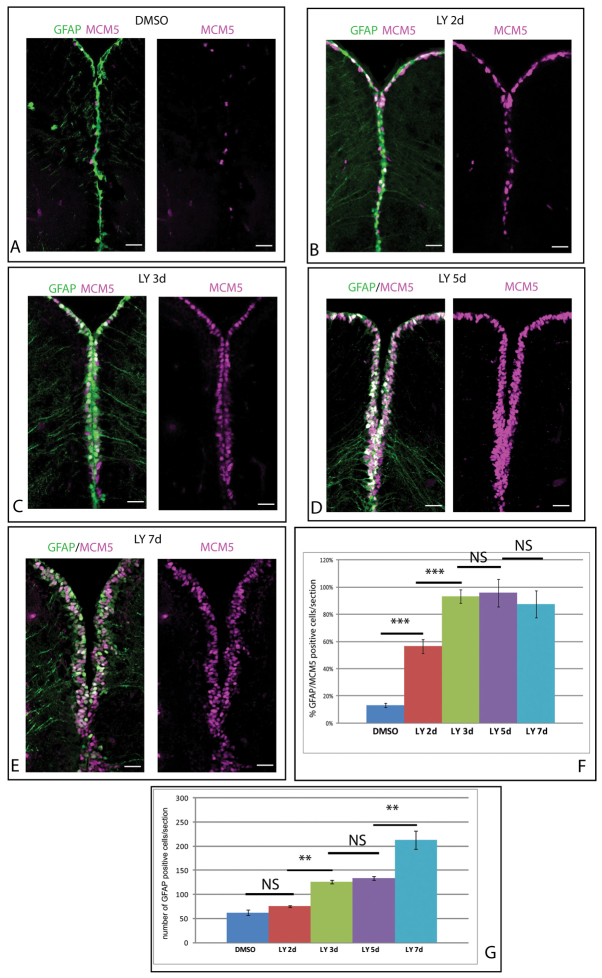
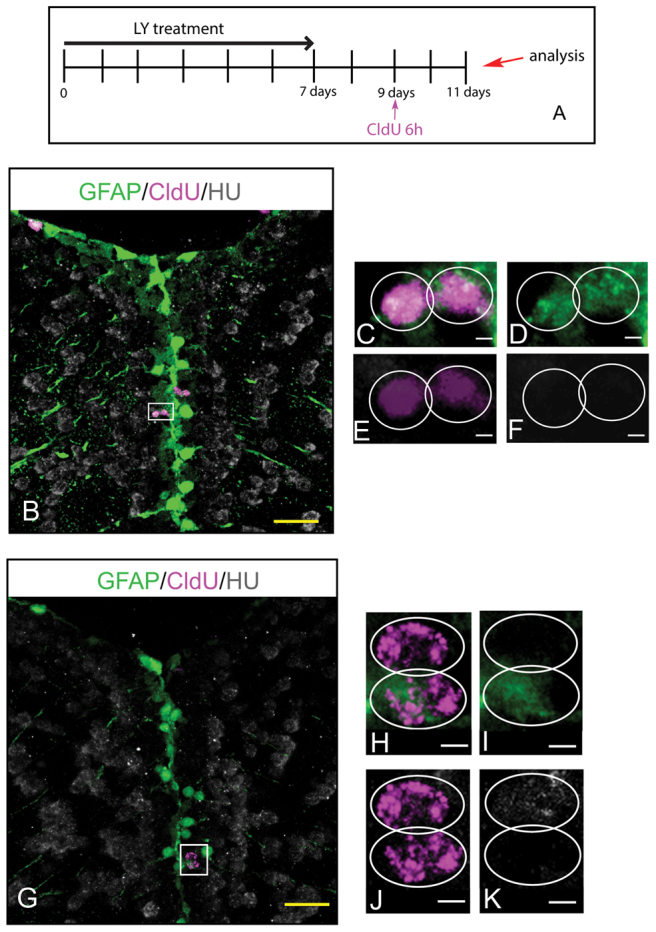
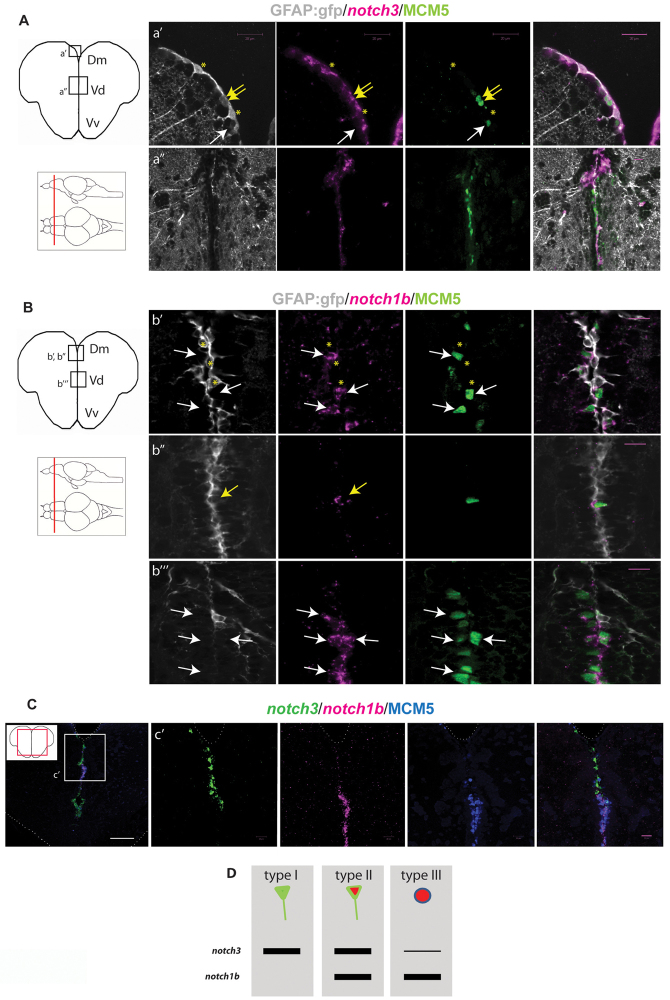
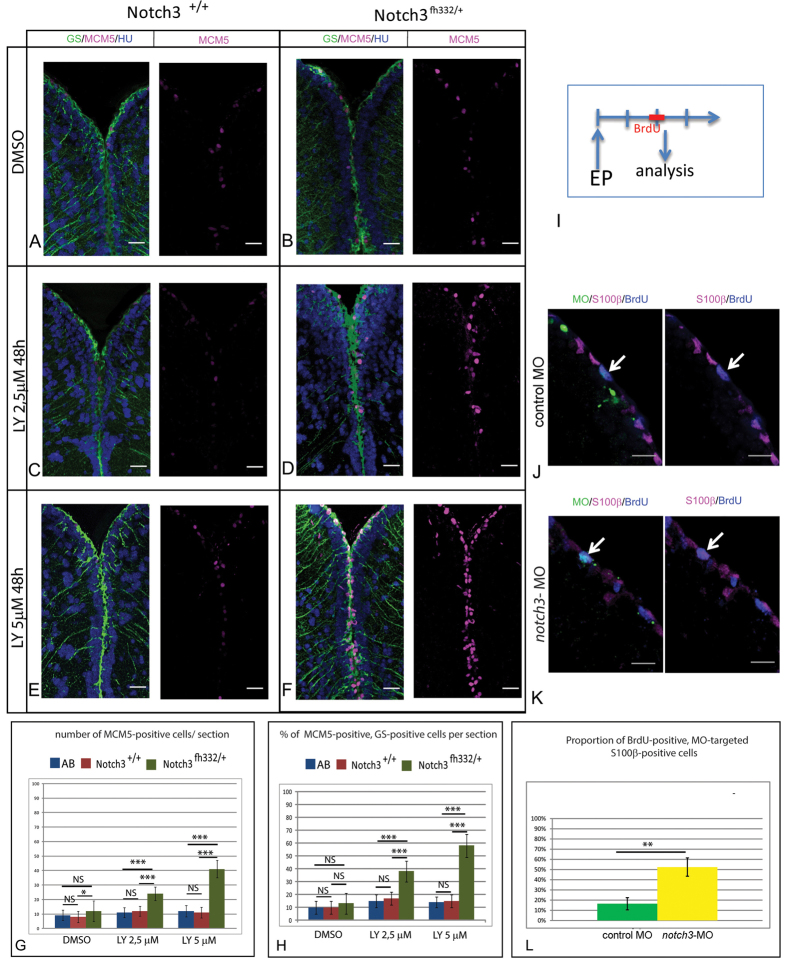
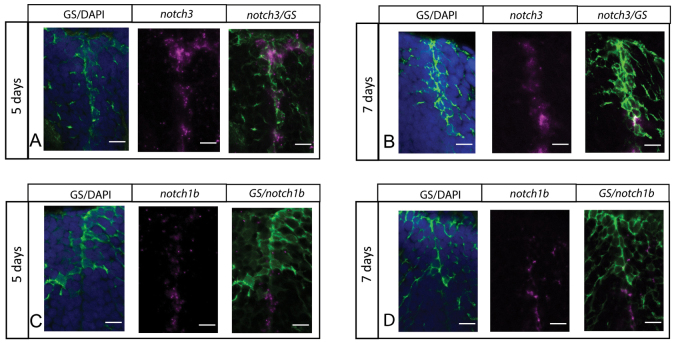
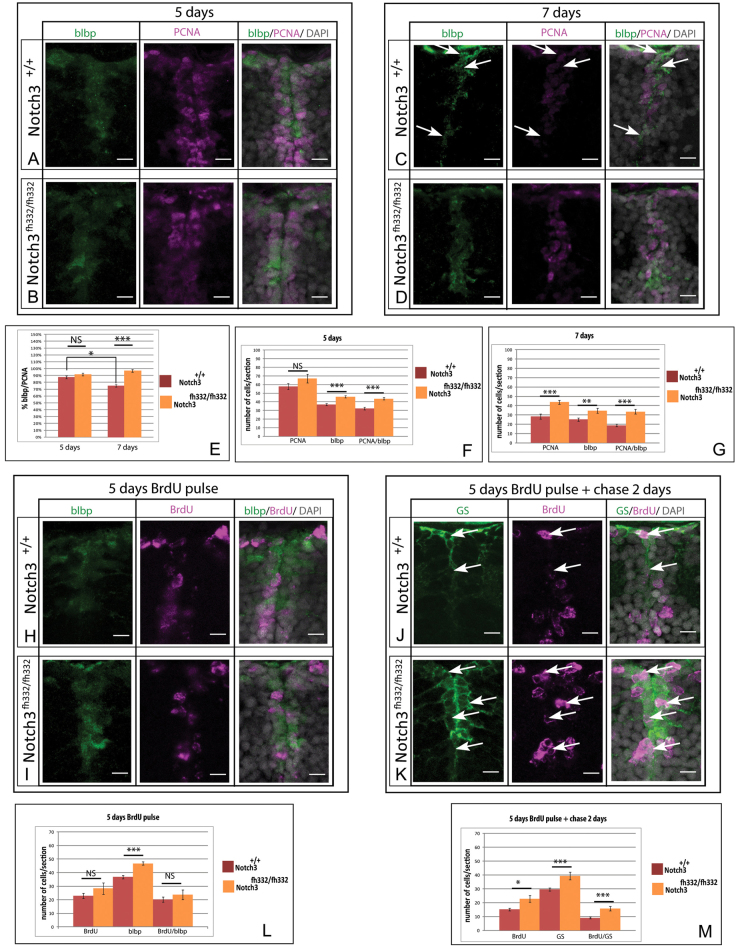
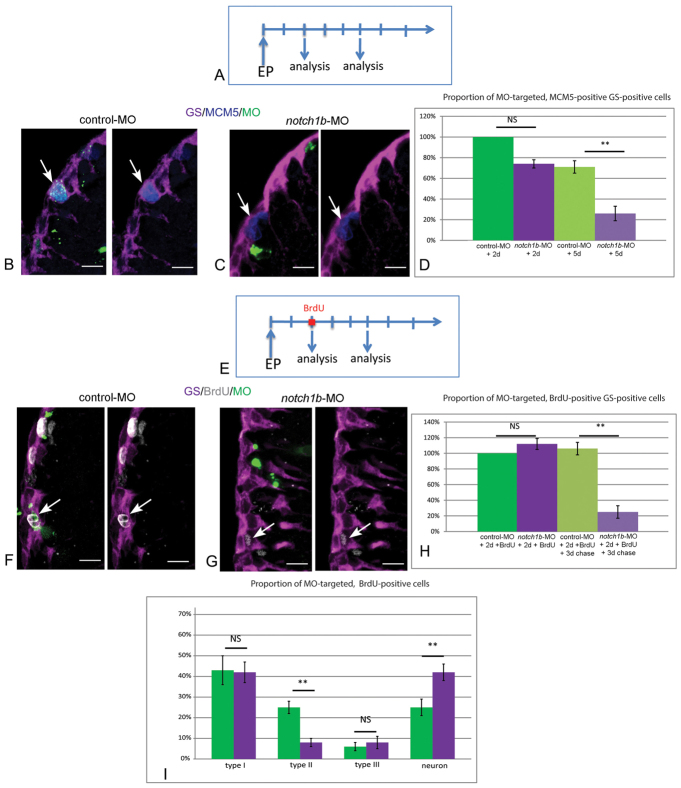
Maintaining the homeostasis of germinal zones in adult organs is a fundamental but mechanistically poorly understood process. In particular, what controls stem cell activation remains unclear. We have previously shown that Notch signaling limits neural stem cell (NSC) proliferation in the adult zebrafish pallium. Combining pharmacological and genetic manipulations, we demonstrate here that long-term Notch invalidation primarily induces NSC amplification through their activation from quiescence and increased occurrence of symmetric divisions. Expression analyses, morpholino-mediated invalidation and the generation of a notch3-null mutant directly implicate Notch3 in these effects. By contrast, abrogation of notch1b function results in the generation of neurons at the expense of the activated NSC state. Together, our results support a differential involvement of Notch receptors along the successive steps of NSC recruitment. They implicate Notch3 at the top of this hierarchy to gate NSC activation and amplification, protecting the homeostasis of adult NSC reservoirs under physiological conditions.

Keywords: Adult neural stem cell; Notch3; Quiescence.


Figures

Fig. 1.
Fig. 1.
Symmetrically dividing radial glial cells (RG) are recruited into the cell cycle during Notch blockade. (A) Experimental design. An initial cohort of RG in S phase was labeled with an EdU pulse followed by a second pulse of BrdU during Notch blockade (LY). 1d, 1-day intervals. (B) Triple immunostaining showing GFAP- (green), BrdU- (magenta) and EdU- (blue) positive cells in the Dm region of the pallium (confocal projections over 16 and 19 μm, respectively). (C) Quantification of EdU-positive, BrdU-positive and EdU/BrdU-positive RG. Red bars, P<0.0001; blue bars, P=0.07; pink bars, P>1 (n=4 brains for each treatment, total number of cells counted: 1156). (D-G) Division modes of RG and quantification of BrdU-positive doublets in the experimental setting shown in A. Symmetric gliogenic divisions, P<0.0001; other division modes, P>1; n=273 doublets counted. Scale bars: white, 20 μm; red 10 μm.
Fig. 2.
Fig. 2.
Notch invalidation triggers continuous overgrowth of the pallial GZ through RG amplification. (A-E) Cross-sections of the pallial ventricular zone following different length of LY411575 treatment (d, days of treatment) stained for the RG marker GFAP-GFP (green) and the proliferation marker MCM5 (magenta). (F) Percentage of RG in cycle (GFAP/MCM5 positive) during LY treatment. (G) Total number of RG (GFAP positive). **P<0.005; ***P<0.0001 (n=4 brains for each condition). Scale bars: 20 μm. Confocal projections of four optical planes (each 1 μm).
Fig. 3.
Fig. 3.
Individual RG cells maintain stem cell properties after Notch blockade. (A) Experimental design. (B-K) Single optical section of the pallial ventricular zone in gfap:gfp transgenic brains, triple labeled for GFP (RG, green), CldU (magenta) and HuC/D (gray). (C-F) High magnification of the area boxed in B; example of a self-renewing, symmetric gliogenic division. (H-K) High magnification of the area boxed in G; example of a self-renewing and asymmetric division. Scale bars: yellow, 20 μm; white, 2 μm.
Fig. 4.
Fig. 4.
notch3 and notch1b are differentially expressed in adult pallial progenitors. (A) notch3 expression revealed by fluorescent in situ hybridization (magenta) on telencephalic cross-sections of a gfap:gfp brain, together with a double fluorescent immunostaining for GFP (RG, gray) and MCM5 (green). (a′) Dorsomedial (Dm) region of the pallium, notch3 expression is found in quiescent (type I) (yellow asterisks) and proliferating (type II) (yellow arrows) RG. Transcripts are absent from type III cells (white arrows). (a′) Pallial-subpallial junction, enriched in type III cells: notch3 expression is very low or absent. (B) notch1b expression (magenta) compared with GFAP-GFP (RG, gray) and MCM5 (green). (b′,b′) Dm; white and yellow arrows indicate notch1b-positive type II RG (b′) and type III progenitors (b′), respectively. Transcripts are absent from quiescent RG (b′, yellow asterisks). (b′′) Pallial-subpallial junction: notch1b is strongly expressed in type III cells. (C) Double fluorescent in situ hybridization for notch3 (green) and notch1b (magenta) with immunostaining for MCM5 (blue). (c′) High magnification of the pallial-subpallial junction: notch3 is expressed by RG cells of Dm and notch1b by type III progenitors. (D) Graphic representation of notch3 and notch1b expression in the different progenitor cell types (according to März et al., 2010). In Dm, notch3 is expressed by 97% of type I cells (n=229 cells counted), 88% of type II cells (n=31 cells) and 2% of type III cells(n=23 cells); notch1b is expressed by 2.8% of type I cells (n=141 cells), 90% of type II cells (n=43 cells) and 85% of type III cells. Scale bars: white, 100 μm; magenta, 20 μm. Single optical confocal planes, 1 μm.
Fig. 5.
Fig. 5.
Notch3 inhibition accounts for the effect of Notch blockade on RG activation. (A-F) Triple immunohistochemistry for the RG marker glutamine synthetase (GS, green), MCM5 (magenta) and HuC/D (blue) on telencephalic cross-sections from adult notch3+/+ siblings and notch3fh332/+ heterozygotes under control conditions (top row) or upon LY treatment (middle and bottom rows). Scale bar: 20 μm. Confocal projection images from four optical planes, each 1 μm thick. (G,H) Total number of MCM5-positive progenitors per section (G) and proportion of RG cells in proliferation (H) in the different genotypes and treatment conditions, as well as in the standard AB wild-type line. P<0.0001 (n=3 brains for AB, notch3+/+ and notch3fh332/+, respectively). (I) Schematic of the notch3-MO knock-down experiment: a BrdU pulse is applied 2 days after electroporation (EP) of fluorescein-labeled notch3-MO or control-MO in pallial ventricular cells. Brains are analyzed immediately. (J,K) Analysis of the proliferation status (anti-BrdU) (blue) of electroporated (fluorescein-positive) (green) RG (anti-S100β) (magenta), assessed by immunocytochemistry. Arrows indicate fluorescein-labeled radial glia BrdU-positive cells. Scale bar: 20 μm. Confocal projection images from four optical planes, each 1 μm thick. (L) Proportion of BrdU-positive cells within the radial glia MO-targeted population. P<0.001 (n=3 brains for each condition).
Fig. 6.
Fig. 6.
notch3 expression, but not notch1b, characterizes RG of the juvenile zebrafish pallium. (A-D) Fluorescent in situ hybridization (magenta) for notch3 (A,B) or notch1b (C,D), and immunocytochemistry for the RG marker GS (green) (blue: DAPI), on cross-sections of the pallium at 5 and 7 dpf. Scale bars: 10 μm. Confocal projection images from four optical planes, each 1 μm thick.
Fig. 7.
Fig. 7.
Notch3 promotes NSC quiescence and limits amplifying divisions in the juvenile pallium. (A-D) Cross-sections of the pallial ventricular zone at 5 (C,D) and 7 (A,B) dpf stained for the RG marker BLBP (green) and the proliferation marker PCNA (magenta) (gray: DAPI) in notch3fh332/fh332 homozygous mutants (B,D) and notch3+/+ siblings (A,C). White arrows at 7 dpf indicate quiescent RG. (E-G) Total number of proliferating cells (PCNA), RG (BLBP) and proliferating RG (PCNA/BLBP) per section at 7 dpf (E) and 5 dpf (F), and proportion of proliferating RG (G). (H-K) Cross-sections of the pallial ventricular zone at 5 (H,I) and 7 (J,K) dpf stained for the RG markers BLBP or GS (green) and for BrdU (magenta) (gray: DAPI) in notch3fh332/fh332 homozygous mutants (I,K) and notch3+/+ siblings (H,J). 7 dpf animals were pulsed with BrdU at 5 dpf and chased for 2 days. White arrows indicate BrdU-positive cells that remain as RG in mutants. (L,M) Total number of BrdU-positive cells (BrdU), RG (BLBP or GS) and BrdU-positive RG (BrdU/BLBP or BrdU/GS) per section at 5 dpf immediately after the BrdU pulse (L) and after 2 days of chase (M). *P<0.05; **P<0.005; ***P<0.0001 (n=3 for both notch3+/+ and notch3fh332/fh332 fish). Scale bars: 10 μm. Confocal projection images from four optical planes, each 1 μm thick.
Fig. 8.
Fig. 8.
Notch1b is required for the maintenance of progenitor division and fate. (A) Schematic of the notch1b-MO knock-down experiment: brains are analyzed 2 and 5 days after electroporation of fluorescein-labeled notch1b-MO or control-MO in pallial ventricular cells. (B,C) Analysis of the proliferation status (anti-MCM5) (blue) of electroporated (fluorescein-positive) (green) RG (anti-GS) (magenta), assessed by immunocytochemistry 5 days after electroporation. Arrows indicate proliferating RG, usually notch1b-MO-negative. (D) Proportion of MCM5-positive, GS-positive cells within the MO-targeted population, 2 days (P=0.05) and 5 days (**P<0.001) after electroporation (n=3 brains for each condition). (E) Schematic of the fate analysis in notch1b-MO knock-down experiments: a BrdU pulse is applied 2 days after electroporation of fluorescein-labeled notch1b-MO or control-MO in pallial ventricular cells. Brains are analyzed immediately or after a 3-day chase. (F,G) Analysis of BrdU labeling (white) in electroporated (fluorescein-positive) (green, arrows) RG (anti-GS) (magenta), assessed by immunocytochemistry after a 3-day chase. Arrows indicate fluorescein-labeled BrdU-positive cells in control-MO (glial cells F) and in notch1b-MO (G). (H) Proportion of BrdU-positive, GS-positive cells within the MO-targeted population, 2 days (P=0.05) and 5 days (**P<0.001) after electroporation (n=3 brains for each condition). (I) Proportion of type I (GS positive, MCM5 negative), type II (GS positive, MCM5 positive), type III (GS negative, MCM5 positive) and non-progenitor cells (GS negative, MCM5 negative) [presumably neurons, which virtually constitute the only non-progenitor cell type generated from the pallial GZ (Chapouton et al., 2010; Rothenaigner et al., 2011)] within the BrdU-positive MO-targeted population 5 days after electroporation (type II, neurons: **P<0.001) (n=3 brains for each condition). Scale bars: 10 μm. Confocal projection images from four optical planes, each 0.5 μm thick.

References

    1. Ables J. L., Decarolis N. A., Johnson M. A., Rivera P. D., Gao Z., Cooper D. C., Radtke F., Hsieh J., Eisch A. J. (2010). Notch1 is required for maintenance of the reservoir of adult hippocampal stem cells. J. Neurosci. 30, 10484–10492 - PMC - PubMed
    1. Ables J. L., Breunig J. J., Eisch A. J., Rakic P. (2011). Not(ch) just development: Notch signalling in the adult brain. Nat. Rev. Neurosci. 12, 269–283 - PMC - PubMed
    1. Adolf B., Chapouton P., Lam C. S., Topp S., Tannhäuser B., Strähle U., Götz M., Bally-Cuif L. (2006). Conserved and acquired features of adult neurogenesis in the zebrafish telencephalon. Dev. Biol. 295, 278–293 - PubMed
    1. Andreu-Agulló C., Morante-Redolat J. M., Delgado A. C., Fariñas I. (2009). Vascular niche factor PEDF modulates Notch-dependent stemness in the adult subependymal zone. Nat. Neurosci. 12, 1514–1523 - PubMed
    1. Basak O., Giachino C., Fiorini E., Macdonald H. R., Taylor V. (2012). Neurogenic subventricular zone stem/progenitor cells are Notch1-dependent in their active but not quiescent state. J. Neurosci. 32, 5654–5666 - PMC - PubMed

Publication types

MeSH terms

LinkOut - more resources