. 2013 Aug;123(8):3272-91.
doi: 10.1172/JCI67674. Epub 2013 Jul 25.

Rapamycin extends murine lifespan but has limited effects on aging

Affiliations

Rapamycin extends murine lifespan but has limited effects on aging

Frauke Neff et al. J Clin Invest. 2013 Aug.

Abstract

Aging is a major risk factor for a large number of disorders and functional impairments. Therapeutic targeting of the aging process may therefore represent an innovative strategy in the quest for novel and broadly effective treatments against age-related diseases. The recent report of lifespan extension in mice treated with the FDA-approved mTOR inhibitor rapamycin represented the first demonstration of pharmacological extension of maximal lifespan in mammals. Longevity effects of rapamycin may, however, be due to rapamycin's effects on specific life-limiting pathologies, such as cancers, and it remains unclear if this compound actually slows the rate of aging in mammals. Here, we present results from a comprehensive, large-scale assessment of a wide range of structural and functional aging phenotypes, which we performed to determine whether rapamycin slows the rate of aging in male C57BL/6J mice. While rapamycin did extend lifespan, it ameliorated few studied aging phenotypes. A subset of aging traits appeared to be rescued by rapamycin. Rapamycin, however, had similar effects on many of these traits in young animals, indicating that these effects were not due to a modulation of aging, but rather related to aging-independent drug effects. Therefore, our data largely dissociate rapamycin's longevity effects from effects on aging itself.


Figures

Figure 1
Figure 1. Rapamycin extended lifespan.
Survival curves were calculated for rapamycin- and vehicle-treated mice (all cohorts; n = 68 per group). Statistical analysis using a Cox proportional hazards model with the data stratified by cohort revealed a significant effect of rapamycin treatment (P = 0.0326).
Figure 2
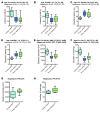
Figure 2. Rapamycin treatment had limited effects on aging-associated neurobehavioral phenotypes.
Basic neurological functions were assessed in the 16-month (young control, n = 10; vehicle, n = 18; rapamycin, n = 20) and 25-month (young control, n = 10; vehicle, n = 11; rapamycin, n = 16) cohorts. (A and B) Latency to fall in the context of a motor coordination test on the accelerating rotarod. (C and D) Latency to first and second reaction on a hot plate test performed to assess nociceptive functions. (E and F) Exploratory activity, as examined in an open field assay. (E) Distance traveled. (F) Number of rearings. (G and H) Effects of rapamycin on exploratory activity in young mice (vehicle, n = 9; rapamycin, n = 8). Whisker plots display minimum, 25th percentile, median, 75th percentile, and maximum. P values and fit coefficients with 95% confidence intervals are shown; statistically significant differences (P < 0.05) are denoted by bold font.
Figure 3
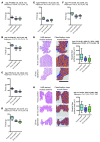
Figure 3. Chronic rapamycin treatment resulted in aging-independent improvements of learning and memory.
Learning and memory was examined in our aging cohorts using an object place recognition paradigm (A), the Morris water maze (BD) and a context fear conditioning paradigm (E) (11-month vehicle, n = 20; 20-month vehicle, n = 16; 11-month rapamycin, n = 20; 20-month rapamycin, n = 19). (A) Exploration times of the objects in the novel and familiar location, respectively, during the test of the object place recognition task. (B) Escape latencies during training on a hidden version of the Morris water maze task. (C) Quadrant occupancy and (D) target crossing measures during the probe trial given after completion of training in the Morris water maze. TQ, target quadrant; OQ, other quadrants. (E) Activity suppression ratios during a context test given 1 day after associative training in a context fear conditioning paradigm. (FH) To test for aging-independent effects of rapamycin on learning and memory, we assessed young mice chronically treated with rapamycin or vehicle (n = 15 per group) in the Morris water maze. (F) Escape latencies during training. (G) Quadrant occupancy and (H) target crossings during a probe trial delivered after completion of training. All graphs show mean ± SEM.
Figure 4
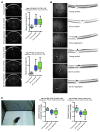
Figure 4. Rapamycin did not improve age-related reductions in grip strength and cross-sectional muscle fiber area.
(AF) Aging-related decline in muscle strength was assessed using 2-paw (A, C, and E) and 4-paw (B, D, and F) grip strength tests in the 16-month (A and B; young control, n = 10; vehicle, n = 18; rapamycin, n = 20), 25-month (C and D; young control, n = 10; vehicle, n = 11; rapamycin, n = 16), and 34-month (E and F; young control, n = 10; vehicle, n = 9; rapamycin, n = 14) cohorts. (G and H) Muscle fibers were automatically identified on H&E-stained sections of quadriceps femoris muscle of the 16-month (G; young control, n = 786 muscle fibers from 5 mice; vehicle, n = 534 muscle fibers from 6 mice; rapamycin, n = 600 muscle fibers from 8 mice) and 25-month (H; young control, n = 330 muscle fibers from 6 mice; vehicle, n = 741 muscle fibers from 4 mice; rapamycin, n = 1,371 muscle fibers from 5 mice) cohorts using image segmentation and analysis software. Shown are examples of histological images and classification maps (generated via automated segmentation of histological images) along with quantification of cross-sectional muscle fiber area. Scale bar: 400 μm. Whisker plots display 25th percentile, median, and 75th percentile as well as minimum-to-maximum (AF) or 10th to 90th percentile (G and H). P values and fit coefficients with 95% confidence intervals are shown; statistically significant differences (P < 0.05) are denoted by bold font.
Figure 5
Figure 5. Rapamycin did not improve age-related ophthalmological impairments.
Summary of findings from ophthalmological assessment of the 16-month (young control, n = 10; vehicle, n = 18; rapamycin, n = 20) and 25-month (young control, n = 10; vehicle, n = 8; rapamycin, n = 14) cohorts. (A) Quantification of lens densities, assessed via Scheimpflug imaging; example images are also shown. (B) Optical coherence tomography was performed for in vivo assessment of the posterior part of the eye. Example images are shown. No age or treatment effects were noted. (C) Visual acuity was examined with the virtual drum test. Whisker plots display minimum, 25th percentile, median, 75th percentile, and maximum. P values and fit coefficients with 95% confidence intervals are shown; statistically significant differences (P < 0.05) are denoted by bold font.
Figure 6
Figure 6. Aging-associated functional cardiac alterations were not restored by rapamycin treatment.
Key findings of a comprehensive assessment of cardiac function using echocardiography (young control, n = 10; 26-month vehicle, n = 17; 26-month rapamycin, n = 10). (A) Ejection fraction. (B) Fractional shortening. (C) Flow velocity across the aortic valve. (D) Pressure gradient across the aortic valve. (E) Flow velocity across the pulmonary valve. (F) Pressure gradient across the pulmonary valve. Whisker plots display minimum, 25th percentile, median, 75th percentile, and maximum. P values and fit coefficients with 95% confidence intervals are shown; statistically significant differences (P < 0.05) are denoted by bold font.
Figure 7
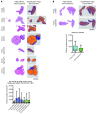
Figure 7. Rapamycin decreased thyroid follicle size in an aging-independent manner.
Thyroid follicles were automatically identified on H&E-stained thyroid sections using image segmentation and analysis software. Shown are examples of histological images and classification maps (generated via automated segmentation of histological images) along with quantification of follicle surface area. (A) Follicle size distribution in rapamycin- and vehicle-treated aged mice as well as young controls (young control, n = 1,428 follicles from 12 mice; 16-month vehicle, n = 566 follicles from 8 mice; 25-month vehicle, n = 241 follicles from 3 mice; 34-month vehicle, n = 440 follicles from 5 mice; 16-month rapamycin, n = 1,064 follicles from 10 mice; 25-month rapamycin, n = 277 follicles from 4 mice; 34-month rapamycin, n = 535 follicles from 8 mice). (B) Corresponding data from a comparison of young animals treated with rapamycin (n = 1,182 follicles from 8 mice) or vehicle (n = 1,543 follicles from 9 mice). Scale bars: 500 μm. Whisker plots display 10th percentile, 25th percentile, median, 75th percentile, and 90th percentile. P values and fit coefficients with 95% confidence intervals are shown; statistically significant differences (P < 0.05) are denoted by bold font.
Figure 8
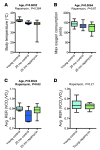
Figure 8. Rapamycin treatment had no significant effect on age-related changes in maximal O2 consumption and body temperature, but increased RER.
(AC) Findings from a metabolic assessment (indirect calorimetry) of the 25-month cohort (young control, n = 10; vehicle, n = 10; rapamycin, n = 14). (A) Body temperature. (B) Maximal O2 consumption. (C) Average RER. Data were analyzed by fitting them with a linear model against the factors of age (young vs. old), treatment (rapamycin vs. vehicle), and body weight. (D) Effects of rapamycin on RER in young mice (control, n = 9; rapamycin, n = 8). Whisker plots display minimum, 25th percentile, median, 75th percentile, and maximum. P values and fit coefficients with 95% confidence intervals are shown; statistically significant differences (P < 0.05) are denoted by bold font. See Supplemental Tables 11 and 12 for complete findings.
Figure 9
Figure 9. Rapamycin counteracted a subset of age-related changes in the T lymphocyte compartment.
(A) CD4+ T cell populations in the 16-month cohort. (B and C) CD25+CD4+ T cell populations in the 16-month cohort (B) and in young animals chronically treated with rapamycin or vehicle (C). (D and E) CD44hiCD4+ T cell populations in the 16-month cohort (D) and in young animals chronically treated with rapamycin or vehicle (E). (F) NK cell frequency in the 16-month cohort. Whisker plots display minimum, 25th percentile, median, 75th percentile, and maximum. P values and fit coefficients with 95% confidence intervals are shown; statistically significant differences (P < 0.05) are denoted by bold font. See Supplemental Figures 11–13 for complete datasets.
Figure 10
Figure 10. Rapamycin partially counteracted age-associated increases in plasma Ig concentrations.
Plasma Ig levels in the 16-month (A and B) and 34-month (CH) cohorts. Whisker plots display minimum, 25th percentile, median, 75th percentile, and maximum. P values and fit coefficients with 95% confidence intervals are shown; statistically significant differences (P < 0.05) are denoted by bold font.
Figure 11
Figure 11. Rapamycin treatment had no apparent effect on most aging-associated changes on clinical chemistry parameters.
Shown are selected clinical chemistry results from the 16-month cohort (young control, n = 10; vehicle, n = 16; rapamycin, n = 19). (A) Plasma sodium concentration. (B) Plasma calcium concentration. (C) Plasma chloride concentration. (D) Total protein in plasma. (E) Plasma glucose. (F) Plasma α-amylase. Whisker plots display minimum, 25th percentile, median, 75th percentile, and maximum. P values and fit coefficients with 95% confidence intervals are shown; statistically significant differences (P < 0.05) are denoted by bold font. See Supplemental Figures 17–19 for complete clinical chemistry findings from all cohorts.
Figure 12
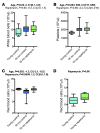
Figure 12. Rapamycin increased rbc counts.
(AC) Hematology results for the 16-month cohort (young control, n = 10; vehicle, n = 16; rapamycin, n = 19). (A) wbc count. (B) Platelet count. (C) rbc count. (D) Effects of rapamycin on rbc count in young mice (control, n = 9; rapamycin, n = 8). Whisker plots display minimum, 25th percentile, median, 75th percentile, and maximum. P values and fit coefficients with 95% confidence intervals are shown; statistically significant differences (P < 0.05) are denoted by bold font. See Supplemental Figures 21–23 for complete hematology results.

Comment in

Similar articles

Cited by

References

    1. Olshansky SJ, Perry D, Miller RA, Butler RN. In pursuit of the longevity dividend. Scientist. 2006;20(3):28–36.
    1. Kapahi P, et al. With TOR, less is more: a key role for the conserved nutrient-sensing TOR pathway in aging. Cell Metab. 2010;11(6):453–465. doi: 10.1016/j.cmet.2010.05.001. - DOI - PMC - PubMed
    1. Kapahi P, Zid BM, Harper T, Koslover D, Sapin V, Benzer S. Regulation of lifespan in Drosophila by modulation of genes in the TOR signaling pathway. Curr Biol. 2004;14(10):885–890. doi: 10.1016/j.cub.2004.03.059. - DOI - PMC - PubMed
    1. Vellai T, Takacs-Vellai K, Zhang Y, Kovacs AL, Orosz L, Muller F. Genetics: influence of TOR kinase on lifespan in C. elegans. Nature. 2003;426(6967):620. - PubMed
    1. Jia K, Chen D, Riddle DL. The TOR pathway interacts with the insulin signaling pathway to regulate C. elegans larval development, metabolism and life span. Development. 2004;131(16):3897–3906. doi: 10.1242/dev.01255. - DOI - PubMed

Publication types

MeSH terms