

Prevention of diabetes with pioglitazone in ACT NOW: physiologic correlates
- PMID: 23863810
- PMCID: PMC3806596
- DOI: 10.2337/db13-0265
Prevention of diabetes with pioglitazone in ACT NOW: physiologic correlates
Abstract
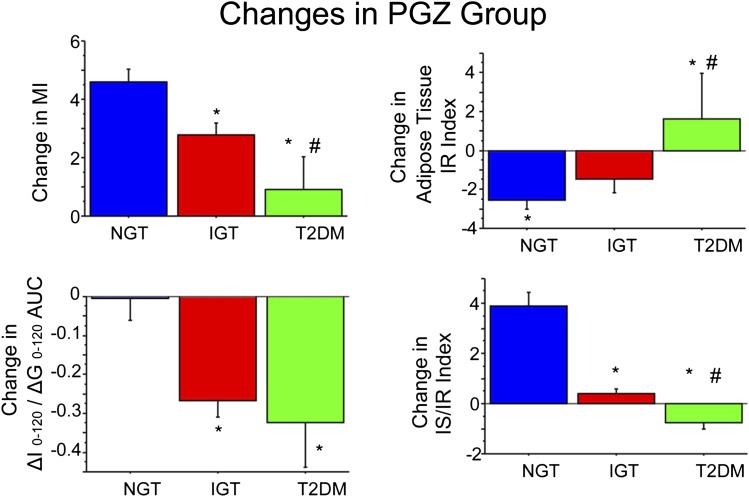
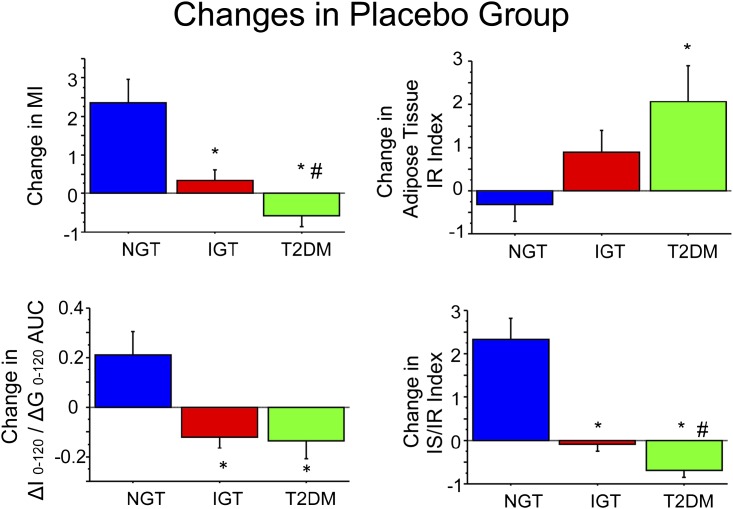
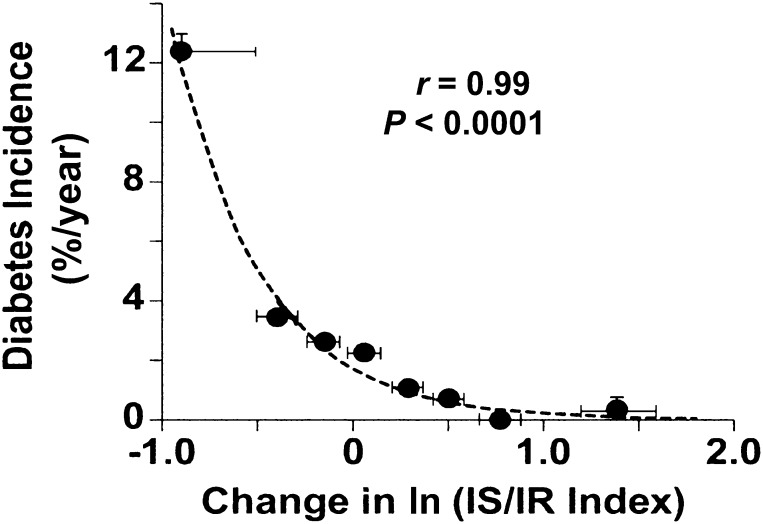
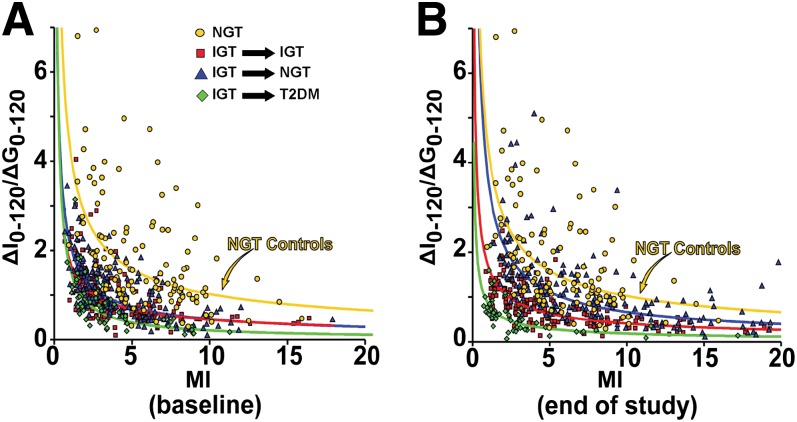
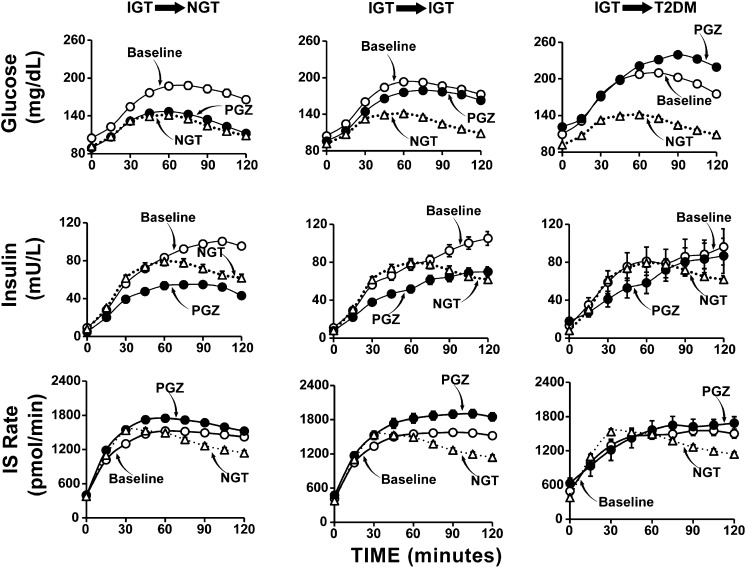
We examined the metabolic characteristics that attend the development of type 2 diabetes (T2DM) in 441 impaired glucose tolerance (IGT) subjects who participated in the ACT NOW Study and had complete end-of-study metabolic measurements. Subjects were randomized to receive pioglitazone (PGZ; 45 mg/day) or placebo and were observed for a median of 2.4 years. Indices of insulin sensitivity (Matsuda index [MI]), insulin secretion (IS)/insulin resistance (IR; ΔI0-120/ΔG0-120, ΔIS rate [ISR]0-120/ΔG0-120), and β-cell function (ΔI/ΔG × MI and ΔISR/ΔG × MI) were calculated from plasma glucose, insulin, and C-peptide concentrations during oral glucose tolerance tests at baseline and study end. Diabetes developed in 45 placebo-treated vs. 15 PGZ-treated subjects (odds ratio [OR] 0.28 [95% CI 0.15-0.49]; P < 0.0001); 48% of PGZ-treated subjects reverted to normal glucose tolerance (NGT) versus 28% of placebo-treated subjects (P < 0.005). Higher final glucose tolerance status (NGT > IGT > T2DM) was associated with improvements in insulin sensitivity (OR 0.61 [95% CI 0.54-0.80]), IS (OR 0.61 [95% CI 0.50-0.75]), and β-cell function (ln IS/IR index and ln ISR/IR index) (OR 0.26 [95% CI 0.19-0.37]; all P < 0.0001). Of the factors measured, improved β-cell function was most closely associated with final glucose tolerance status.
Figures
Comment in
-
How does pioglitazone prevent progression of impaired glucose tolerance to diabetes?Diabetes. 2013 Nov;62(11):3663-5. doi: 10.2337/db13-1175. Diabetes. 2013. PMID: 24158994 Free PMC article. No abstract available.
References
-
- Cowie CC, Rust KF, Byrd-Holt DD, et al. Prevalence of diabetes and impaired fasting glucose in adults in the U.S. population: National Health And Nutrition Examination Survey 1999-2002. Diabetes Care 2006;29:1263–1268 - PubMed
-
- Flegal KM, Carroll MD, Kit BK, Ogden CL. Prevalence of obesity and trends in the distribution of body mass index among US adults, 1999-2010. JAMA 2012;307:491–497 - PubMed
-
- Gerstein HC, Santaguida P, Raina P, et al. Annual incidence and relative risk of diabetes in people with various categories of dysglycemia: a systematic overview and meta-analysis of prospective studies. Diabetes Res Clin Pract 2007;78:305–312 - PubMed
-
- Gastaldelli A, Ferrannini E, Miyazaki Y, Matsuda M, DeFronzo RA, San Antonio metabolism study Beta-cell dysfunction and glucose intolerance: results from the San Antonio metabolism (SAM) study. Diabetologia 2004;47:31–39 - PubMed
-
- Ferrannini E, Gastaldelli A, Miyazaki Y, Matsuda M, Mari A, DeFronzo RA. beta-Cell function in subjects spanning the range from normal glucose tolerance to overt diabetes: a new analysis. J Clin Endocrinol Metab 2005;90:493–500 - PubMed
Publication types
MeSH terms
Substances
Grants and funding
LinkOut - more resources
Full Text Sources
Other Literature Sources
Medical
