. 2013 Dec;62(12):4030-42.
doi: 10.2337/db13-0627. Epub 2013 Jul 17.

Nitric oxide directly promotes vascular endothelial insulin transport

Affiliations

Nitric oxide directly promotes vascular endothelial insulin transport

Hong Wang et al. Diabetes. 2013 Dec.

Abstract

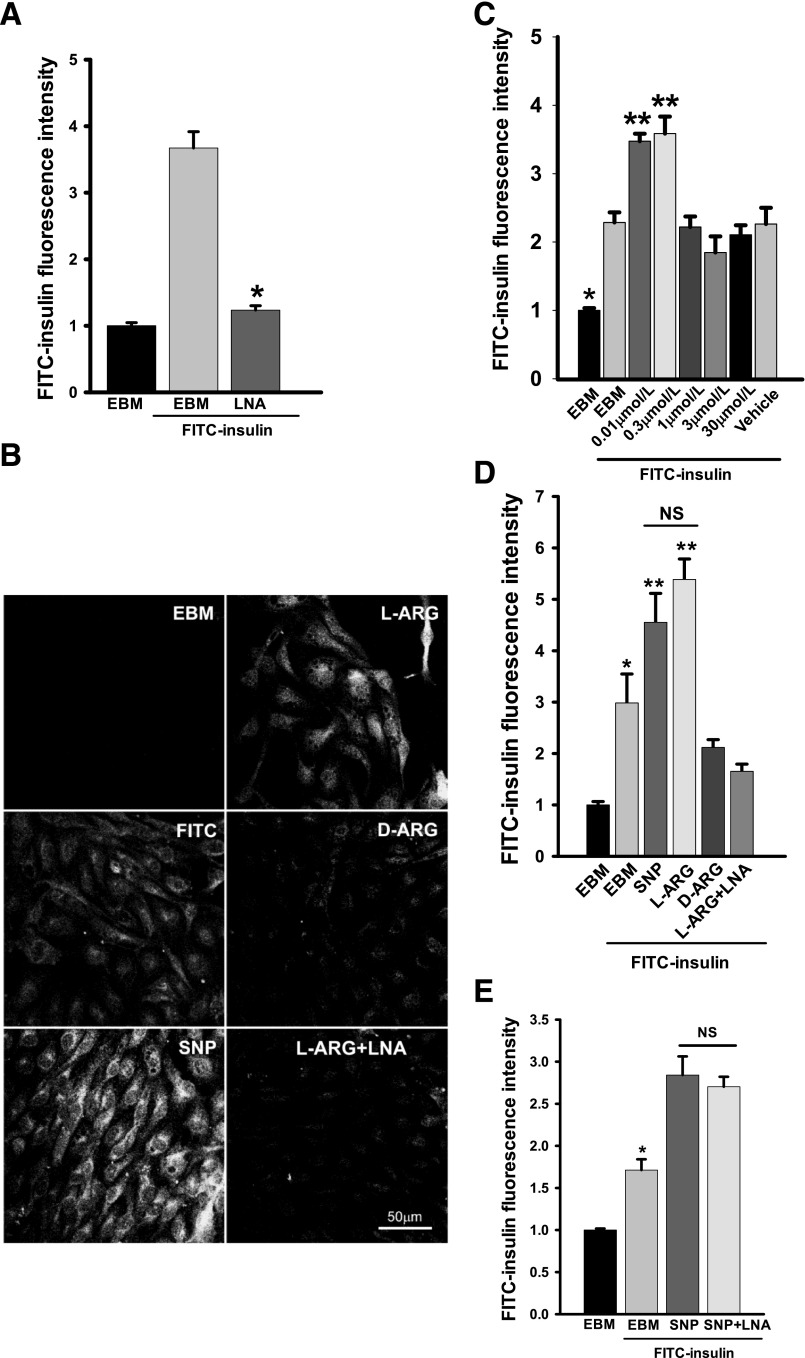
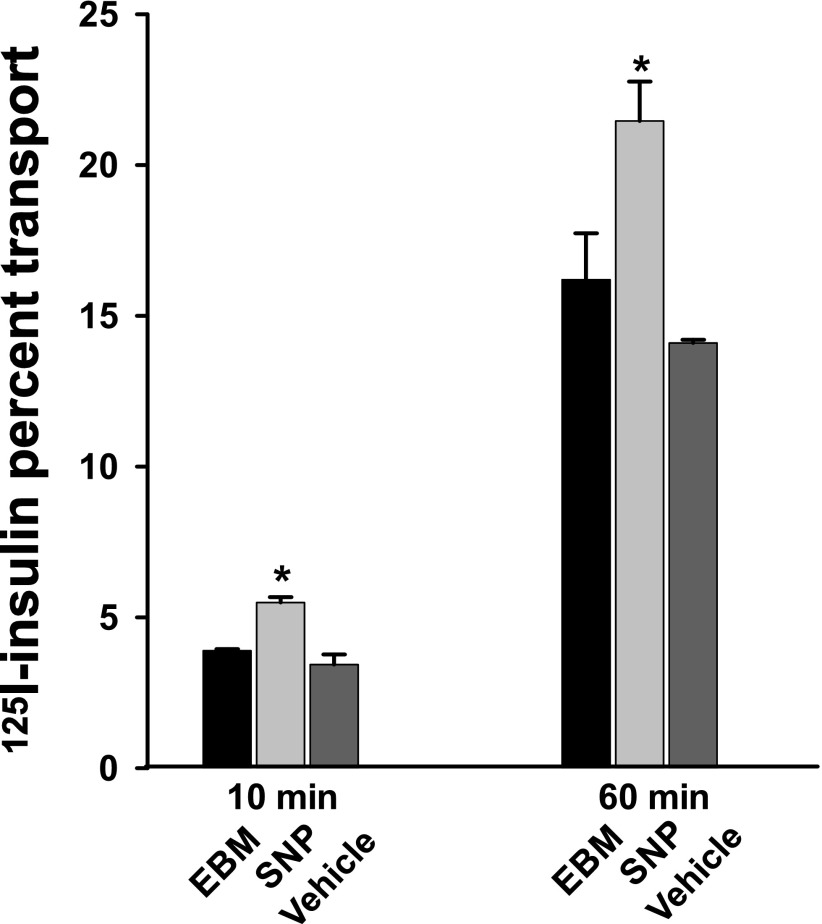
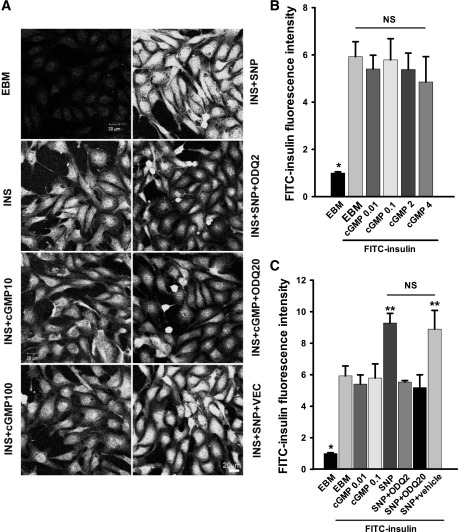
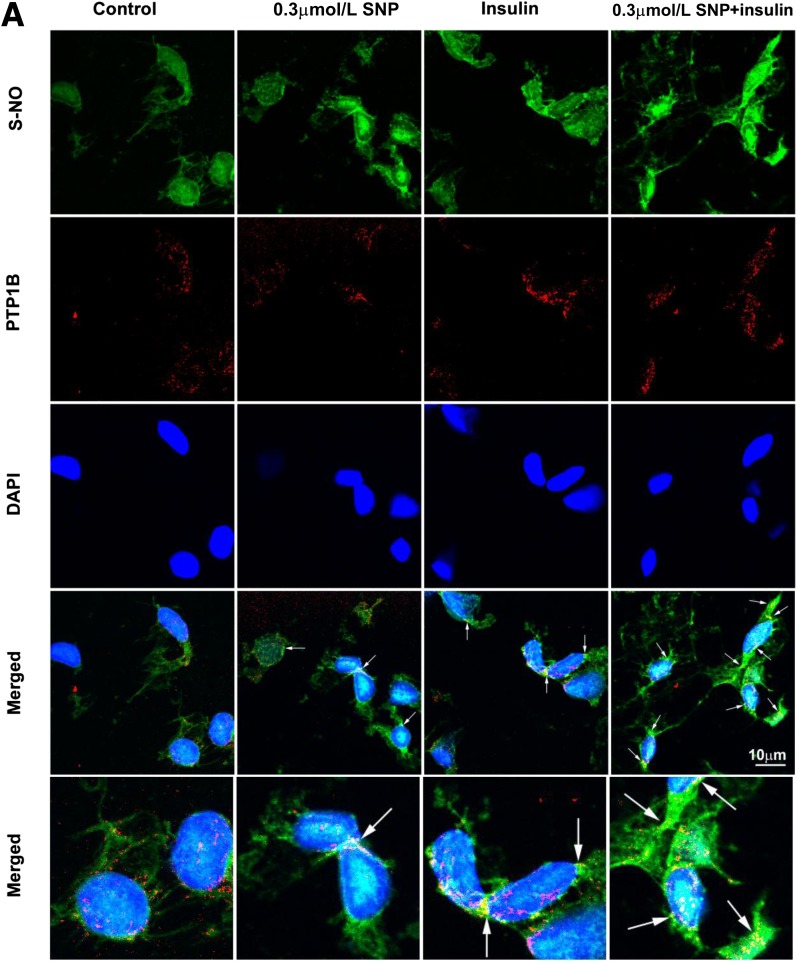
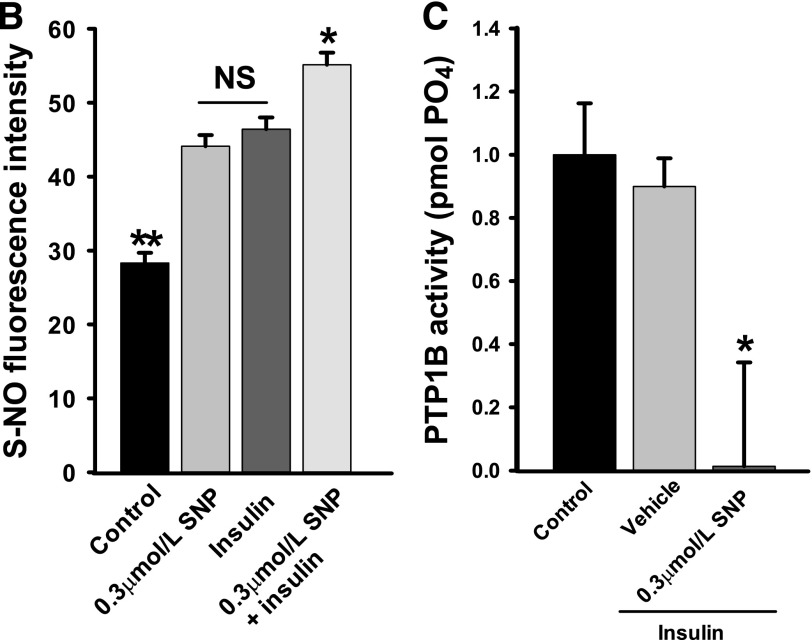
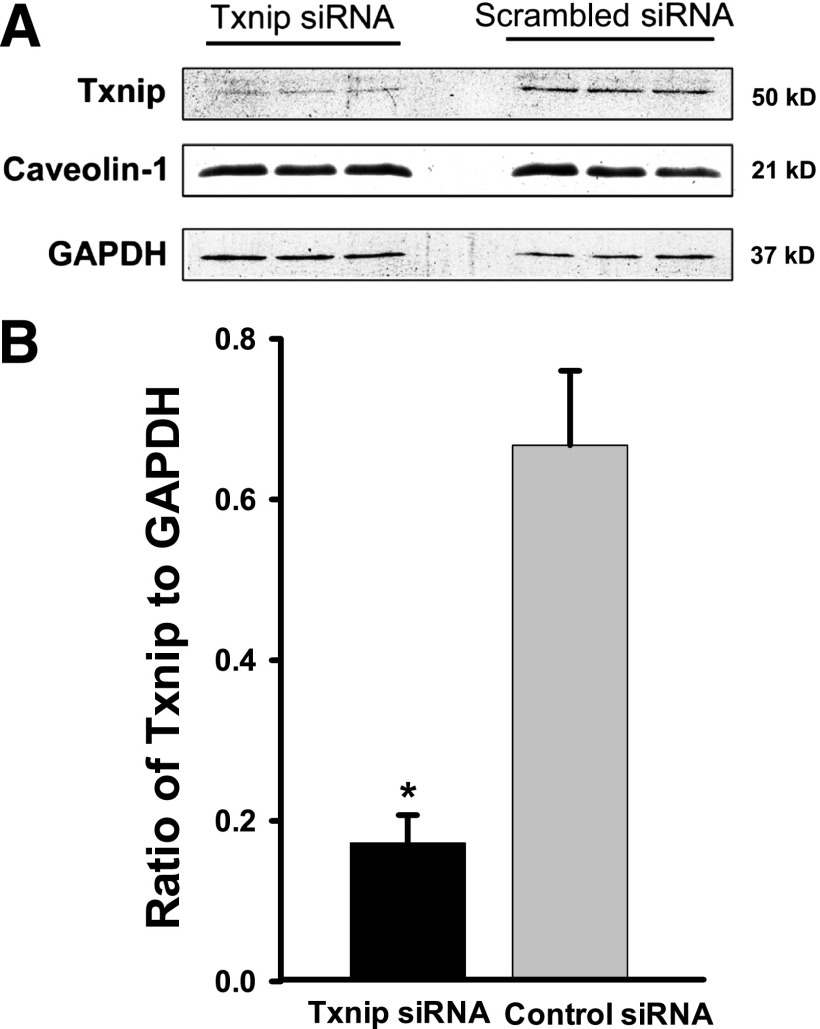
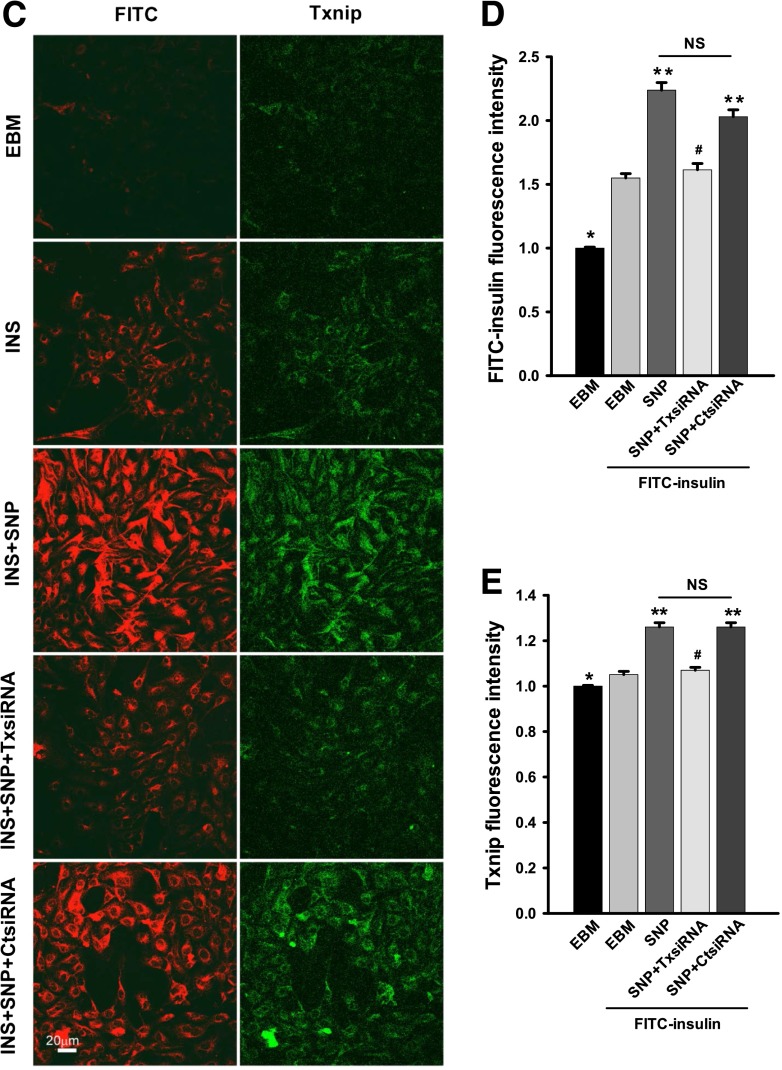
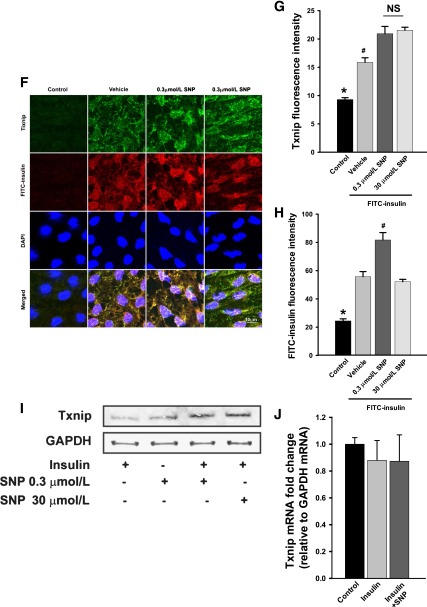
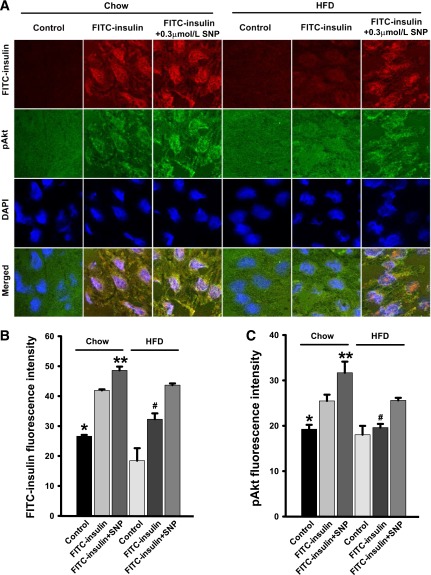
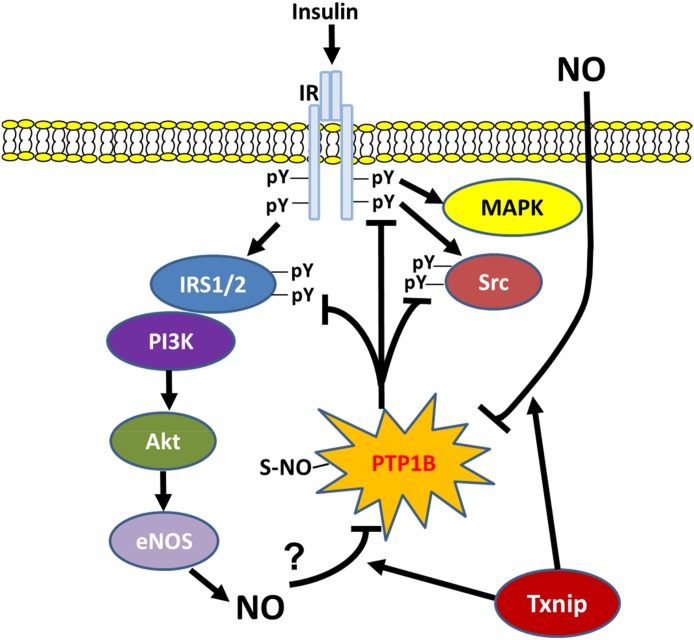
Insulin resistance strongly associates with decreased nitric oxide (NO) bioavailability and endothelial dysfunction. In the vasculature, NO mediates multiple processes that affect insulin delivery, including dilating both resistance and terminal arterioles in skeletal muscle in vivo. However, whether NO directly regulates vascular endothelial cell (EC) insulin uptake and its transendothelial transport (TET) is unknown. We report in this article that L-N(G)-nitro-L-arginine methyl ester (L-NAME) pretreatment blocked, whereas L-arginine and sodium nitroprusside (SNP) each enhanced, EC uptake of fluorescein isothiocyanate (FITC)-labeled insulin. SNP also partly or fully reversed the inhibition of EC insulin uptake caused by L-NAME, wortmannin, the Src inhibitor PP1, and tumor necrosis factor-α. In addition, SNP promoted [(125)I]Tyr(A14)insulin TET by ~40%. Treatment with insulin with and without SNP did not affect EC cyclic guanosine monophosphate (cGMP) levels, and the cGMP analog 8-bromo-cGMP did not affect FITC-insulin uptake. In contrast, treatment with insulin and SNP significantly increased EC protein S-nitrosylation, the colocalization of S-nitrosothiol (S-NO) and protein-tyrosine phosphatase 1B (PTP1B), and Akt phosphorylation at Ser(473) and inhibited PTP1B activity. Moreover, a high-fat diet significantly inhibited EC insulin-stimulated Akt phosphorylation and FITC-insulin uptake that was partially reversed by SNP in rats. Finally, inhibition of S-nitrosylation by knockdown of thioredoxin-interacting protein completely eliminated SNP-enhanced FITC-insulin uptake. We conclude that NO directly promotes EC insulin transport by enhancing protein S-nitrosylation. NO also inhibits PTP1B activity, thereby enhancing insulin signaling.


Figures

FIG. 1.
FIG. 1.
NO directly promotes EC FITC-insulin uptake. bAECs were serum starved for 6 h then pretreated with or without 0.5 mmol/L l-arginine (L-ARG) or 0.5 mmol/L d-arginine (D-ARG) ± 100 μmol/L l-NAME (LNA) for 30 min followed by 50 nmol/L FITC-insulin ± 0.3 μmol/L SNP or vehicle for 30 min before fixation and immunocytochemical staining. A: Effects of LNA on FITC-insulin uptake. *P < 0.05 compared with EBM + FITC-insulin but P > 0.05 compared with EBM (incubated in the basal medium without FITC-insulin). B: Representative confocal images of bAECs stained for FITC from three independent experiments. C: The histograms indicate the dose response of FITC-insulin uptake to SNP treatment. * and **P < 0.001 compared with all remaining groups. D: Quantification of the fluorescent intensity of FITC for each experimental condition indicated in the confocal images. *P < 0.05 compared with EBM group, P < 0.01 compared with SNP group, and P < 0.001 compared with L-ARG group, but P > 0.05 compared with D-ARG and L-ARG + LNA groups; **P < 0.001 compared with all remaining groups. E: Effects of LNA on SNP-stimulated increase of FITC-insulin uptake. *P < 0.01 compared with remaining groups.
FIG. 2.
FIG. 2.
SNP promotes insulin TET. 125I-insulin 200 pmol/L alone or in the presence of either 0.3 μmol/L SNP or vehicle was added into the top chamber of Transwell plates, and samples were removed from the bottom chamber at both 10 and 60 min for measurement of the amount of 125I-insulin transported. Percent transport of total added 125I-insulin at 60 min was calculated. *P < 0.05 compared with both the EBM group and vehicle control (n = 3).
FIG. 3.
FIG. 3.
Effects of SNP on FITC-insulin uptake by ECs pretreated with inhibitors of insulin action. bAECs were serum starved for 6 h then pretreated with either 100 nmol/L wortmannin (WOT) or 10 μmol/L PP1 for 30 min followed by 50 nmol/L FITC-insulin ± 0.3 μmol/L SNP or vehicle (VEC) for 30 min before fixation and immunocytochemical staining. A: Representative confocal images of bAECs stained for FITC from three independent experiments. B and C: Quantitative analysis of cellular insulin uptake for each experimental condition. #, *, and **P < 0.05 compared with remaining groups (B); * and #P < 0.05 compared with remain groups (C). D: Representative confocal images of bAECs that were serum starved ± 5 ng/mL TNF-α for 6 h followed by 50 nmol/L FITC-insulin ± 0.3 μmol/L SNP or VEC for 30 min before fixation and immunocytochemical staining from three independent experiments. E: Quantitative analysis of the cellular insulin uptake presented in D. * and #P < 0.05 compared with remaining groups and with each other.
FIG. 4.
FIG. 4.
Effects of cGMP analog and ODQ on insulin uptake. bAECs were serum starved for 6 h then pretreated with either 8-bromo-cGMP (0.01, 0.1, 2, or 4 mmol/L) for 5 min or ODQ (2 or 20 μmol/L or vehicle) for 15 min followed by FITC-insulin 50 nmol/L ± 0.3 μmol/L SNP for 30 min before fixation and immunocytochemical staining. A: Representative confocal images of bAECs stained for FITC from three independent experiments. B: The histograms indicate the dose response of FITC-insulin uptake to 8-bromo-cGMP treatment. *P < 0.01 compared with the remaining groups. C: Quantitative analysis of cellular insulin uptake for each experimental condition. * and **P < 0.05 compared with remaining groups. cGMP10, cGMP 0.01 mmol/L; cGMP100, cGMP 0.1 mmol/L; INS, insulin; ODQ2, ODQ 2 μmol/L; ODQ20, ODQ 20 μmol/L; VEC, vehicle.
FIG. 5.
FIG. 5.
Effects of insulin and/or SNP on EC general protein S-nitrosylation and specific PTP1B S-nitrosylation and activity. Freshly harvested rat aortic ECs were used for in situ detection of protein S-nitrosylation (S-NO) (green, revealed by fluorescein) combined with immunocytochemical staining for PTP1B (red, revealed by Cy3). A: Representative confocal images from single optical sections. Arrows point to the colocalization of S-NO and PTP1B. B: The histograms that quantify S-NO. * and **P < 0.001 compared with the remaining groups. C: PTP1B activity of the bAECs that were serum starved for 6 h followed by incubation with 0.3 μmol/L SNP or vehicle with 50 nmol/L insulin for 30 min before being immunoprecipitated with anti-PTP1B antibody and the tyrosine phosphatase activity measured in the immunoprecipitate. *P < 0.05 compared with either vehicle or control group. Results were the sum of three independent experiments, with triplicates for each experiment.
FIG. 5.
FIG. 5.
Effects of insulin and/or SNP on EC general protein S-nitrosylation and specific PTP1B S-nitrosylation and activity. Freshly harvested rat aortic ECs were used for in situ detection of protein S-nitrosylation (S-NO) (green, revealed by fluorescein) combined with immunocytochemical staining for PTP1B (red, revealed by Cy3). A: Representative confocal images from single optical sections. Arrows point to the colocalization of S-NO and PTP1B. B: The histograms that quantify S-NO. * and **P < 0.001 compared with the remaining groups. C: PTP1B activity of the bAECs that were serum starved for 6 h followed by incubation with 0.3 μmol/L SNP or vehicle with 50 nmol/L insulin for 30 min before being immunoprecipitated with anti-PTP1B antibody and the tyrosine phosphatase activity measured in the immunoprecipitate. *P < 0.05 compared with either vehicle or control group. Results were the sum of three independent experiments, with triplicates for each experiment.
FIG. 6.
FIG. 6.
Effects of knockdown of Txnip on insulin uptake. bAECs were transfected with either Txnip siRNA or scrambled control siRNA. Forty-eight hours after the transfection, cells were processed for Western blotting or serum starved for 6 h followed by incubation with or without 50 nmol/L FITC-insulin ± 0.3 μmol/L SNP for 30 min before they were fixed and doubly stained with anti-FITC (red, revealed by Cy3) and anti-Txnip (green, revealed by Cy2) primary antibodies. A: Representative Western blots. Caveolin-1 was used as a control to assess nonspecific off-target effects of siRNA silencing. GAPDH was used as a loading control. B: Mean values for the ratio of Txnip to GAPDH measured by Western blotting. *P < 0.01 compared with scrambled control. C: Representative confocal images from single optical sections. D and E: The histograms indicate the quantitation of FITC-insulin and Txnip fluorescence intensity, respectively, observed in three experiments. * and **P < 0.05 compared with remaining groups; #P > 0.05 compared EBM + FITC-insulin group (FITC-insulin treated without transfection of siRNA). FH: Fresh rat aortic ECs were transferred to poly-L-lysine-coated coverslips (see research design and methods for details). After 1 h stabilization, these cells were treated with either 0.3 μmol/L or 30 μmol/L SNP or vehicle for 30 min before fixation and underwent immunocytochemical staining for both Txnip (green, revealed by Cy2) and FITC (red, revealed by Cy3). F: Representative confocal images of single optical sections from three independent experiments. G and H: The histograms indicate the quantitation of Txnip and FITC-insulin, respectively. * and #P < 0.05 compared with remaining groups. I: bAECs were serum starved for 6 h followed by incubation with 0.3 μmol/L SNP, 50 nmol/L insulin, or 50 nmol/L insulin with or without SNP for 30 min before processed for Western blotting of Txnip. The representative blots from three independent experiments are shown. GAPDH was used as a loading control. J: bAECs were serum starved for 6 h followed by incubation with 50 nmol/L insulin with or without 0.3 μmol/L SNP for 30 min. Cells were then processed for real-time RT-PCR (n = 3); no statistical difference was found between treatments. CtsiRNA, control siRNA; INS, insulin; TxsiRNA, Txnip siRNA.
FIG. 6.
FIG. 6.
Effects of knockdown of Txnip on insulin uptake. bAECs were transfected with either Txnip siRNA or scrambled control siRNA. Forty-eight hours after the transfection, cells were processed for Western blotting or serum starved for 6 h followed by incubation with or without 50 nmol/L FITC-insulin ± 0.3 μmol/L SNP for 30 min before they were fixed and doubly stained with anti-FITC (red, revealed by Cy3) and anti-Txnip (green, revealed by Cy2) primary antibodies. A: Representative Western blots. Caveolin-1 was used as a control to assess nonspecific off-target effects of siRNA silencing. GAPDH was used as a loading control. B: Mean values for the ratio of Txnip to GAPDH measured by Western blotting. *P < 0.01 compared with scrambled control. C: Representative confocal images from single optical sections. D and E: The histograms indicate the quantitation of FITC-insulin and Txnip fluorescence intensity, respectively, observed in three experiments. * and **P < 0.05 compared with remaining groups; #P > 0.05 compared EBM + FITC-insulin group (FITC-insulin treated without transfection of siRNA). FH: Fresh rat aortic ECs were transferred to poly-L-lysine-coated coverslips (see research design and methods for details). After 1 h stabilization, these cells were treated with either 0.3 μmol/L or 30 μmol/L SNP or vehicle for 30 min before fixation and underwent immunocytochemical staining for both Txnip (green, revealed by Cy2) and FITC (red, revealed by Cy3). F: Representative confocal images of single optical sections from three independent experiments. G and H: The histograms indicate the quantitation of Txnip and FITC-insulin, respectively. * and #P < 0.05 compared with remaining groups. I: bAECs were serum starved for 6 h followed by incubation with 0.3 μmol/L SNP, 50 nmol/L insulin, or 50 nmol/L insulin with or without SNP for 30 min before processed for Western blotting of Txnip. The representative blots from three independent experiments are shown. GAPDH was used as a loading control. J: bAECs were serum starved for 6 h followed by incubation with 50 nmol/L insulin with or without 0.3 μmol/L SNP for 30 min. Cells were then processed for real-time RT-PCR (n = 3); no statistical difference was found between treatments. CtsiRNA, control siRNA; INS, insulin; TxsiRNA, Txnip siRNA.
FIG. 7.
FIG. 7.
Effects of SNP on FITC-insulin uptake and Akt phosphorylation at Ser473 in both chow and HFD-fed rats. Rat aortic ECs were transferred to coverslips and then treated with 50 nmol/L FITC-insulin with either 0.3 μmol/L SNP or vehicle for 30 min followed by immunocytochemical staining for phosphorylated Akt (pAkt) (green, revealed by Cy2) and FITC (red, revealed by Cy3). A: Representative confocal images of single optical sections. B and C: The histograms indicate the quantitation of FITC-insulin. B: *P > 0.05 compared with HFD control but P < 0.05 compared with remaining groups; # and **P < 0.05 compared with remaining groups and pAkt. C: * and #P < 0.05 compared with chow FITC-insulin, chow FITC-insulin + SNP, and HFD FITC-insulin + SNP groups; **P < 0.05 compared with remaining groups. n = 4 for each group.
FIG. 8.
FIG. 8.
Summary of the new mechanistic findings of the present study. NO stimulates S-nitrosylation of PTP1B, which decreases its enzymatic activity, thereby limiting the dephosphorylation of tyrosine residues on key insulin signaling proteins (IR, IRS1/2, and Src), which facilitates insulin TET (42). Txnip promotes NO-mediated S-nitrosylation of PTP1B through inhibition of denitrosylases, leading to the inhibition of PTP1B and activation of insulin signaling. pY, tyrosine phosphorylation.

Comment in

References

    1. Baron AD, Steinberg H, Brechtel G, Johnson A. Skeletal muscle blood flow independently modulates insulin-mediated glucose uptake. Am J Physiol 1994;266:E248–E253 - PubMed
    1. Vincent MA, Clerk LH, Lindner JR, et al. Microvascular recruitment is an early insulin effect that regulates skeletal muscle glucose uptake in vivo. Diabetes 2004;53:1418–1423 - PubMed
    1. King GL, Johnson SM. Receptor-mediated transport of insulin across endothelial cells. Science 1985;227:1583–1586 - PubMed
    1. Wang H, Liu Z, Li G, Barrett EJ. The vascular endothelial cell mediates insulin transport into skeletal muscle. Am J Physiol Endocrinol Metab 2006;291:E323–E332 - PubMed
    1. Yang YJ, Hope ID, Ader M, Bergman RN. Insulin transport across capillaries is rate limiting for insulin action in dogs. J Clin Invest 1989;84:1620–1628 - PMC - PubMed

Publication types

MeSH terms