. 2013 Sep;136(Pt 9):2888-903.
doi: 10.1093/brain/awt182. Epub 2013 Jul 17.

Non-myeloablative autologous haematopoietic stem cell transplantation expands regulatory cells and depletes IL-17 producing mucosal-associated invariant T cells in multiple sclerosis

Affiliations

Non-myeloablative autologous haematopoietic stem cell transplantation expands regulatory cells and depletes IL-17 producing mucosal-associated invariant T cells in multiple sclerosis

Sofia V Abrahamsson et al. Brain. 2013 Sep.

Abstract

Autologous haematopoietic stem cell transplantation has been tried as one experimental strategy for the treatment of patients with aggressive multiple sclerosis refractory to other immunotherapies. The procedure is aimed at ablating and repopulating the immune repertoire by sequentially mobilizing and harvesting haematopoietic stem cells, administering an immunosuppressive conditioning regimen, and re-infusing the autologous haematopoietic cell product. 'Non-myeloablative' conditioning regimens to achieve lymphocytic ablation without marrow suppression have been proposed to improve safety and tolerability. One trial with non-myeloablative autologous haematopoietic stem cell transplantation reported clinical improvement and inflammatory stabilization in treated patients with highly active multiple sclerosis. The aim of the present study was to understand the changes in the reconstituted immune repertoire bearing potential relevance to its mode of action. Peripheral blood was obtained from 12 patients with multiple sclerosis participating in the aforementioned trial and longitudinally followed for 2 years. We examined the phenotype and function of peripheral blood lymphocytes by cell surface or intracellular staining and multi-colour fluorescence activated cell sorting alone or in combination with proliferation assays. During immune reconstitution post-transplantation we observed significant though transient increases in the proportion of CD4+ FoxP3+ T cells and CD56(high) natural killer cell subsets, which are cell subsets associated with immunoregulatory function. CD8+ CD57+ cytotoxic T cells were persistently increased after therapy and were able to suppress CD4+ T cell proliferation with variable potency. In contrast, a CD161(high) proinflammatory CD8+ T cell subset was depleted at all time-points post-transplantation. Phenotypic characterization revealed that the CD161(high)CD8+ T cells were mucosal-associated invariant T cells, a novel cell population originating in the gut mucosa but expressing the central nervous system-homing receptor CCR6. Detection of mucosal-associated invariant T cells in post-mortem multiple sclerosis brain white matter active lesions confirmed their involvement in the disease pathology. Intracellular cytokine staining demonstrated interferon γ and interleukin 17 production and lack of interleukin 10 production, a pro-inflammatory profile. Mucosal-associated invariant T cell frequency did not change in patients treated with interferon β; and was more depleted after autologous haematopoietic stem cell transplantation than in patients who had received high-dose cyclophosphamide (n = 7) or alemtuzumab (n = 21) treatment alone, suggesting an additive or synergistic effect of the conditioning regime components. We propose that a favourably modified balance of regulatory and pro-inflammatory lymphocytes underlies the suppression of central nervous system inflammation in patients with multiple sclerosis following non-myeloablative autologous haematopoietic stem cell transplantation with a conditioning regimen consisting of cyclophosphamide and alemtuzumab.

Keywords: T cells; immune regulation; multiple sclerosis; proinflammatory cytokines; stem cells.


Figures
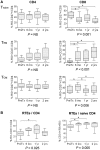
Figure 1
Figure 1
Moderate thymic reactivation during T cell reconstitution. The proportions of peripheral blood T cells in functional differentiation stages are shown at pretreatment baseline and at indicated time points post-AHSCT. (A) Reconstitution of naïve, effector memory (TEM), and central-memory (TCM) cell populations are expressed as the percentage of cells CD4+ versus CD8+ cells Statistical tests performed were repeated measures ANOVA (naïve CD4+ cells and all CD8+) and non-parametric ANOVA (CD4 TEM and TCM). (B) Reconstitution of recent thymic emigrant (RTEs) CD4+ cells. The proportions of recent thymic emigrants (CD31+CD45RO) in the total and in the naïve (CD45RA+CD45RO) CD4+ cell populations are increased after treatment. Statistical test performed was repeated measures-ANOVA. Pretreatment (PreTx) n = 11, 6 months (6 mo) n = 10, 1 year (1 yr) n = 10, 2 years (2 yrs) n = 7.
Figure 2
Figure 2
Post-therapy surge of lymphocytes with regulatory phenotype. A significant relative increase of cells with well-described immunoregulatory phenotypes in major lymphocyte populations (CD4+ cells and natural killer cells) was detected at 6 months post-treatment follow-up. (A) The figure shows the gating strategy and the percentages of FoxP3+CD127CD25high in the CD4+ T cell population. The cells were first gated on live CD25highCD4+CD3+ cells and then on the FoxP3+CD127 populations. The numbers in the dot plots indicate the percentages of FoxP3+CD127CD25high cells in the CD4+CD3+ population T cells. Pretreatment (PreTx) n = 6, 6 months (6 mo) n = 6, 1 year (1 yr) n = 5, 2 years (2 yrs) n = 1. (B) Percentage of CD56high natural killer cells. Pretreatment (PreTx) n = 11, 6 months (6 mo) n = 10, 1 year (1 yr) n = 10, 2 years (2 yrs) n = 5. Statistical test performed was non-parametric ANOVA.
Figure 3
Figure 3
CD161highCD8 are depleted following AHSCT and are MAITs. The CD161high cells represented on average ∼8% of the CD8+CD3+ cell population and were almost undetectable after the therapy with AHSCT. (A) Representative example of CD161 expression by CD8+CD3+ cells in one patient at pre-therapy and at indicated time-points after AHSCT. (B) The box plots represent the proportion of CD161high CD8+CD3+ cells at pretreatment and at indicated time points after AHSCT. Pretreatment (PreTx) n = 11, 6 months (6 mo) n = 9, 1 year (1 yr) n = 8, 2 years (2 yrs) n = 6. (C) Representative example of MAIT markers expressed by CD161highCD8+ cells show an almost exclusive usage of TCR Vα7.2 and expression of IL-18Rα, CCR6, and CD150. (D) Difference in T cell receptor beta variable (BV) gene expression of CD161highCD8+ cells with reference to the total CD8+ population [% BV (CD161highCD8 − all CD8 cells)] shows a preferential usage of Vβ2 and Vβ13.2 by CD161highCD8+ cells (red boxes, n = 7). The bars indicate the mean and standard deviation. Asterisks indicate significant P-values (<0.05, unpaired t-test). BV = T cell receptor beta variable (BV) gene.
Figure 4
Figure 4
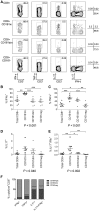
CD161highCD8+ cells are proinflammatory MAITs. Characterization of CD161highCD8+ cells in multiple sclerosis patients. (A) Representative example of cytokine production by CD8+CD3+ cells in function of CD161-expression. Peripheral blood mononuclear cells from patients before treatment were stimulated in culture with phorbol-12-myristate-13-acetate (PMA) and ionomycin after overnight recovery in cell incubator. The contour blots show the production of IFN-γ, TNF-α, and IL-17 by the total CD8+CD3+ populations, and by CD161high, CD161dim and CD161 CD8+ T cells. (B–E) The scatter plots show the percentage of cytokine producing cells in the total CD8+CD3+ population, and in CD161high, CD161dim and CD161 CD8+ T cells: (B) IFN-γ, (C) TNF-α, (D) IL-17, and (E) IL17+IFN-γ+ cells. (F) The distribution of CD161high, CD161dim and CD161neg in the total cytokine-producing population is shown, and expressed as a percentage of cytokine+CD8+ T cells (n = 7). Statistical tests performed were non-parametric ANOVA.
Figure 5
Figure 5
CD8+CD161+ and MAITs are present in perivascular infiltrates within chronic active lesions in the brain of patients with multiple sclerosis. (A) An example of CD8+ (green) and CD161+ (red) single and double positive cells (indicated by white arrows) within the inflammatory cellular infiltrates of chronic active white matter (WM) lesions in the brain of a patient with multiple sclerosis. (B and C) CD161+ (green) and TCRVα7.2+ (red) double positive MAITs are also found in white matter lesions inflammatory infiltrates. Blue (DAPI) stains all nuclei. All images were acquired at ×20 magnification except C at ×40. All scale bars = 20 µm. BV = blood vessel.
Figure 6
Figure 6
Effects of high-dose cyclophosphamide monotherapy and alemtuzumab monotherapy on MAIT frequency. MAITs defined by the expression of Vα7.2 and CD161 are reduced following AHSCT and reduced after monotherapy with high-dose cyclophosphamide (HiCy), and after alemtuzumab alone (Alem). (A) Representative dot plots gated on live CD3+CD8+ cells, showing expression of TCRVα7.2 on the x-axis and CD161 on the y-axis. (B) Frequencies of MAITs (Vα7.2+CD161high) in patients with multiple sclerosis before and after AHSCT. Note the segmented y-axis. Pretreatment (PreTx) n = 10, 6 months (6 mo) n = 9, 1 year (1 yr) n = 7, 2 years (2 yrs) n = 3. Statistical test was repeated measures-ANOVA. (C) Frequencies of MAITs in patients with multiple sclerosis before and after receiving high-dose cyclophosphamide. Patients with samples available at both time points are connected with a line. Note the segmented y-axis. Pretreatment (PreTx) n = 6, 2 years (2 yrs) n = 6. Statistical test performed was paired t-test. (D) Frequency of CD8+ MAITs in peripheral blood mononuclear cells of patients (n = 21) collected at different time points after their last infusion of alemtuzumab. The middle line represents the mean and the sideline the confidence interval (95% onfidsence interval). (E–G) Comparison of MAIT frequencies in patients receiving AHSCT (n = 11, range 6–24 months post-therapy) monotherapy with either high-dose cyclophosphamide (HiCy, n = 6, 24 months post-therapy) or alemtuzumab (Alem, n = 21, range 2–38 after last infusion).

References

    1. Adams JC. Biotin amplification of biotin and horseradish peroxidase signals in histochemical stains. J Histochem Cytochem. 1992;40:101457–63. - PubMed
    1. Alexander T, Thiel A, Rosen O, Massenkeil G, Sattler A, Kohler S, et al. Depletion of autoreactive immunologic memory followed by autologous hematopoietic stem cell transplantation in patients with refractory SLE induces long-term remission through de novo generation of a juvenile and tolerant immune system. Blood. 2009;113:1214–23. - PubMed
    1. Annibali V, Ristori G, Angelini DF, Serafini B, Mechelli R, Cannoni S, et al. CD161(high)CD8+T cells bear pathogenetic potential in multiple sclerosis. Brain. 2011;134(Pt):2542–54. - PubMed
    1. Autran B, Leblond V, Sadat-Sowti B, Lefranc E, Got P, Sutton L, et al. A soluble factor released by CD8+CD57+ lymphocytes from bone marrow transplanted patients inhibits cell-mediated cytolysis. Blood. 1991;77:102237–41. - PubMed
    1. Berer K, Mues M, Koutrolos M, Rasbi ZA, Boziki M, Johner C, et al. Commensal microbiota and myelin autoantigen cooperate to trigger autoimmune demyelination. Nature. 2011;479:7374538–41. - PubMed

Publication types

MeSH terms