

Human mobility patterns predict divergent epidemic dynamics among cities
- PMID: 23864593
- PMCID: PMC3730584
- DOI: 10.1098/rspb.2013.0763
Human mobility patterns predict divergent epidemic dynamics among cities
Abstract
The epidemic dynamics of infectious diseases vary among cities, but it is unclear how this is caused by patterns of infectious contact among individuals. Here, we ask whether systematic differences in human mobility patterns are sufficient to cause inter-city variation in epidemic dynamics for infectious diseases spread by casual contact between hosts. We analyse census data on the mobility patterns of every full-time worker in 48 Canadian cities, finding a power-law relationship between population size and the level of organization in mobility patterns, where in larger cities, a greater fraction of workers travel to work in a few focal locations. Similarly sized cities also vary in the level of organization in their mobility patterns, equivalent on average to the variation expected from a 2.64-fold change in population size. Systematic variation in mobility patterns is sufficient to cause significant differences among cities in infectious disease dynamics-even among cities of the same size-according to an individual-based model of airborne pathogen transmission parametrized with the mobility data. This suggests that differences among cities in host contact patterns are sufficient to drive differences in infectious disease dynamics and provides a framework for testing the effects of host mobility patterns in city-level disease data.
Keywords: commuting patterns; epidemic model; human mobility; infectious disease; power-law; transport model.
Figures


 , the mean number of workers per CT (triangles) and m*, the average number of workers in the same CT as a randomly chosen worker (circles), as a function of population size (N). The solid line shows
  , the fitted relationship between m* and N. The vertical distance between the dashed lines spans
  , where σ is the standard deviation of
  , showing the expected absolute difference in m* (on a log scale) between two cities of the same size. The width of the shaded polygon then shows what change in N would produce that difference according to
  . (b) Variance explained in each city by the configuration (squares) and radiation (diamonds) models of commuting flows.
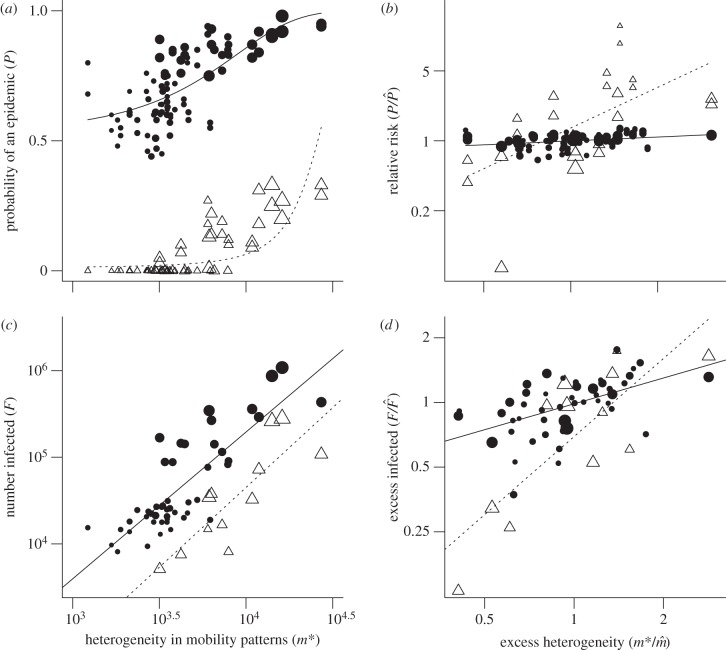
 is
is  . Lines show linear regression controlling for transmissibility. (c) Final number infected is positively correlated with the level of heterogeneity in mobility patterns. Lines show fits of linear regression on log-transformed variables; λ = 1 (triangles, dashed line), λ = 10 (circles, solid line). (d) This effect persists when the effects of population size on F and m* are removed.
References
-
- World Health Organization. 2008 Causes of death 2008 summary tables. Geneva, Switzerland: World Health Organization.
-
- World Health Organization. 2004 The global burden of disease: 2004 update. Geneva, Switzerland: World Health Organization.
-
- Bartlett M. 1956. Measles periodicity and community size. J. R. Stat. Soc. A 3, 493–510
-
- Grenfell B, Bjornstad O, Kappey J. 2001. Travelling waves and spatial hierarchies in measles epidemics. Nature 414, 716–723 (doi:10.1038/414716a) - DOI - PubMed
-
- Meyers LA, Pourbohloul B, Newman M, Skowronski D, Brunham R. 2005. Network theory and SARS: predicting outbreak diversity. J. Theor. Biol. 232, 71–81 (doi:10.1016/j.jtbi.2004.07.026) - DOI - PMC - PubMed
Publication types
MeSH terms
Grants and funding
LinkOut - more resources
Full Text Sources
Other Literature Sources
Medical
