. 2013 Jul 17;33(29):12105-21.
doi: 10.1523/JNEUROSCI.5369-12.2013.

Interleukin-1β alters glutamate transmission at purkinje cell synapses in a mouse model of multiple sclerosis

Affiliations

Interleukin-1β alters glutamate transmission at purkinje cell synapses in a mouse model of multiple sclerosis

Georgia Mandolesi et al. J Neurosci. .

Abstract

Cerebellar deficit contributes significantly to disability in multiple sclerosis (MS). Several clinical and experimental studies have investigated the pathophysiology of cerebellar dysfunction in this neuroinflammatory disorder, but the cellular and molecular mechanisms are still unclear. In experimental autoimmune encephalomyelitis (EAE), a mouse model of MS, proinflammatory cytokines, together with a degeneration of inhibitory neurons, contribute to impair GABAergic transmission at Purkinje cells (PCs). Here, we investigated glutamatergic transmission to gain insight into the pathophysiology of cerebellar dysfunction in EAE. Electrophysiological recordings from PCs showed increased duration of spontaneous excitatory postsynaptic currents (EPSCs) during the symptomatic phase of EAE, suggesting an alteration of glutamate uptake played by Bergmann glia. We indeed observed an impaired functioning of the glutamate-aspartate transporter/excitatory amino acid transporter 1 (GLAST/EAAT1) in EAE cerebellum caused by protein downregulation and in correlation with prominent astroglia activation. We have also demonstrated that the proinflammatory cytokine interleukin-1β (IL-1β), released by a subset of activated microglia/macrophages and infiltrating lymphocytes, was involved directly in such synaptic alteration. In fact, brief incubation of IL-1β in normal cerebellar slices replicated EAE modifications through a rapid GLAST/EAAT1 downregulation, whereas incubation of an IL-1 receptor antagonist (IL-1ra) in EAE slices reduced spontaneous EPSC alterations. Finally, EAE mice treated with intracerebroventricular IL-1ra showed normal glutamatergic and GABAergic transmissions, along with GLAST/EAAT1 normalization, milder inflammation, and reduced motor deficits. These results highlight the crucial role played by the proinflammatory IL-1β in triggering molecular and synaptic events involved in neurodegenerative processes that characterize neuroinflammatory diseases such as MS.


Figures

Figure 1.
Figure 1.
The duration of spontaneous glutamatergic transmission is increased in the cerebellum of EAE mice. Whole-cell patch-clamp recordings from PCs show a slower decay phase (A) and half-width (B) of the sEPSCs in EAE symptomatic mice (21–25 dpi; score ≥2) relative to CFA (p < 0.001) and presymptomaptic (p < 0.05) mice, whereas the rise time was not significantly different (C). The kinetics of glutamate-mediated sEPSCs was normal in the presymptomatic phase (7–9 dpi) of EAE (p > 0.05 versus CFA). D, Electrophysiological traces are examples of sEPSCs recorded from PCs in control conditions (CFA) and in symptomatic EAE. Data are presented as means ± SEM. *p < 0.05, ***p < 0.001, one-way ANOVA.
Figure 2.
Figure 2.
Astrogliosis and downregulation of GLAST/EAAT1 in EAE cerebellum. A, B′, Confocal images of GFAP immunostaining (red) of cerebellar sagittal slices show morphological changes typical of activated astroglia in EAE mice (B; 21–25 dpi; score ≥2) relative to CFA control mice (A). BrdU-positive nuclei (B,B′, green) were evident all over the cerebellar cortex (ML, GL, Purkinje cell layer [PCl]) of EAE mice but not in CFA mice (A, green), indicating a prominent cellular proliferation in the symptomatic mice. (B′), High magnification of the double fluorescence staining shows BrdU-positive nuclei surrounded by GFAP labeling (arrowheads), indicating a strong astroglia proliferation in EAE cerebellum. Immunofluorescence analysis of GLAST/EAAT1 expression in CFA (C,D′′) and EAE (E,F′′) cerebella. To distinguish the cerebellar layers we stained calbindin (Calb) to visualize PCl and ML (green), and DAPI+ cell nuclei (gray) in the GL. A specific labeling of the anti-GLAST antibody (red) characterizes the ML of both CFA (C′,D, high magnification) and EAE cerebellar slices (E′,F, high magnification), reflecting localization of the protein in the processes associated closely with PC spines and dendrites (Calb, green; D′,D′′,F′,F′′). GLAST/EAAT1 expression was less prominent in the ML of EAE symptomatic mice (E′,F). G, G′′, WB analysis of the expression level of GFAP and of GLAST/EAAT1. The quantitative analysis reported in the graph shows an ∼2-fold upregulation of GFAP in EAE cerebellar extract relative to CFA control mice (G,G′). On the contrary, GLAST/EAAT1 was less abundant in EAE compared with CFA (G,G′). Quantification of GLAST/EAAT1 relative to GFAP protein levels emphasizes the differences between CFA and EAE cerebella (G,G′′). Data are presented as means ± SEM and are normalized to the CFA group. Scale bars, 50 μm in A,B,C,C′,E,E′; 10 μm in B′,D,D′′,F,F′′. *p < 0.05, **p < 0.01, unpaired t test.
Figure 3.
Figure 3.
The GLAST/EAAT1 inhibitor TBOA affects sEPSCs in normal cerebellar slices but not in EAE. A, Bath application of TBOA (10 min) in cerebellar slices of normal mice significantly increased the decay time and half-width of PC sEPSCs, as expected. In EAE symptomatic mice (21–25 dpi; score ≥2), the effect was completely abolished, suggesting a compromised glutamate uptake dependent on GLAST/EAAT1. B, Examples of electrophysiological traces (sEPSCs) recorded from PCs of CFA mice before and after TBOA application. Data are presented as the means ± SEM; *p < 0.05, paired t test.
Figure 4.
Figure 4.
IL-1β affects cerebellar glutamatergic transmission by inhibiting GLAST/EAAT1 expression. A, B, Graphs showing that TNFα incubation (2 h) of control cerebellar slices did not affect sEPSC duration (A); conversely, application of IL-1β (10 min) in control slices enhanced decay time and half-width of sEPSCs (B), mimicking the synaptic alterations obtained in symptomatic EAE mice. C, The protein level of GLAST/EAAT1 was quantified by WB analysis in cerebellar slices after IL-1β incubation (10 min) and in control conditions (ACSF). The treatment induced a significant reduction of GLAST/EAAT1 expression. WB data were normalized to β-actin. D, E, Graphs showing that incubation of IL-1ra was able to rescue the EAE-mediated effect on sEPSCs. D, Left: Decay time was faster in EAE-IL-1ra slices compared with EAE-untreated slices (p < 0.01) and indistinguishable from CFA-IL-1ra slices. D, Right: The half-width was also faster but did not recover completely (p > 0.05 vs EAE and CFA-IL-1ra). Dotted lines represent the mean values obtained in CFA-untreated slices. E, Examples of sEPSC events recorded from PCs in symptomatic EAE slices, after IL-1ra incubation in EAE slices and in control conditions (CFA-IL-1ra). Data are presented as means ± SEM. Unpaired t test in A and paired t test in B, C; one-way ANOVA in D: *p < 0.05, **p < 0.01, ***p < 0.001.
Figure 5.
Figure 5.
Quantification of IL-1β expression in EAE cerebellum and its expression in microglia/macrophage. A, Quantification of both mRNA and protein of IL-1β at the symptomatic phase of the disease. Left: Upregulation of IL-1β mRNA in EAE versus CFA cerebella. A quantitative real-time PCR was performed using actin as internal control. Right: Upregulation of IL-1β expression in EAE cerebellar extract relative to CFA control mice evaluated by ELISA assay. BE, Double immunostaining of cerebellar sagittal sections showing expression of IL-1β (red) in Iba1-positive microglia/macrophage cells (green) that are activated in EAE mice (B,B′′,D,D′′, 21 dpi; score ≥2), but not in CFA mice (C,E). B,B′′, In the WM and GL of EAE, a colocalization between the two makers (B′, merge image: IL-1β-Iba1) is evident. B′′ is an high magnification of the white box in B′. D, E, In the ML, activated microglial cells seem not to express detectable levels of IL-1β (D,D′′). D′′ is an high magnification of the white box in D′. These results show that IL-1β is expressed by subsets of microglia/macrophages populations of cells. Arrowheads in B′ and D′ show IL-1β-positive cells that are Iba1-negative and are likely lymphocytes (Fig. 7). Data are presented as the means ± SEM; unpaired t test in A: *p < 0.05, **p < 0.01. Scale bars in B,B′,C,D,D′,E: 25 μm; in B′′,D′′: 10 μm.
Figure 6.
Figure 6.
IL-1β is not detectable in activated astroglia in EAE cerebellum. Double immunostaining of cerebellar sagittal sections showing absence of colocalization signal between IL-1β (A,A′,C,C′, red) and GFAP (A′,C′, green), which is highly expressed by activated astroglia in the WM, GL (A,A′) and ML (C,C′) of EAE cerebellum (21 dpi; score ≥2) compared with CFA mice (B,B′,D,D′). Arrowheads in C, C′ show IL-1β-positive cells in the ML that are likely lymphocytes (Fig. 7). Scale bars, 25 μm.
Figure 7.
Figure 7.
IL-1β is highly expressed in CD3+ lymphocytes infiltrating EAE cerebellum. Double immunostaining of cerebellar sagittal sections showing in the WM/GL (A,A′′′, in gray DAPI nuclei) and ML (C,C′′) of EAE mice (21 dpi; score ≥2) a strong colocalization signal (A′′,A′′′ in WM/GL and C′′ in ML) between IL-1β (red, A in WM/GL and C in ML) and CD3+ infiltrating lymphocytes. D, High magnification of the white boxes in C,C′-C″ showing CD3+ lymphocytes as substantial source of IL-1β (C, arrowheads) in the ML of EAE cerebellum. No signal was present in CFA cerebellum except for DAPI staining of the cell nuclei (B,B′ GL and ML not shown). Scale bars in AC′′: 25 μm; in D: 10 μm.
Figure 8.
Figure 8.
Incubation of EAE-CD3+ lymphocytes on normal slices reproduces the IL-1β synaptic defects observed in EAE mice. A, Protein quantification by ELISA assay of IL-1β released by CD3+ lymphocytes isolated from the spleens of EAE (EAE-CD3+) and CFA (CFA-CD3+) mice. Histogram shows an upregulation of IL-1β released by EAE-lymphocytes (24 h) relative to the protein released by CFA lymphocytes. B, The diagram on the left is a schematic representation of the experimental procedure; cerebellar slices from normal mice were incubated for 1 h with CFA-CD3+ or EAE-CD3+ lymphocytes by layering them on the top of the slices. After the incubation, electrophysiological recordings were performed (insets represent examples of sEPSCs). Circles represent CD3+ lymphocytes from CFA (white) or EAE (gray) mice and EAE-CD3+ lymphocytes in the presence of the IL-1ra (black circle). Graphs on the right show a slower decay time and half-width of PC sEPSCs in control slices incubated with EAE-CD3+ compared with CFA-CD3+ control conditions. EAE lymphocytes failed to affect sEPSCs after the blockade of IL-1β, suggesting that these inflammatory cells induce changes of glutamate transmission in EAE cerebellum through IL-1β signaling. Data are presented as the means ± SEM; unpaired t test in A; one-way ANOVA in B: **p < 0.01, ***p < 0.001.
Figure 9.
Figure 9.
Clinical course in EAE mice receiving IL-1ra or vehicle by intracerebroventricular delivery. A, Time course of EAE clinical score (mean ± SEM) in mice treated with IL-1ra (n = 17, black) or vehicle (n = 16, gray) until the acute phase of the disease. The severity of EAE was milder in EAE-IL-1ra-treated mice compared with EAE-vehicle-treated mice (19–22 dpi, Mann–Whitney test, *p < 0.05). B, Survival curve for disease onset in EAE mice preventively treated with intracerebroventricular IL-1ra (black line) or vehicle (gray line). The incidence of mice with a score of zero was higher in EAE-Il-1ra-treated mice relative to vehicle mice, although it did not reach a significant difference (p = 0.10, log-rank test), suggesting a protective effect of IL-1ra delivered by intracerebroventricular infusion.
Figure 10.
Figure 10.
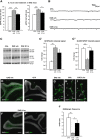
In vivo modulation of IL-1β signaling prevents the synaptic, molecular, and inflammatory events mediated by EAE. A, Histograms showing that pharmacological inhibition of IL-1β signaling by means of IL-1ra icv treatment prevented the effect of EAE on glutamatergic sEPSC kinetic properties. B, Examples of electrophysiological traces (sEPSCs) recorded from PCs in the different experimental conditions. C, C′′, WB analysis of the expression levels of GFAP and GLAST/EAAT1 in the cerebella of CFA-vehicle, EAE-vehicle, and EAE IL-1ra mice. The quantitative analysis reported in the graph shows a mild reduction of GFAP in EAE IL-1ra cerebellar extract (C, C′, normalized to actin) but a significant recovery of GLAST/EAAT1 (C′′, normalized to GFAP) relative to EAE mice (C′′). DI, Double immunostaining of cerebellar sagittal sections showing expression of Iba1-positive microglia/macrophage cells (green) and DAPI staining of the cell nuclei. In EAE IL-1ra slices (F,F′) microglia proliferation was less prominent (F) compared with EAE mice (D) and occasionally almost absent (F′), similar to CFA (E). GI, Images showing the morphology of Iba-1-positive cells, which in EAE IL-1ra (I) resembled that of control mice (H). J, Whole-cell patch-clamp recordings from PCs show a slower frequency of the spontaneous GABAergic transmission (sIPSCs) in EAE mice relative to CFA mice. The strong reduction of the frequency was efficiently recovered in EAE-IL1ra mice. Data are presented as the means ± SEM; one-way ANOVA: *p < 0.05, **p < 0.01, ***p < 0.001. Scale bars in DF′: 200 μm; in GI: 10 μm.

Comment in

References

    1. Aktas O, Zipp F. Regulation of self-reactive T cells by human immunoglobulins–implications for multiple sclerosis therapy. Curr Pharm Des. 2003;9:245–256. doi: 10.2174/1381612033392152. - DOI - PubMed
    1. Badovinac V, Mostarica-Stojković M, Dinarello CA, Stosić-Grujicić S. Interleukin-1 receptor antagonist suppresses experimental autoimmune encephalomyelitis (EAE) in rats by influencing the activation and proliferation of encephalitogenic cells. J Neuroimmunol. 1998;85:87–95. doi: 10.1016/S0165-5728(98)00020-4. - DOI - PubMed
    1. Baranzini SE, Elfstrom C, Chang SY, Butunoi C, Murray R, Higuchi R, Oksenberg JR. Transcriptional analysis of multiple sclerosis brain lesions reveals a complex pattern of cytokine expression. J Immunol. 2000;165:6576–6582. - PubMed
    1. Barbour B, Keller BU, Llano I, Marty A. Prolonged presence of glutamate during excitatory synaptic transmission to cerebellar Purkinje cells. Neuron. 1994;12:1331–1343. doi: 10.1016/0896-6273(94)90448-0. - DOI - PubMed
    1. Bauer J, Berkenbosch F, Van Dam AM, Dijkstra CD. Demonstration of interleukin-1 beta in Lewis rat brain during experimental allergic encephalomyelitis by immunocytochemistry at the light and ultrastructural level. J Neuroimmunol. 1993;48:13–21. doi: 10.1016/0165-5728(93)90053-2. - DOI - PubMed

Publication types

MeSH terms

LinkOut - more resources