. 2013 Sep;24(17):2703-13.
doi: 10.1091/mbc.E12-12-0895. Epub 2013 Jul 17.

Plasma membrane domains enriched in cortical endoplasmic reticulum function as membrane protein trafficking hubs

Affiliations

Plasma membrane domains enriched in cortical endoplasmic reticulum function as membrane protein trafficking hubs

Philip D Fox et al. Mol Biol Cell. 2013 Sep.

Abstract

In mammalian cells, the cortical endoplasmic reticulum (cER) is a network of tubules and cisterns that lie in close apposition to the plasma membrane (PM). We provide evidence that PM domains enriched in underlying cER function as trafficking hubs for insertion and removal of PM proteins in HEK 293 cells. By simultaneously visualizing cER and various transmembrane protein cargoes with total internal reflectance fluorescence microscopy, we demonstrate that the majority of exocytotic delivery events for a recycled membrane protein or for a membrane protein being delivered to the PM for the first time occur at regions enriched in cER. Likewise, we observed recurring clathrin clusters and functional endocytosis of PM proteins preferentially at the cER-enriched regions. Thus the cER network serves to organize the molecular machinery for both insertion and removal of cell surface proteins, highlighting a novel role for these unique cellular microdomains in membrane trafficking.


Figures

FIGURE 1:
FIGURE 1:
Kv2.1 cell surface clusters colocalize with the ER at the cell surface. (A) Confocal-based detection of Kv2.1-ER colocalization. Shown is a single confocal plane through the middle of a HEK cell transfected with Kv2.1HA. The ER was stained with ER-Tracker Green, and the red shows Alexa Fluor 594–conjugated anti-HA labeling of live cells to detect only surface Kv2.1 channels. (B) Enlargement of the boxed region in (A), illustrating the association of the Kv2.1 surface clusters (arrows) with cER finger-like projections. (C–E) TIRF-based detection of Kv2.1-cER colocalization. HEK cells were transfected with GFP-Kv2.1 and DsRed2-ER, and the corresponding fluorescence patterns are illustrated in (C) and (D), respectively. (F) Pixels containing both fluorescence signals. The thresholded Pearson's correlation coefficient for the cell in (C–F) was 0.61. For eight similar cells examined in TIRF, the correlation coefficient was 0.71 ± 0.07 (mean ± SD).
FIGURE 2:
FIGURE 2:
TfR exocytosis occurs at cER-enriched domains. (A) Time course of a single TfR-SEP exocytic event. Shown are TIRF images acquired over the indicated time series. (B) Localization of TfR-SEP exocytotic sites. Left panel, a TIRF image with the TfR-SEP localized to both the cER-associated puncta and the general PM. To enhance the signal-to-noise ratio of delivered TfR-SEP, we first bleached the basal membrane with high-power TIR illumination to reduce both the puncta intensity and, most importantly, the general membrane fluorescence derived from freely diffusing TfR-SEP molecules. The next three panels show single, bright puncta (yellow arrows) representing trafficking vesicles arriving post-bleach. Right panel, summary of the location of the delivery events observed up until the general membrane fluorescence became too bright to detect additional delivery. Sites of exocytosis are marked by the yellow circles.
FIGURE 3:
FIGURE 3:
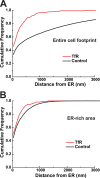
Euclidean distance mapping analysis of the sites of TfR exocytosis relative to the cER perimeter. Cumulative distribution functions (CDFs) comparing the distance of TfR exocytic sites from the cER (red) with the control case (black). Distances from the cER were determined by EDMs generated from images of the cER. (A) Summary data obtained using the entire TIRF footprint as determined from the low-level TfR fluorescence. The curve for the TfR plots the cumulative individual distances between the ER and exocytic locations. The control curve summarizes the distance to the ER for all the pixels present. The mean distance from the ER for TfR delivery was 0.25 ± 0.38 μm (mean ± SD, n = 131, from 5 cells), while the distance for the control pixels was 1.5 ± 2.6 μm, p < 0.0001. (B) Results derived from the region of the cell footprints highly enriched in cER. The mean distance from the cER for TfR delivery was 0.17 ± 0.24 μm (n = 114, from 5 cells), while the distance for the control pixels averaged 0.25 ± 0.33 μm (n = 1.1 × 107 pixels), p < 0.05, assuming equal variance. The image crop forces the two curves together because now all pixels are relatively close to the ER.
FIGURE 4:
FIGURE 4:
TfR and clathrin puncta localize adjacent to cER-enriched domains. (A) HEK cells were transfected with TfR-SEP and DsRed2-ER and then imaged using TIRF optics. The green TfR puncta are most often seen adjacent to, but not overlapping with, the cER marker. (B) Enlargement of the boxed region in (A). (C) TfR puncta present at two time points 46 s apart. Puncta present at 0 time are cyan, while those visible 46 s later are in yellow. The arrows point to puncta that either did not change or diffused a short distance (white). However, most puncta disappeared only to reform nearby over the 46 s. (D) HEK cells were transfected with GFP-CLC and DsRed2-ER prior to TIRF imaging. (E) Enlargement of the boxed region in (D). (F) CLC puncta detected 46 s apart, as described for (C).
FIGURE 5:
FIGURE 5:
TfR-SEP and GFP-CLC puncta colocalize. (A and B) TIRF fluorescence pattern following transfection with TfR-SEP and RFP-CLC, respectively. (C) Traditional overlay of the TfR and CLC fluorescent signals. (D) Pixels containing only both fluorescence signals. (E) Ratio of TfR-SEP and RFP-CLC fluorescence of the puncta contained within the boxed region of (D).
FIGURE 6:
FIGURE 6:
Exocytosis of VSVG-ts045 occurs predominantly at the cER perimeter. (A) HEK cell transfected with YFP-VSVG-ts045 and DsRed2-ER and imaged via TRIF microscopy at the permissive temperature (32°C). Blue dots mark exocytic events that occurred ≤0.3 μm from the cER perimeter, and yellow dots mark events that occurred >0.3 μm from the cER perimeter. Of 52 exocytic events recorded in this cell, 46 of them occurred within 0.3 μm of the cER perimeter; only the first 33 events are illustrated in (A) and (B). (B) Summary of the location of YFP-VSVG-ts045 vesicle fusion over time. Same cell as in (A). Overall 84 ± 12% of exocytic events (n = 213, from 7 cells) occurred within 0.3 μm of the cER perimeter. The cER perimeter (0.3 μm) in these cells was 28 ± 8% of the area of the TIRF footprint. (C) Magnification of DsRed2-ER fluorescence from (A) overlaid with a track of vesicular movement (yellow line). Appearance of the vesicle at the PM is marked with a blue dot, and exocytosis within 0.3 μm of the cER perimeter is marked with a red +.
FIGURE 7:
FIGURE 7:
Exo- and endocytosis of Kv1.4. HEK cells expressing biotinylated Kv1.4 were labeled at low efficiency with 605 Qdots and then imaged via TIRF microscopy for observation of delivery and retrieval at the cell surface. (A) The location where the Qdot first appears is marked by the yellow circle, and its disappearance is marked with the red X. Note that the appearing Qdot in the top center of (A) most likely diffused into the TIR field from the side of the cell, as it was first detected at the edge of the cell. Trajectories from 292 frames are shown, and the length of the track is representative of the amount of time each Qdot was present during the movie. (B and C) Enlargements of the top and bottom boxed regions in (A), respectively. Kv1.4 exocytosis preferred PM sites within 0.15 μm of the cER perimeter with 78 ± 3% (n = 176 events, four cells) of Qdots spontaneously appearing in these regions. Kv1.4 endocytosis also preferred these regions with 77 ± 3% (n = 176 events, four cells) of Qdots spontaneously disappearing adjacent to the cER. In these cells, the cER perimeter (0.15 μm) accounted for only 21 ± 4% of the cell footprint.
FIGURE 8:
FIGURE 8:
Thin-section EM of cER in HEK cells. (A) EM micrograph of an ultrathin section (<100 nm) through the basal membrane (B) of the cell. Within 200 nm of the ER (ER) on the right, there are four vesicular structures (V), which are likely docked at the PM. (B) EM micrograph illustrates ER making a small contact point (black arrow) with the PM (PM) in this section. Endocytic structures (white arrows) and possible vesicular structures are within 200 nm of the ER–PM contact point. (C) This EM micrograph illustrates a typical region of cER. Here the ER runs parallel to the PM but at a distance >100 nm from the PM. The ER turns to make perpendicular contacts with PM (black arrows). (D) This micrograph illustrates a similar situation as in (C), with the ER running parallel to and making contacts with the PM. Microtubules (MT) run underneath the cER at a distance far out of the TIRF field. All micrographs were acquired at 100,000× magnification. All scale bars are 200 nm. (B = basal membrane; V = vesicular structure; PM = cross-sectioned PM; MT = microtubules; T = transverse-sectioned PM; black arrows = ER–PM contacts; white arrows = endocytic structures).

References

    1. Antonucci DE, Lim ST, Vassanelli S, Trimmer JS. Dynamic localization and clustering of dendritic Kv2.1 voltage-dependent potassium channels in developing hippocampal neurons. Neuroscience. 2001;108:69–81. - PubMed
    1. Barlow AL, Macleod A, Noppen S, Sanderson J, Guerin CJ. Colocalization analysis in fluorescence micrographs: verification of a more accurate calculation of Pearson's correlation coefficient. Microsc Microanal. 2010;16:710–724. - PubMed
    1. Bellve KD, Leonard D, Standley C, Lifshitz LM, Tuft RA, Hayakawa A, Corvera S, Fogarty KE. Plasma membrane domains specialized for clathrin-mediated endocytosis in primary cells. J Biol Chem. 2006;281:16139–16146. - PubMed
    1. Cao H, Krueger EW, McNiven MA. Hepatocytes internalize trophic receptors at large endocytic “hot spots.”. Hepatology. 2011;54:1819–1829. - PMC - PubMed
    1. Carrasco S, Meyer T. STIM proteins and the endoplasmic reticulum-plasma membrane junctions. Annu Rev Biochem. 2011;80:973–1000. - PMC - PubMed

Publication types

MeSH terms