. 2013 Sep;24(18):2966-80.
doi: 10.1091/mbc.E13-02-0113. Epub 2013 Jul 17.

Calpain A modulates Toll responses by limited Cactus/IκB proteolysis

Affiliations

Calpain A modulates Toll responses by limited Cactus/IκB proteolysis

Marcio Fontenele et al. Mol Biol Cell. 2013 Sep.

Abstract

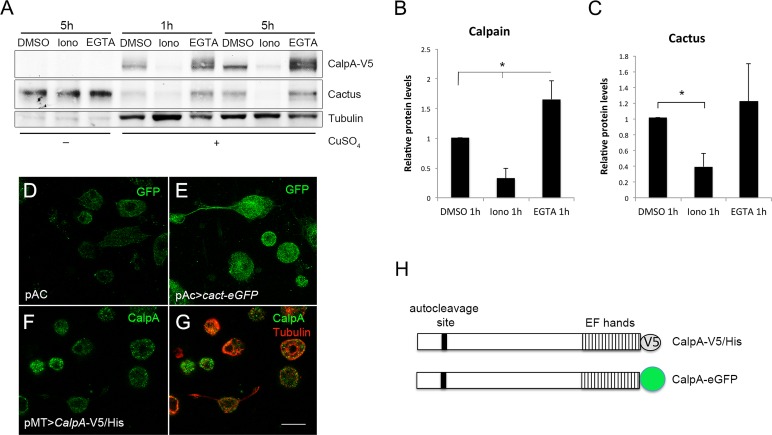
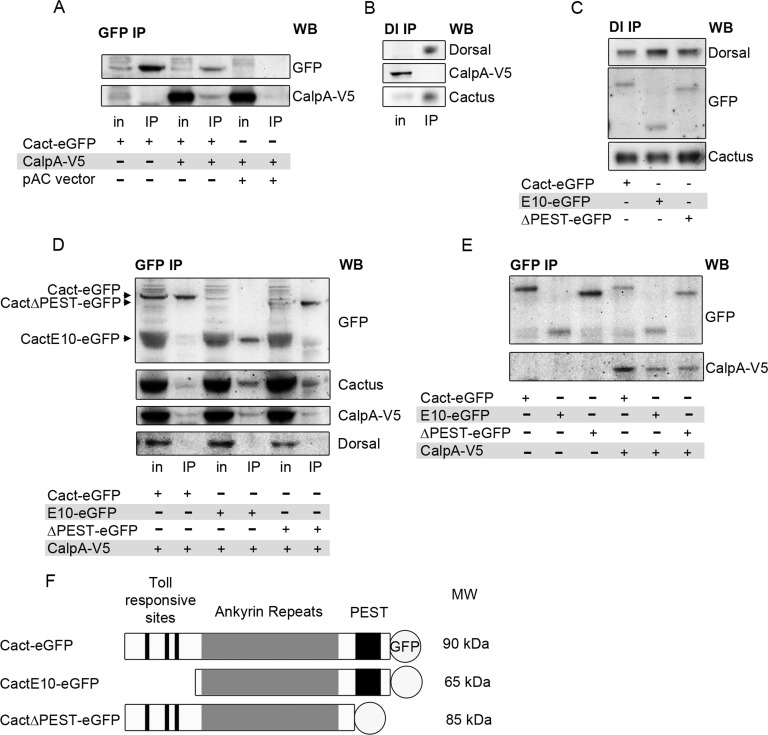
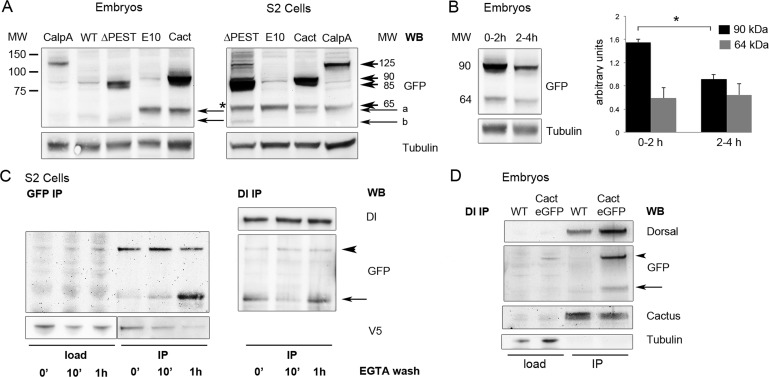
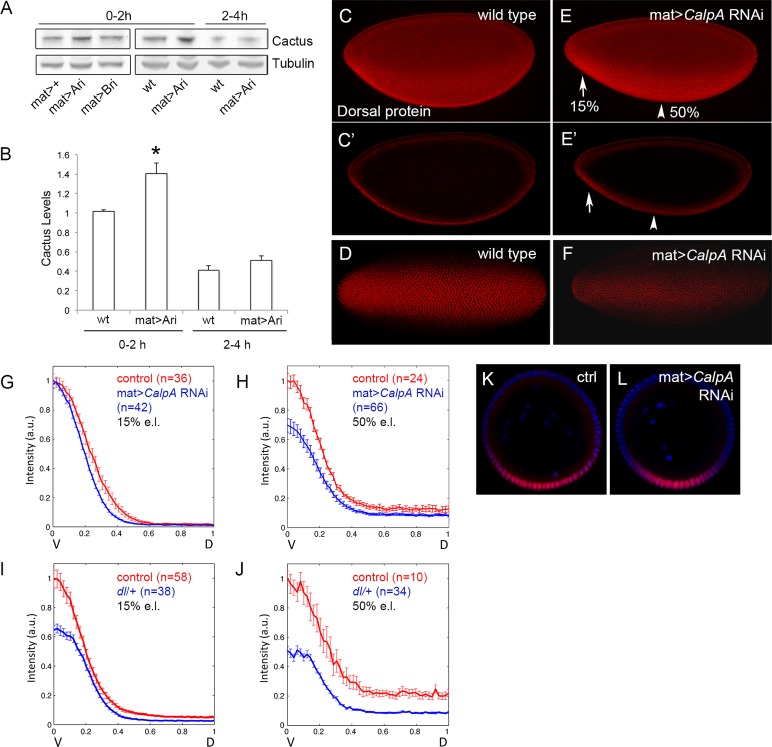
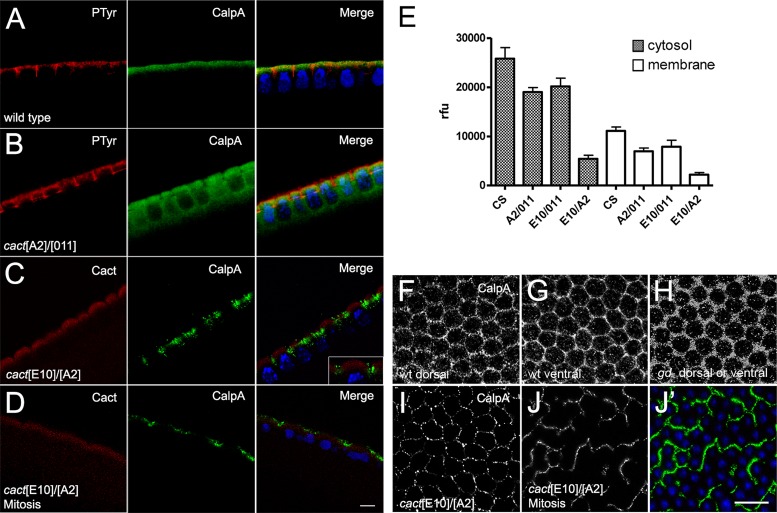
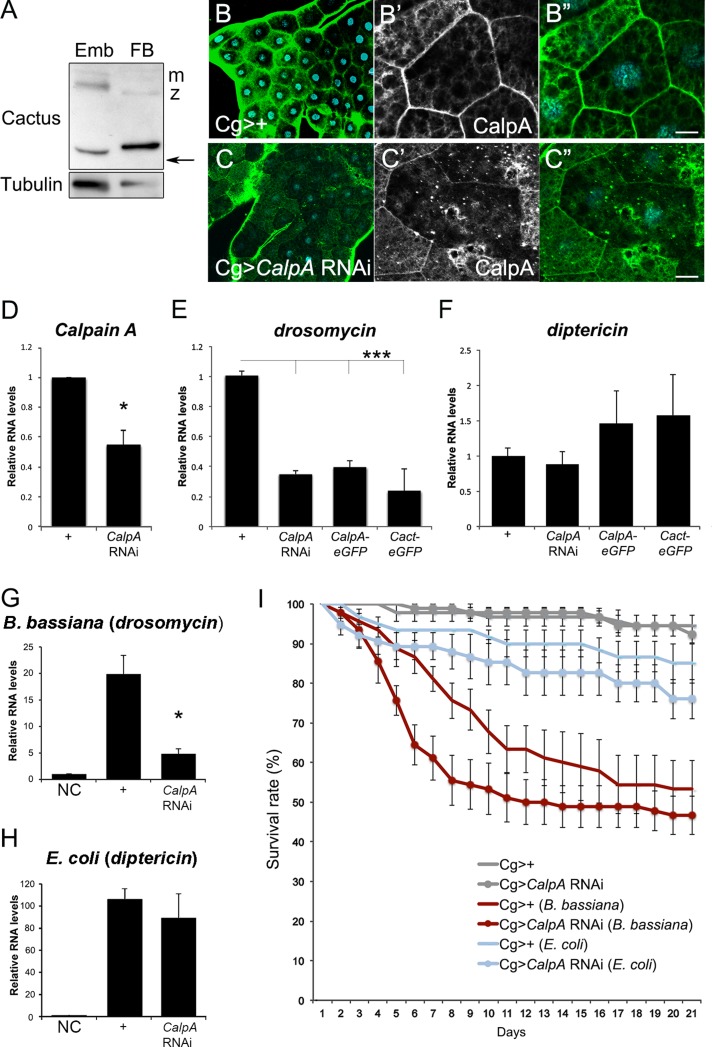
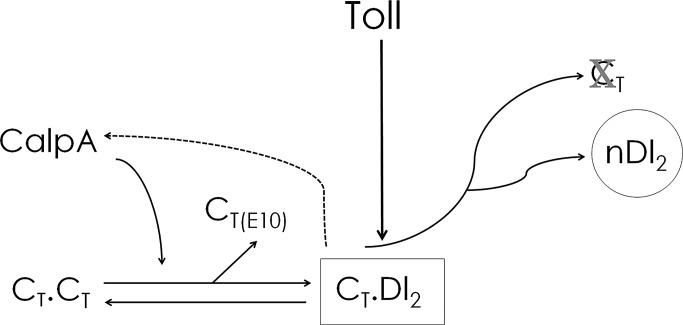
Calcium-dependent cysteine proteases of the calpain family are modulatory proteases that cleave their substrates in a limited manner. Among their substrates, calpains target vertebrate and invertebrate IκB proteins. Because proteolysis by calpains potentially generates novel protein functions, it is important to understand how this affects NFκB activity. We investigate the action of Calpain A (CalpA) on the Drosophila melanogaster IκB homologue Cactus in vivo. CalpA alters the absolute amounts of Cactus protein. Our data indicate, however, that CalpA uses additional mechanisms to regulate NFκB function. We provide evidence that CalpA interacts physically with Cactus, recognizing a Cactus pool that is not bound to Dorsal, a fly NFκB/Rel homologue. We show that proteolytic cleavage by CalpA generates Cactus fragments lacking an N-terminal region required for Toll responsiveness. These fragments are generated in vivo and display properties distinct from those of full-length Cactus. We propose that CalpA targets free Cactus, which is incorporated into and modulates Toll-responsive complexes in the embryo and immune system.


Figures

FIGURE 1:
FIGURE 1:
Calpain A alters Cactus levels in S2 cells. (A) Western blot of samples from S2 cells transfected for 48 h with pMT-CalpA-V5. CalpA and endogenous Cact levels are shown before and after induction of the transgene with CuSO4. After 24 h of induction, cells were treated with 5 μM ionomycin (Iono), the calcium chelator EGTA (5 mM), or vehicle (DMSO) for 1 or 5 h. Tubulin was used as loading control. (B, C) Quantification shows that CalpA-V5 levels (B) change by increasing (Iono) or decreasing (EGTA) Ca2+. Cact levels (C) decrease significantly with ionomycin. Statistical significance defined by Student's t test, *p < 0.05. (D–G) Immunostaining for GFP (D, E) or V5 (F, G) in S2 cells transfected with (D) empty pAC vector, (E) pAC>cact-eGFP, and (F, G) pMT-CalpA-V5; Tubulin was used to reveal the cell outline. (H) Schematic of CalpA with C-terminal V5/His or GFP tag, site for autoproteolysis, and penta EF-hand Ca2+ binding region harboring the short hydrophobic domain. Scale bar (D–F), 10 μm.
FIGURE 2:
FIGURE 2:
Calpain binds Cactus. (A) Immunoprecipitation of Cact with anti-GFP antibodies. S2 cells were transfected with pMT-CalpA-V5 and pAC>cact-eGFP or pAC vector. On induction with CuSO4, whole-cell lysates show CalpA expression (in, input), which coimmunoprecipitates with Cact-eGFP (IP). (B) Using protein G–bound antibodies against Dl, endogenous Cact coimmunoprecipitates with Dl, but not CalpA. (C) Cells expressing N-terminal–deleted (E10-eGFP) or C-terminal–deleted (ΔPEST-eGFP) tagged Cact or full-length Cact-eGFP. All Cactus constructs coimmunoprecipitate with Dl. Western blot (WB) for GFP shows GFP constructs. Only the endogenous Cact region is shown in Cact WB. (D, E) Cells transfected with pMT-CalpA-V5 and pAC>cact-eGFP, pAC>cactE10-eGFP, or pAC>cactΔPEST-eGFP. All Cact constructs bind CalpA-V5, endogenous Cact, but not Dl in IPs using anti-GFP (D). (E) Comparison of IPs from cells expressing (+) or not expressing (–) CalpA-V5 shows that levels of Cact-eGFP and CactΔPEST-eGFP are reduced in the presence of CalpA. Cells were treated under identical conditions except for the presence or absence of CuSO4, and identical amounts were loaded on gels. (F) Graphic representation of GFP-tagged Cact constructs showing the region harboring Toll-responsive phosphorylation sites and sites for phosphorylation by Toll-independent signaling (PEST). MW denotes approximate size observed on SDS–PAGE.
FIGURE 3:
FIGURE 3:
C-terminal Cactus fragments are generated by the action of CalpA and are present in Dl complexes. (A) C-terminal, GFP-tagged CalpA and Cact constructs are visualized in 0- to 2-h-old embryos and in S2 cells by Western blot. Arrowheads indicate full-length tagged proteins (125, 90, 85, and 65 kDa for CalpA-eGFP, Cact-eGFP, CactΔPEST-eGFP, and CactE10-eGFP respectively), and arrows indicate C-terminal fragments (a for Cact-eGFP, b for CactΔPEST-eGFP fragments). Note that the Cact-eGFP fragment migrates slightly faster than CactE10-eGFP. Asterisk denotes nonspecific band detected by the anti-GFP antibody. Tubulin was used as loading control. (B) Analysis of Cact-eGFP protein over time. Embryos containing six copies of maternally driven Cact-eGFP constructs were collected at 2-h intervals. Full-length Cact-eGFP (90 kDa) decreases over time at a faster rate than C-terminal fragments (64 kDa). Bars represent Cact-eGFP relative to tubulin protein levels. Statistical significance defined by Student's t test, *p < 0.05. (C) CalpA generates Cact fragments. To attain high levels of Cact-eGFP expression, S2 cells were transfected with pT>cact-eGFP, Actin-Gal4, and pMT>CalpA-V5/His. After 24 h in the presence of CuSO4 to induce CalpA expression, cells were treated 5 h with EGTA, subsequently washed with fresh medium for the times indicated, and submitted to immunoprecipitation for anti-GFP. Arrowhead indicates full-length Cact-eGFP, which decreases over time (GFP IP, left), whereas the amount of a Cact-eGFP fragment (arrow) increases. Equivalent amounts of the same samples submitted to GFP IP were used for IP with anti-Dl (Dl IP, right). Both full-length and Cact-eGFP fragments coimmunoprecipitate with Dl. The load portion of the anti-V5 blot was underexposed to reveal that the decrease in CalpA-V5 in the GFP IP lanes after 1 h EGTA wash is not due to a smaller protein input for IP. (D) Lysates from wild-type (WT) embryos or embryos expressing six copies of cact-eGFP were immunoprecipitated with anti-Dl. Endogenous Cact (Cactus), as well as Cact-eGFP (GFP) full-length (arrowhead) and C-terminal fragments (arrow), coimmunoprecipitate with Dl.
FIGURE 4:
FIGURE 4:
Calpain A KD alters the format of the Dorsal gradient during embryogenesis. (A) Western blot analysis reveals that CalpA KD with the maternal tub67Gal4 driver (mat>Ari) increases the levels of Cact protein in blastoderm embryos (0–2 h) but has no effect after gastrulation (2–4 h). CalpB KD has no effect (mat>Bri). Tubulin was used as loading control. (B) Quantification of protein bands shows a small but significant increase in the levels of Cact in 0- to 2-h embryos (*p < 0.05; Student's t test). (C–F) Dl gradient in wild-type (C, D) and CalpA KD (E, F) shows a reduction in the Dl gradient, especially at 50% embryo length (arrowhead), as seen in the lateral projected Z-sections (C, E) and in cross-sections (C′, E′) of the same embryos. Embryos in ventral view (D, F) show a narrow domain of high Dl in the KD (F). Anterior is left, posterior is right. Dorsal is up in C and E. (G–L) Embryos were cut transversely, and the nuclear Dl gradient was quantified at 15% (G, I) or 50% (H, J) e.l. compared with control embryos (Histone-GFP) stained concomitantly. The x-axis represents the space from the ventralmost point (V; x = 0) to the dorsalmost point (D; x = 1). The y-axis represents the intensity of nuclear Dl, where the gradient was normalized with respect to the control Dl gradient. Error bars correspond to the SEM. (G) At 15% e.l. (left) the format of the Dl gradient is modified in embryos from the CalpA RNAi (in blue) compared with control embryos (red). Basal Dl levels in dorsal regions are unchanged. At 50% e.l. (H) the amplitude of the gradient is also decreased in CalpA RNAi. (I, J) A reduction in the dose of dl (blue) results in a decrease in the amplitude of the Dl gradient as well as in the basal Dl levels at 15% e.l. (I) and is more prominent at 50% e.l. (J). Here n corresponds to the number of gradients analyzed. (K, L) Optical sections at 15% e.l. to illustrate the Dl gradient in control (K) and CalpA RNAi (L) embryos. Plots in G–J are statistically significant based on Student's t test (p < 0.05).
FIGURE 5:
FIGURE 5:
The cactus[E10] gain-of-function mutant alters CalpA distribution and activity. (A) Wild-type syncytial blastoderm embryo showing endogenous CalpA beneath the plasma membrane, marked with anti-phosphotyrosine antisera. (B) In loss-of-function cact mutants CalpA is diffuse in the cytoplasm. (C, D) In a gain-of-function cact mutant (cact[E10]/cact[A2] mothers), CalpA distribution is patchy during interphase (C) and remains so during mitosis (D). CalpA in green and Hoechst nuclear stain in blue; Phosphotyrosine in red in A and B, and Cact in red in C and D. (E) Calpain activity decreases in loss-of-function (cact[A2]/cact[011] mothers) and gain-of-function (cact[E10]/cact[011] and cact[E10]/cact[A2] mothers) cact mutants as compared with wild-type (CS). Values are statistically significant based on one-way analysis of variance (p < 0.05). The decrease in activity in membrane-enriched fractions does not result from a redistribution to the cytosol. (F–J) CalpA distribution in sagittal view of (F) dorsal and (G) ventral region of a wild-type embryo, (H) embryo from a gd-/gd- mother, and (I, J) embryos from cact[E10]/cact[A2] mothers during interphase (I) or mitosis (J, J′). Nuclei are blue in J′ to reveal detail in CalpA (green) distribution. Scale bars, 5 μm (A–D), 10 μm (F–J).
FIGURE 6:
FIGURE 6:
CalpA regulates Toll pathway responses in the fat body. (A) Cact protein in larval fat body (FB) and 0- to 2-h embryos (Emb). Note the maternal (m) and zygotic (z) full-length bands and the truncated (arrow) forms. Tubulin was used as loading control. (B, C) CalpA protein staining (green) in control (B; Cg-GAL4>+), and CalpA KD (C; Cg-GAL4>UAS-Dicer2; UAS-CalpA RNAi) larval fat body. The KD is more effective in some cells than others; however, decreased submembranous immunoreactivity is observed in most cells, as shown in high magnification (B′′, B′′′; C′′, C′′′). (D) qRT-PCR shows 50% reduction in CalpA mRNA levels in the CalpA KD. (E–H) qRT-PCR for drosomycin (E, G) and diptericin (F, H) in control larvae (Cg-GAL4>+) or larvae expressing UAS-Dicer2; UAS-CalpA RNAi, UAS-CalpA-eGFP, or UAS-cact-eGFP under the control of Cg-GAL4. Basal (E, F) drosomycin levels are significantly decreased by alterations in CalpA and cact. On challenge (G) with B. bassiana, drosomycin levels decrease in the CalpA KD relative to control Cg-GAL4>+. No difference is observed upon challenge with E. coli (H). Statistical significance defined by Student's t test, *p < 0.05. (I) Viability in B. bassiana–challenged but not E. coli–challenged Cg>CalpA RNAi adult flies is significantly decreased relative to Cg>+ controls. Statistical significance assigned by log-rank (Mantel–Cox) test for the first 15 d and by Gehan–Breslow–Wilcoxon test for the entire period, p < 0.05. Scale bar, 10 μm (B′′, C′′). NC = no challenge.
FIGURE 7:
FIGURE 7:
CalpA modifies Cactus distribution in the larval fat body. (A) Control (Cg-GAL4>+), (B) CalpA KD (Cg-GAL4>UAS-Dicer2; UAS-CalpA RNAi), and (C) CalpA-eGFP–overexpressing (Cg-GAL4>UAS-CalpA-eGFP) fat body cells showing Histone-GFP (green in A) or CalpA-eGFP (green in B, C), Cact (red), phalloidin (white), and Hoechst nuclear stain (blue) in all merged images. CalpA KD induces decreased Cact in the cytoplasm and maintains submembranous Cactus, which colocalizes with filamentous actin, whereas CalpA overexpression induces the inverse effect. (A′–C′) High magnification of fat body cells from A–C. Scale bars, 50 μm (A–C), 25 μm (A′–C′).
FIGURE 8:
FIGURE 8:
Model for the action of CalpA in modifying Toll signals. On the basis of a reduction of the Dl gradient in the embryo and the reduced expression of Dl target genes in the embryo and fat body upon CalpA KD, we propose a model for the action of CalpA to increase signaling through Toll: CalpA targets free Cact (CT⋅CT), releasing protein, which is incorporated into a complex with Dl (CT⋅Dl2). This complex responds to Toll signals, leading to Cact degradation and nuclear translocation of Dl (nDl2). In the process of releasing free Cact, C-terminal Cact fragments are produced (CT[E10]). Because Calpain activity is reduced in cact loss of function and CalpA distribution is altered by Toll signals, the model incorporates a positive feedback loop from Toll-responsive Cact:2Dl complexes (CT⋅Dl2, dashed arrow). Although not depicted, Cact fragments (CT[E10]) are also able to incorporate into a complex with Dl. Variations in the relative amount of full-length to truncated Cact may differentially affect Dl nuclear translocation.

References

    1. Anderson KV, Jurgens G, Nusslein-Volhard C. Establishment of dorsal-ventral polarity in the Drosophila embryo: genetic studies on the role of the Toll gene product. Cell. 1985;42:779–789. - PubMed
    1. Araujo H, Negreiros E, Bier E. Integrins modulate Sog activity in the Drosophila wing. Development. 2003;130:3851–3864. - PubMed
    1. Asha H, Nagy I, Kovacs G, Stetson D, Ando I, Dearolf CR. Analysis of Ras-induced overproliferation in Drosophila hemocytes. Genetics. 2003;163:203–215. - PMC - PubMed
    1. Baghdiguian S, et al. Calpain 3 deficiency is associated with myonuclear apoptosis and profound perturbation of the IkappaB alpha/NF-kappaB pathway in limb-girdle muscular dystrophy type 2A. Nat Med. 1999;5:503–511. - PubMed
    1. Baud V, Derudder E. Control of NF-kappaB activity by proteolysis. Curr Top Microbiol Immunol. 2011;349:97–114. - PubMed

Publication types

MeSH terms

LinkOut - more resources