. 2013 Sep;24(17):2678-88.
doi: 10.1091/mbc.E13-02-0098. Epub 2013 Jul 17.

Rap-afadin axis in control of Rho signaling and endothelial barrier recovery

Affiliations

Rap-afadin axis in control of Rho signaling and endothelial barrier recovery

Anna A Birukova et al. Mol Biol Cell. 2013 Sep.

Abstract

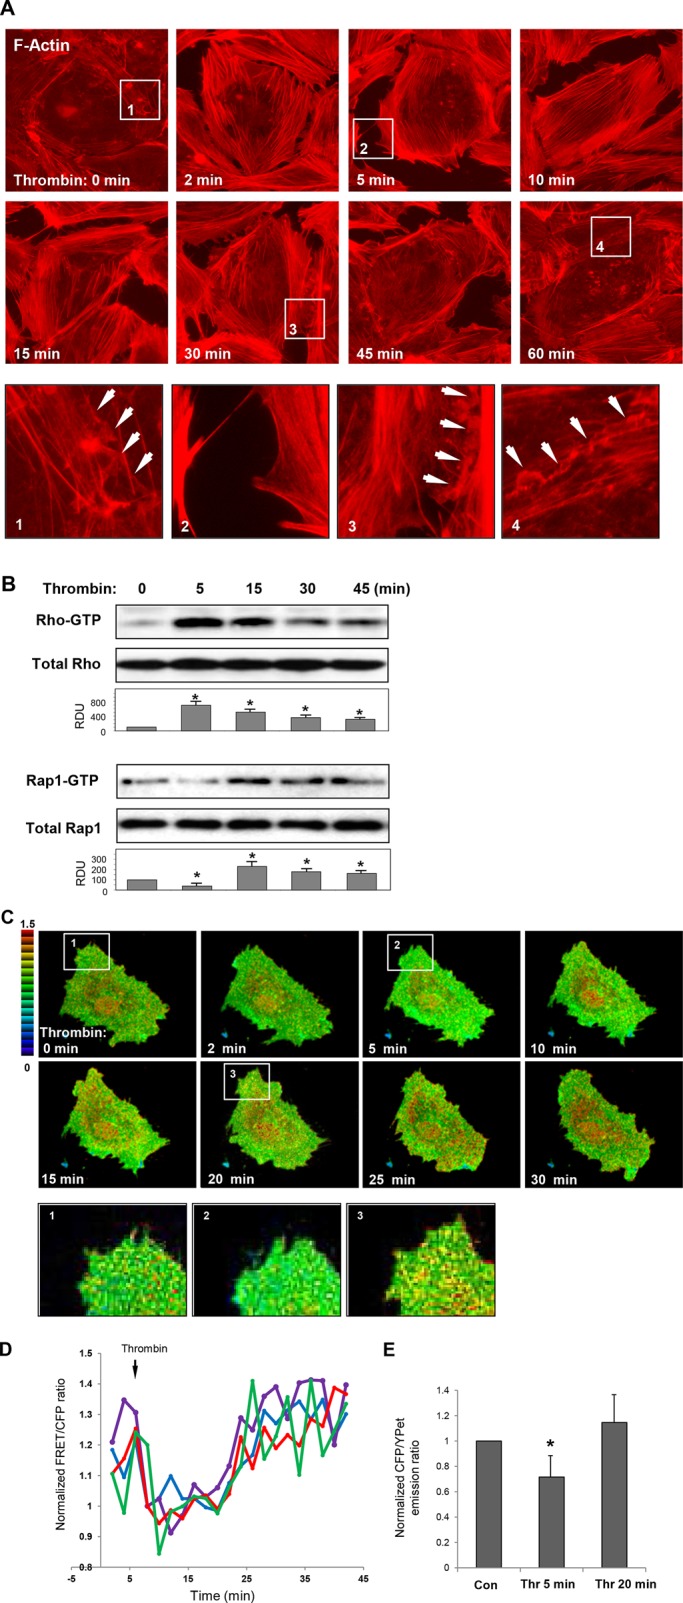
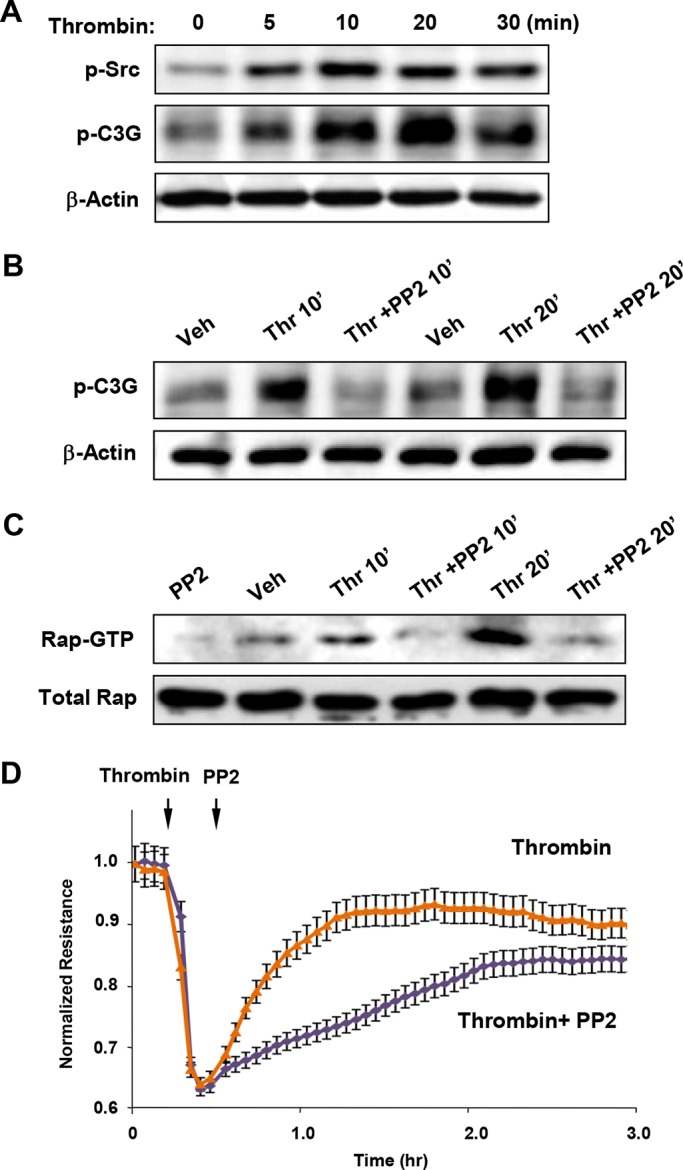
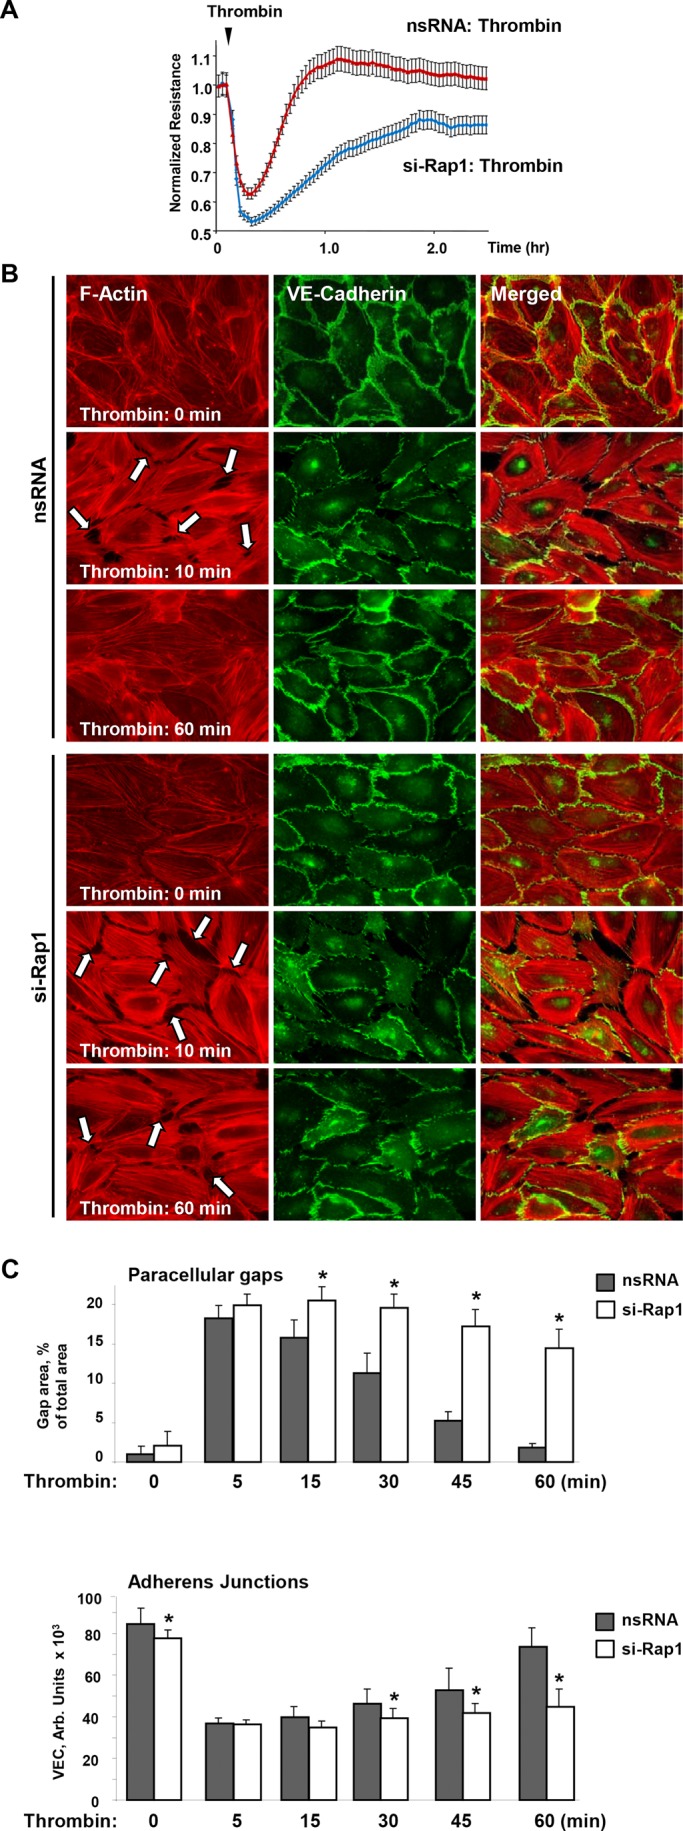
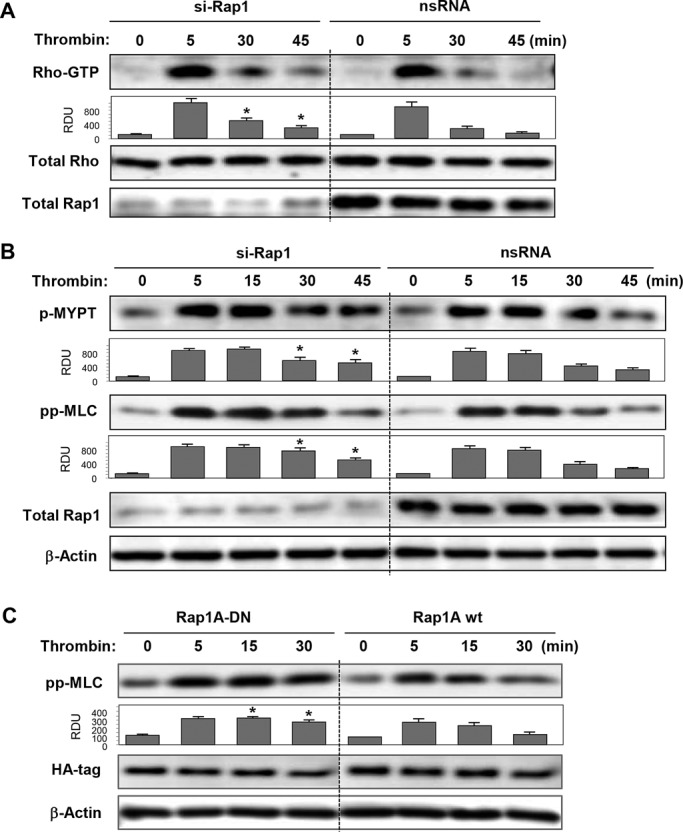
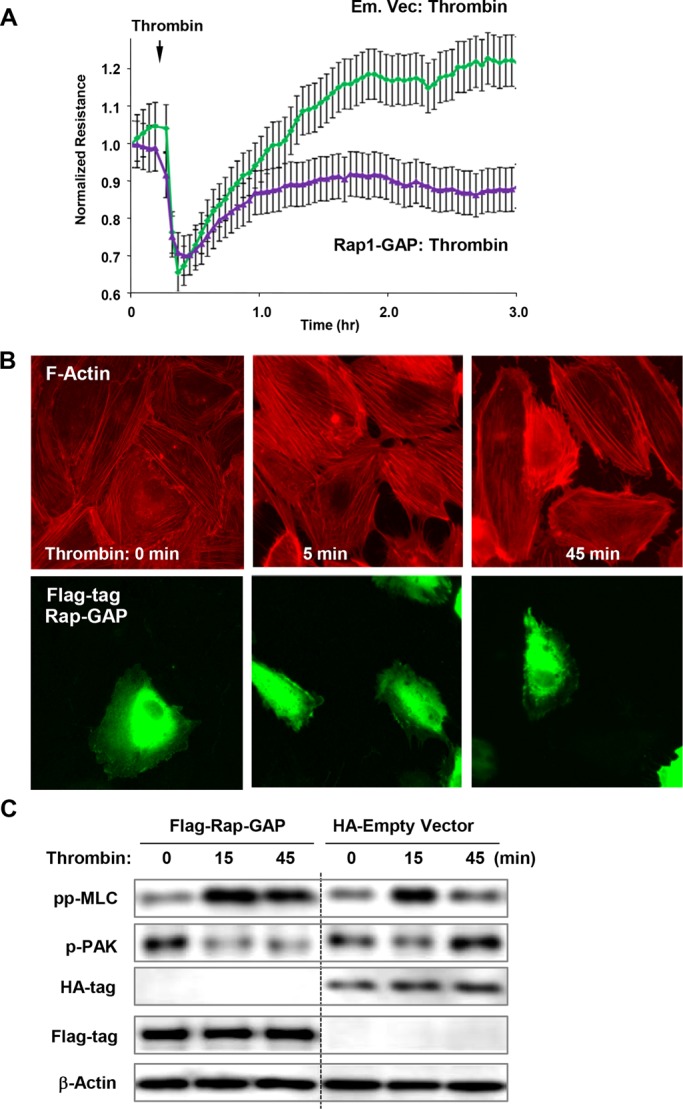
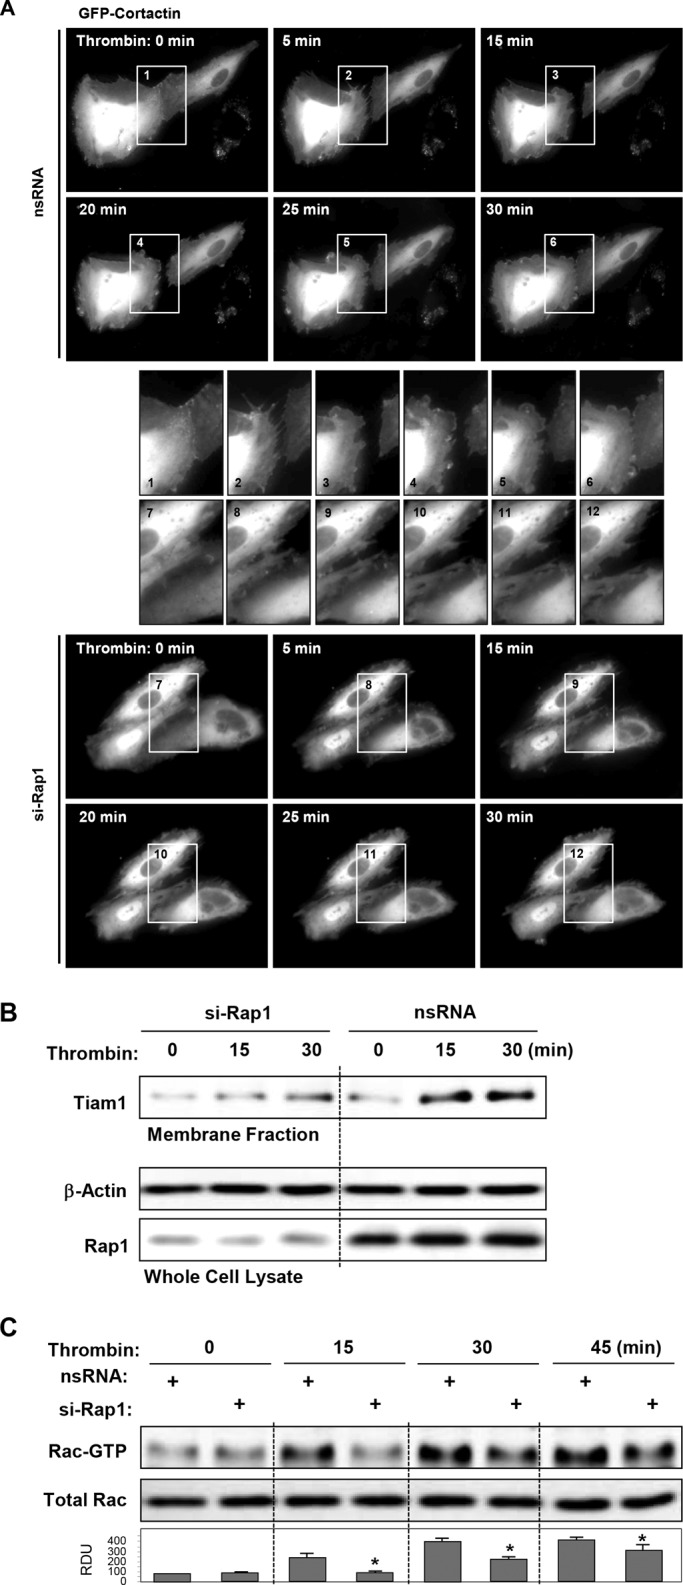
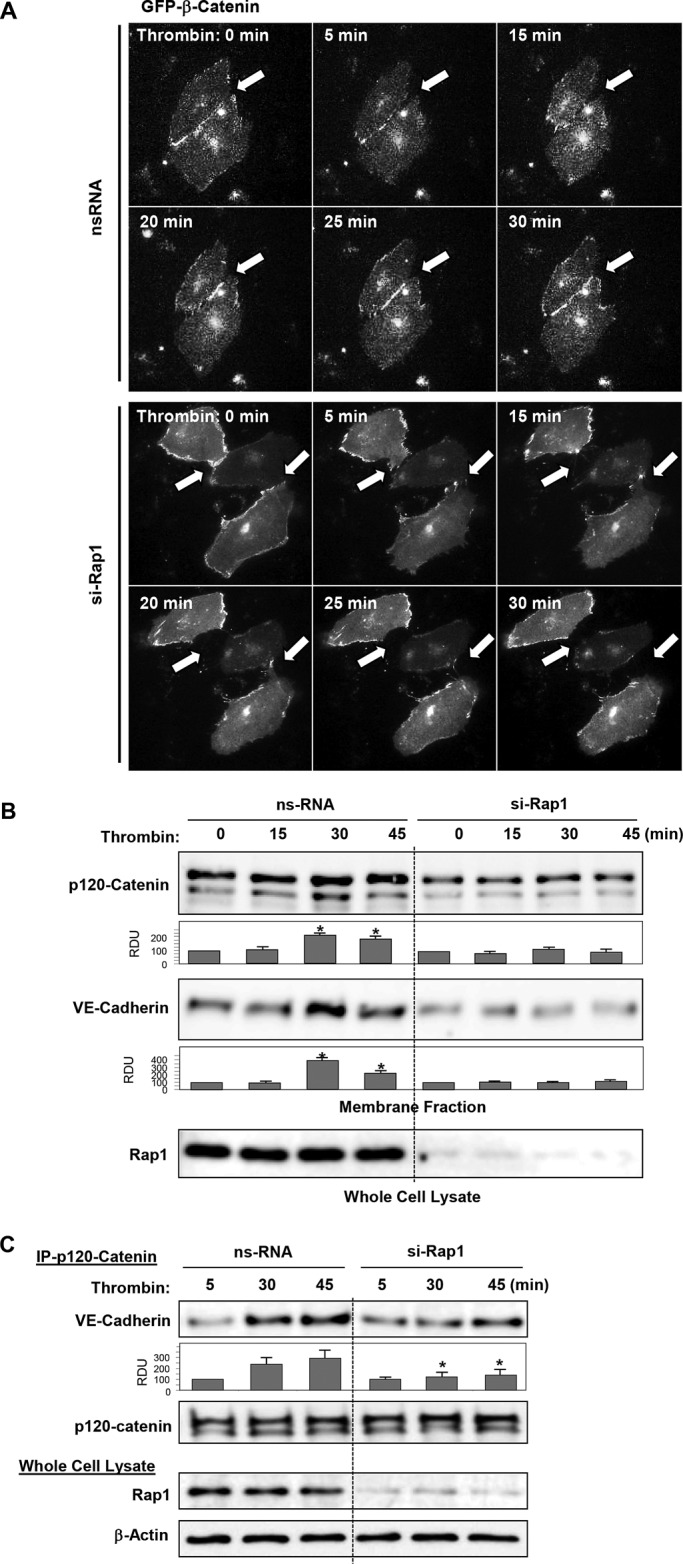
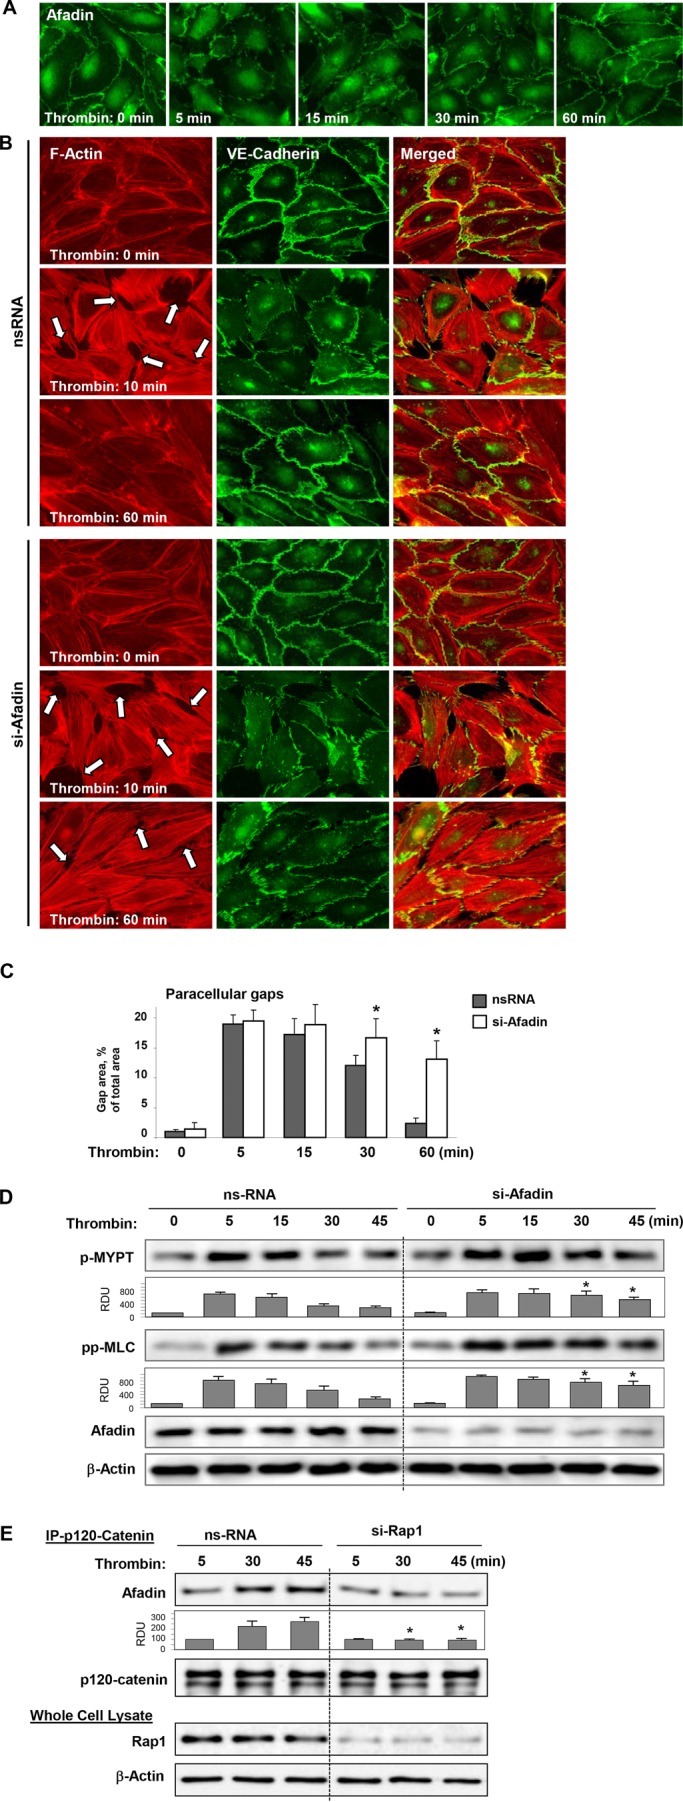
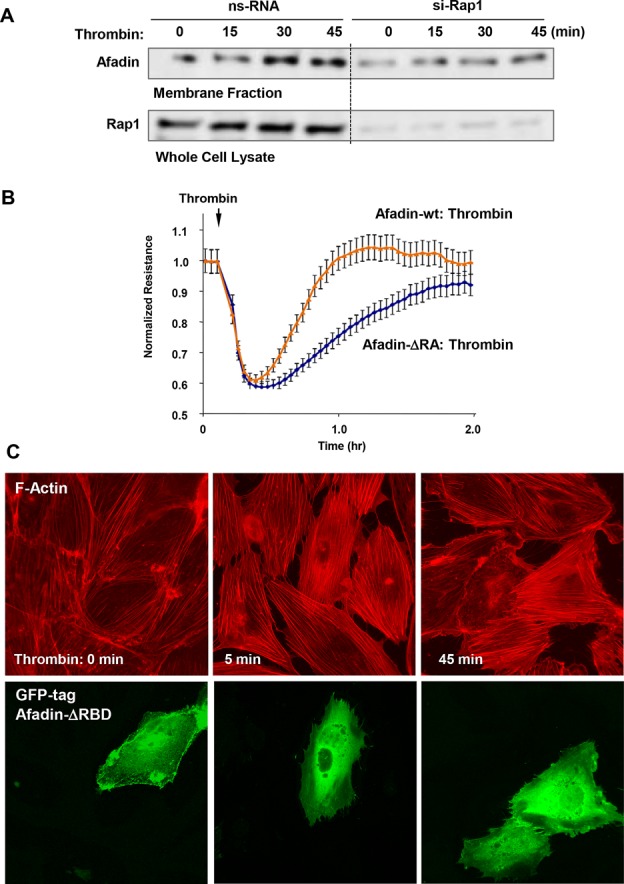
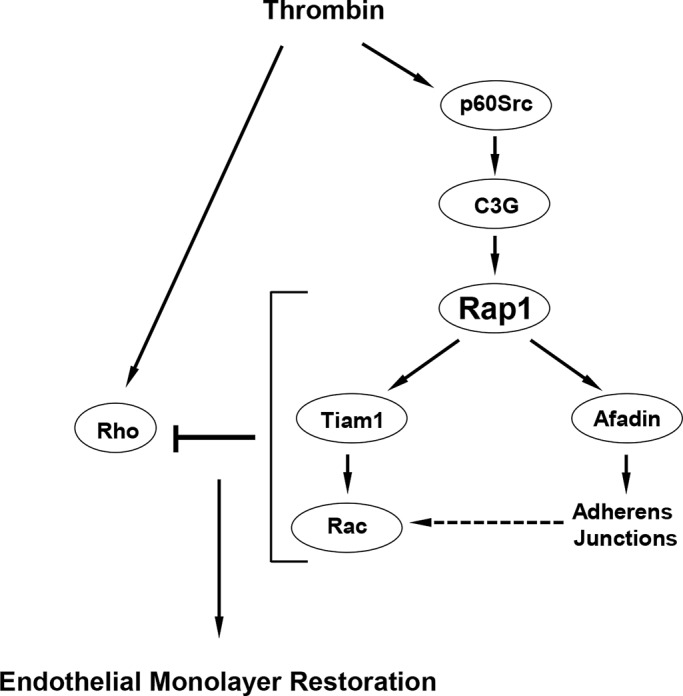
Activation of the Rho GTPase pathway determines endothelial cell (EC) hyperpermeability after injurious stimuli. To date, feedback mechanisms of Rho down-regulation critical for barrier restoration remain poorly understood. We tested a hypothesis that Rho down-regulation and barrier recovery of agonist-stimulated ECs is mediated by the Ras family GTPase Rap1. Thrombin-induced EC permeability driven by rapid activation of the Rho GTPase pathway was followed by Src kinase-dependent phosphorylation of the Rap1-specific guanine nucleotide exchange factor (GEF) C3G, activation of Rap1, and initiation of EC barrier recovery. Knockdown experiments showed that Rap1 activation was essential for down-regulation of Rho signaling and actin stress fiber dissolution. Rap1 activation also enhanced interaction between adherens junction (AJ) proteins VE-cadherin and p120-catenin and stimulated AJ reannealing mediated by the Rap1 effector afadin. This mechanism also included Rap1-dependent membrane translocation of the Rac1-specific GEF Tiam1 and activation of Rac1-dependent peripheral cytoskeletal dynamics, leading to resealing of intercellular gaps. These data demonstrate that activation of the Rap1-afadin axis is a physiological mechanism driving restoration of barrier integrity in agonist-stimulated EC monolayers via negative-feedback regulation of Rho signaling, stimulation of actin peripheral dynamics, and reestablishment of cell-cell adhesive complexes.


Figures

FIGURE 1:
FIGURE 1:
Effect of thrombin on F-actin remodeling and activation of Rho and Rap1 GTPases in human pulmonary ECs. (A) ECs grown on glass coverslips were stimulated with thrombin (0.5 U/ml) for different time periods; this was followed by immunofluorescence staining with Texas Red phalloidin to detect actin filaments. Insets depicting higher-magnification images of F-actin structures at the cell periphery are shown below. Arrows indicate cell–cell interface areas. (B) Time course of thrombin-induced activation of Rho and Rap1 evaluated by pull-down assays with agarose-conjugated rhotekin and Ral-GDS, respectively. Bottom panels show total Rho and Rap1 content in EC lysates used as normalization control. Bar graphs depict results of membrane densitometry analysis; data are expressed as mean ± SD; *, p < 0.05 vs. control. (C) FRET analysis of thrombin-induced Rap1 activation in live cells. HPAECs were transfected with CFP/YPet-Rap-Raichu biosensor for 24 h. Images represent ratio of activated Rap1 to the total Rap1 content. Areas of Rap1 activation appear in yellow and red. (D) Quantitative analysis of thrombin-induced Rap1 activation in single cells. Graphs represent time-dependent changes in normalized CFP/YPet emission ratio in four different cells. (E) Bar graphs depict average Rap1 activity before and after 5 min and 20 min of thrombin stimulation. Data are expressed as mean ± SD of five independent measurements; *, p < 0.05 vs. control.
FIGURE 2:
FIGURE 2:
Role of Src and C3G phosphorylation in Rap1 activation and EC barrier restoration after thrombin. (A) Time-dependent Src activation was monitored by immunoblotting with p-Y416–specific antibody reflecting the Src-activated state. (B) ECs were stimulated with thrombin (0.5 U/ml, 5 min); this was followed by addition of vehicle or the Src kinase inhibitor PP2 (5 μM). C3G tyrosine phosphorylation was detected by Western blot with phosphospecific antibody. Reprobing with β-actin antibody was used as normalization control. (C) ECs were stimulated with thrombin (0.5 U/ml, 5 min); this was followed by addition of vehicle or the Src kinase inhibitor PP2 (5 μM). Rap1 activation was evaluated using Rap1-GTP pull-down assay and normalized to the total Rap1 content in cell lysates. (D) HPAECs plated on microelectrodes were treated with thrombin (5 min); this was followed by addition of PP2 (5 μM). Measurements of TER were performed over 3 h. Arrows indicate times of thrombin and PP2 addition.
FIGURE 3:
FIGURE 3:
Effects of Rap1 knockdown on functional and structural barrier restoration of pulmonary EC monolayer after thrombin. (A) ECs plated on microelectrodes were transfected with Rap1-specific siRNA or nonspecific RNA 48 h prior to TER measurements. Control and Rap1-specific siRNA-treated ECs were stimulated with thrombin at the time indicated by the arrow, and TER changes were monitored over time. (B) ECs plated on glass coverslips were transfected with Rap1-specific siRNA or nonspecific RNA prior to stimulation with thrombin. Immunofluorescence staining of F-actin (left) and VE-cadherin (middle) was performed using Texas Red phalloidin and VE-cadherin specific antibody, respectively. Right, merged images of F-actin and VE-cadherin staining. Arrows indicate areas of thrombin-induced intercellular gap formation. (C) Quantitative analysis of gap formation and cell junction VE-cadherin localization in control and Rap1-depleted ECs at different times after thrombin treatment. Data are expressed as mean ± SD; *, p < 0.05.
FIGURE 4:
FIGURE 4:
Effects of Rap1 knockdown on thrombin-induced Rho signaling. (A) Cells treated with nonspecific or Rap1-specific siRNA were stimulated with thrombin for the indicated time periods. Rho activation was evaluated by RhoGTP pull-down assay (top) and normalized to total Rho content in cell lysates (middle). Rap1 depletion was verified by Western blot (bottom). (B) Cells treated with nonspecific or Rap1-specific siRNA were stimulated with thrombin, and activation of Rho signaling was evaluated by Western blot with phospho-MYPT and diphospho-MLC antibody. (C) Cells transfected with HA-tagged wild-type (Rap1A wt) and dominant negative (Rap1A-DN) Rap1A mutant were treated with thrombin. Activation of Rho pathway was evaluated by immunoblotting with diphospho-MLC antibody. Reprobing with β-actin antibody was used as the normalization control. Rap1 depletion was verified by Western blot. Bar graphs depict results of membrane densitometry analysis; data are expressed as mean ± SD; *, p < 0.05 vs. control.
FIGURE 5:
FIGURE 5:
Effects of Rap1-GAP and inactive Rap1 on EC barrier recovery, Rac activation, and Rho down-regulation after thrombin. (A) Measurements of TER were performed in thrombin-stimulated cells transfected with Rap1-GAP or control vector. (B) Cells were transfected with Flag-tagged Rap1-GAP and treated with thrombin. Actin stress fiber formation was evaluated by Texas Red phalloidin staining (top). Staining with anti-Flag antibody indicates Rap1-GAP–overexpressing cells (bottom). (C) Cells were transfected with Flag-tagged Rap1-GAP or empty vector expressing HA-tag and treated with thrombin. Activation of Rac signaling was evaluated by immunoblotting with phospho-PAK1 antibody. Reprobing with β-actin antibody was used as the normalization control.
FIGURE 6:
FIGURE 6:
Role of Rac pathway in Rap1-dependent EC recovery after thrombin. (A) Live-cell imaging of HPAECs transfected with Rap1 siRNA or nonspecific RNA and expressing GFP-cortactin. Snapshots depict extension of peripheral cortactin-positive cell areas leading to resealing of intercellular gaps by 30 min of thrombin stimulation (top panels). Rap1 knockdown abolished this effect (bottom panels). Insets depict higher-magnification cell areas marked by rectangles. (B) Cells transfected with nonspecific RNA or Rap1-specific siRNA were treated with thrombin for 15 min or 30 min, and membrane translocation of the Rac-specific GEF Tiam1 was analyzed by Western blot analysis of EC membrane fractions. (C) Analysis of delayed Rac activation in thrombin-stimulated cells transfected with nonspecific RNA or Rap1-specific siRNA. Reprobing with β-actin antibody was used as the normalization control. Bar graphs depict results of membrane densitometry analysis; data are expressed as mean ± SD; *, p < 0.05 vs. nsRNA.
FIGURE 7:
FIGURE 7:
Role of Rap1 in reannealing of AJs and increased p120-catenin–VE-cadherin interactions during recovery after thrombin. (A) Live-cell imaging of HPAECs transfected with Rap1 siRNA or nonspecific RNA and expressing GFP-β-catenin. Snapshots depict reestablishment of β-catenin–positive AJ previously disrupted by thrombin challenge. (top panels, shown by arrow). Rap1 knockdown abolished this effect (bottom panels, shown by arrow). (B) Increased colocalization of p120-catenin and VE-cadherin in cell membrane fraction after 30 min of thrombin stimulation was abolished by Rap1 knockdown. Rap1 depletion was verified by Western blot. (C) Cells were transfected with nonspecific RNA or Rap1-specific siRNA; this was followed by thrombin stimulation. Coimmunoprecipitation assays using antibody to p120-catenin were performed, and VE-cadherin and p120-catenin content in the immunoprecipitates was detected using specific antibodies. Equal protein loading was confirmed by membrane reprobing with antibodies to p120-catenin. Bottom panels depict siRNA-based depletion of endogenous Rap1. Reprobing with β-actin antibody was used as the normalization control. Bar graphs depict results of membrane densitometry analysis; data are expressed as mean ± SD; *, p < 0.05 vs. control.
FIGURE 8:
FIGURE 8:
Role of afadin in EC barrier restoration and reversal of Rho signaling after thrombin. (A) HPAEC monolayers were stimulated with thrombin (0.5 U/ml) for the indicated periods of time. Peripheral localization of afadin was evaluated by immunofluorescence staining with afadin antibody. (B) HPAEC monolayers transfected with control RNA or afadin-specific siRNA were stimulated with thrombin (0.5 U/ml) for the indicated periods of time. Stress fiber formation and integrity of AJs was monitored by immunofluorescence staining with Texas Red phalloidin (left) and VE-cadherin (middle) antibody, respectively. Right, merged images of F-actin and VE-cadherin staining. (C) Quantitative analysis of gap formation in control and afadin-depleted ECs at different times after thrombin treatment. Data are expressed as mean ± SD; *, p < 0.05. (D) Activation of Rho signaling was evaluated by Western blot with phospho-MYPT and diphospho-MLC antibody. Reprobing with β-actin antibody was used as the normalization control. Afadin depletion was verified by Western blot. (E) Cells were transfected with nonspecific RNA or Rap1-specific siRNA; this was followed by thrombin stimulation. Coimmunoprecipitation assays using antibody to p120-catenin were performed, and afadin and p120-catenin content in the immunoprecipitates was detected using specific antibodies. Equal protein loading was confirmed by membrane reprobing with antibodies to p120-catenin. Bottom panels depict siRNA-based depletion of endogenous Rap1. Reprobing with β-actin antibody was used as the normalization control. Bar graphs depict results of membrane densitometry analysis; data are expressed as mean ± SD; *, p < 0.05 vs. control.
FIGURE 9:
FIGURE 9:
Afadin activation by Rap1 promotes EC barrier restoration and stress fiber disassembly after thrombin. (A) Cell membrane accumulation of afadin during HPAEC recovery after thrombin was abolished by Rap1 knockdown. Rap1 depletion was verified by Western blot. (B) ECs plated on microelectrodes were transfected with wild-type afadin or afadin-ΔRBD mutant 24 h prior to TER measurements. Stimulation with thrombin was performed at the time indicated by the arrow, and TER changes were monitored over 2 h. (C) Cells were transfected with GFP-tagged afadin-ΔRBD mutant and treated with thrombin. Actin stress fiber formation was evaluated by Texas Red phalloidin staining (top). Staining with anti-Flag antibody indicates afadin-ΔRBD–overexpressing cells (bottom).
FIGURE 10:
FIGURE 10:
Role of Rap1 in EC barrier restoration after thrombin. In parallel with rapid activation of the Rho pathway leading to increased EC permeability, thrombin causes activation of Src kinase, which stimulates the Rap1-specific GEF C3G and, via Rap1-Tiam1, turns on the Rac1 signaling. Activation of Rap1-Rac1 signaling axis down-regulates the Rho pathway of barrier disruption and promotes reassembly of AJ complexes and endothelial monolayer barrier restoration.

References

    1. Arthur WT, Quilliam LA, Cooper JA. Rap1 promotes cell spreading by localizing Rac guanine nucleotide exchange factors. J Cell Biol. 2004;167:111–122. - PMC - PubMed
    1. Asuri S, Yan J, Paranavitana NC, Quilliam LA. E-cadherin dis-engagement activates the Rap1 GTPase. J Cell Biochem. 2008;105:1027–1037. - PMC - PubMed
    1. Balzac F, Avolio M, Degani S, Kaverina I, Torti M, Silengo L, Small JV, Retta SF. E-cadherin endocytosis regulates the activity of Rap1: a traffic light GTPase at the crossroads between cadherin and integrin function. J Cell Sci. 2005;118:4765–4783. - PubMed
    1. Beckers CM, van Hinsbergh VW, van Nieuw Amerongen GP. Driving Rho GTPase activity in endothelial cells regulates barrier integrity. Thromb Haemost. 2010;103:40–55. - PubMed
    1. Birukova AA, Fu P, Wu T, Dubrovskyi O, Sarich N, Poroyko V, Birukov KG. Afadin controls p120-catenin-ZO-1 interactions leading to endothelial barrier enhancement by oxidized phospholipids. J Cell Physiol. 2012a;227:1883–1890. - PMC - PubMed

Publication types

MeSH terms

LinkOut - more resources