

Kidney dosimetry in ¹⁷⁷Lu and ⁹⁰Y peptide receptor radionuclide therapy: influence of image timing, time-activity integration method, and risk factors
- PMID: 23865075
- PMCID: PMC3705840
- DOI: 10.1155/2013/935351
Kidney dosimetry in ¹⁷⁷Lu and ⁹⁰Y peptide receptor radionuclide therapy: influence of image timing, time-activity integration method, and risk factors
Abstract
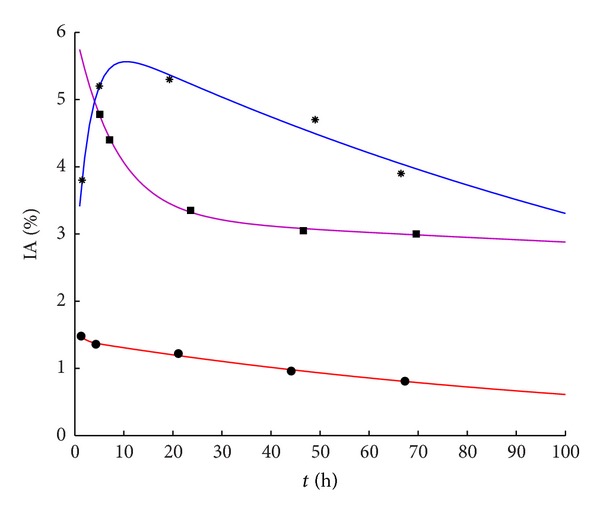
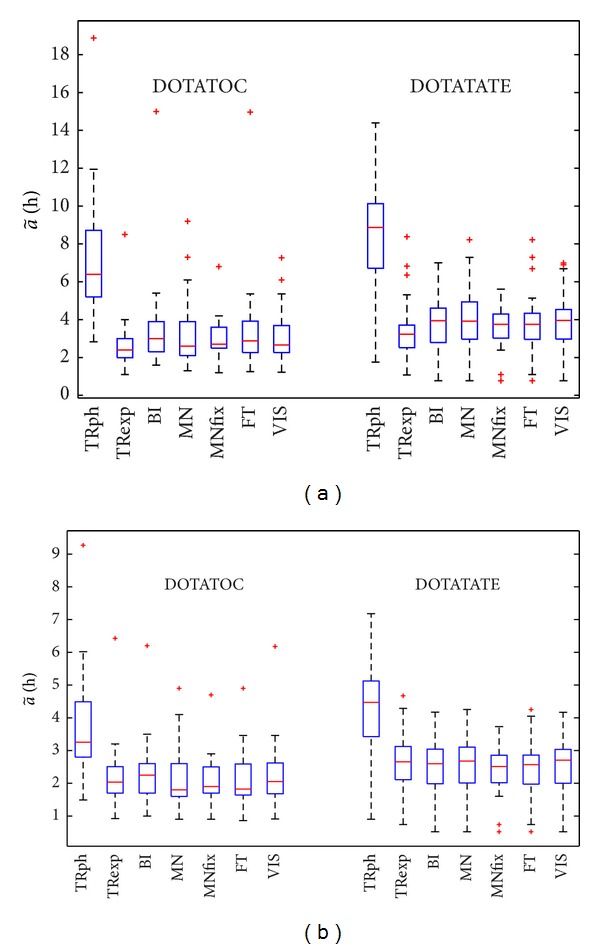
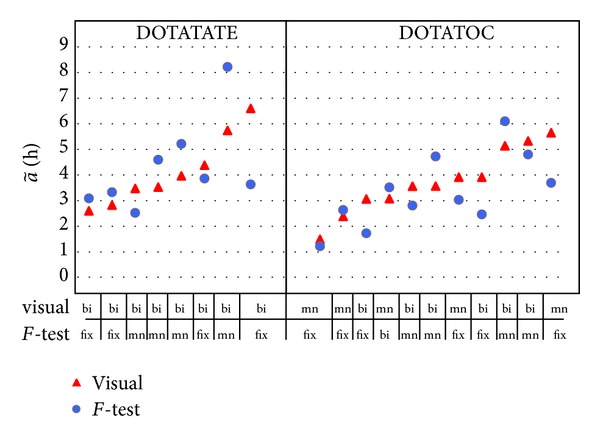
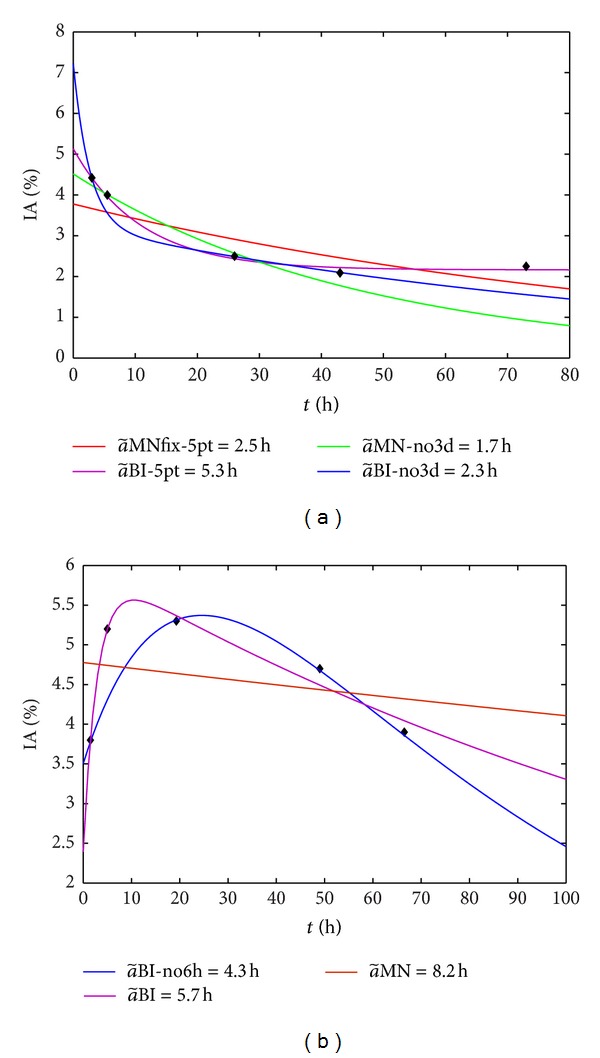
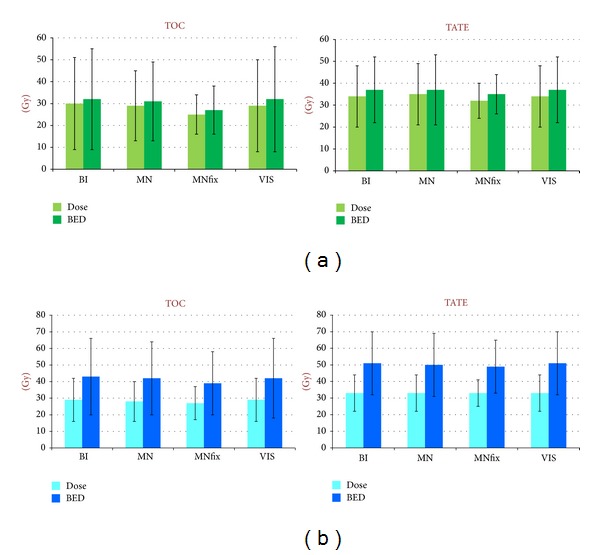
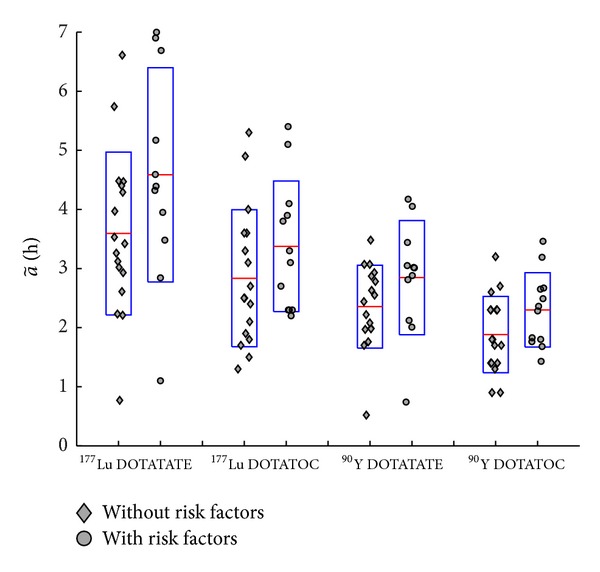
Kidney dosimetry in (177)Lu and (90)Y PRRT requires 3 to 6 whole-body/SPECT scans to extrapolate the peptide kinetics, and it is considered time and resource consuming. We investigated the most adequate timing for imaging and time-activity interpolating curve, as well as the performance of a simplified dosimetry, by means of just 1-2 scans. Finally the influence of risk factors and of the peptide (DOTATOC versus DOTATATE) is considered. 28 patients treated at first cycle with (177)Lu DOTATATE and 30 with (177)Lu DOTATOC underwent SPECT scans at 2 and 6 hours, 1, 2, and 3 days after the radiopharmaceutical injection. Dose was calculated with our simplified method, as well as the ones most used in the clinic, that is, trapezoids, monoexponential, and biexponential functions. The same was done skipping the 6 h and the 3 d points. We found that data should be collected until 100 h for (177)Lu therapy and 70 h for (90)Y therapy, otherwise the dose calculation is strongly influenced by the curve interpolating the data and should be carefully chosen. Risk factors (hypertension, diabetes) cause a rather statistically significant 20% increase in dose (t-test, P < 0.10), with DOTATATE affecting an increase of 25% compared to DOTATOC (t-test, P < 0.05).
Figures
References
-
- Kwekkeboom DJ, Kam BL, Van Essen M, et al. Somatostatin receptor-based imaging and therapy of gastroenteropancreatic neuroendocrine tumors. Endocrine-Related Cancer. 2010;17(1):R53–R73. - PubMed
-
- Glatting G, Kletting P, Reske SN, Hohl K, Ring C. Choosing the optimal fit function: comparison of the Akaike information criterion and the F-test. Medical Physics. 2007;34(11):4285–4292. - PubMed
-
- Cremonesi M, Botta F, Di Dia A, et al. Dosimetry for treatment with radiolabelled somatostatin analogues. A review. Quarterly Journal of Nuclear Medicine and Molecular Imaging. 2010;54(1):37–51. - PubMed
-
- Esser JP, Krenning EP, Teunissen JJM, et al. Comparison of [177Lu-DOTA0,Tyr3] octreotate and [177Lu-DOTA0,Tyr3] octreotide: which peptide is preferable for PRRT? European Journal of Nuclear Medicine and Molecular Imaging. 2006;33(11):1346–1351. - PubMed
-
- Sandström M, Garske U, Granberg D, Sundin A, Lundqvist H. Individualized dosimetry in patients undergoing therapy with 177Lu-DOTA-D-Phe1-Tyr3-octreotate. European Journal of Nuclear Medicine and Molecular Imaging. 2010;37(2):212–225. - PubMed
Publication types
MeSH terms
Substances
LinkOut - more resources
Full Text Sources
Other Literature Sources
Medical
Miscellaneous
