. 2013 Nov;58(6):1458-66.
doi: 10.1111/1556-4029.12223. Epub 2013 Jul 18.

New York State TrueAllele ® casework validation study

Affiliations
Free PMC article

New York State TrueAllele ® casework validation study

Mark W Perlin et al. J Forensic Sci. 2013 Nov.
Free PMC article

Abstract

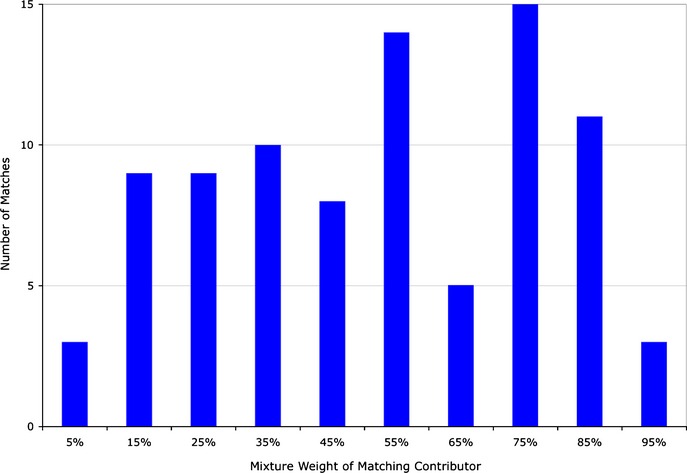
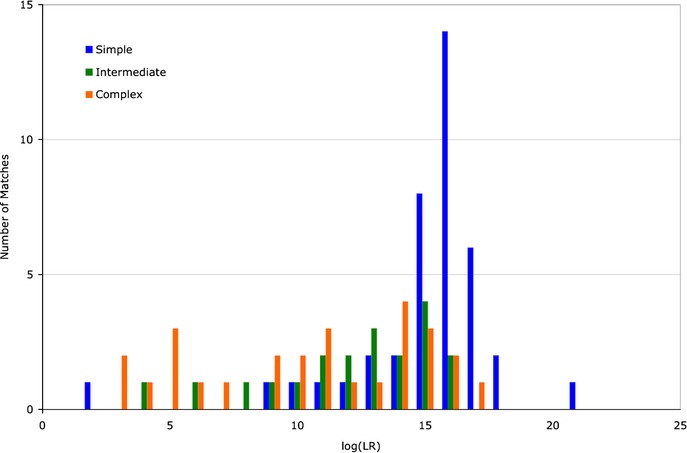
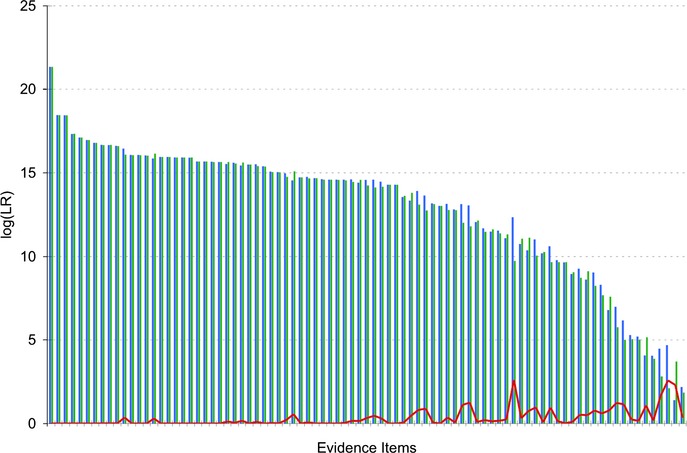
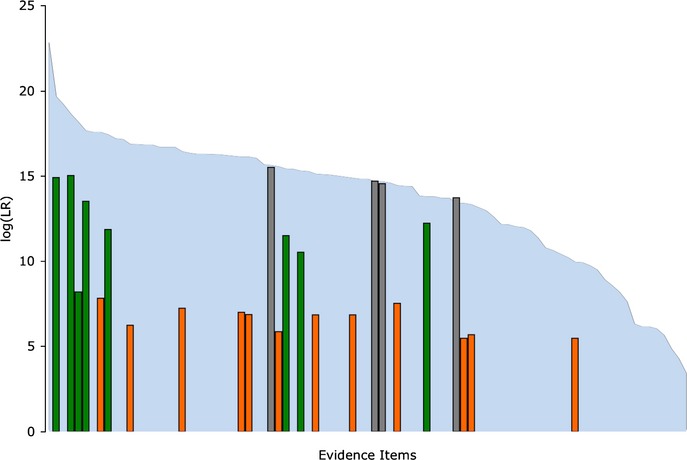
DNA evidence can pose interpretation challenges, particularly with low-level or mixed samples. It would be desirable to make full use of the quantitative data, consider every genotype possibility, and objectively produce accurate and reproducible DNA match results. Probabilistic genotype computing is designed to achieve these goals. This validation study assessed TrueAllele(®) probabilistic computer interpretation on 368 evidence items in 41 test cases and compared the results with human review of the same data. Whenever there was a human result, the computer's genotype was concordant. Further, the computer produced a match statistic on 81 mixture items (for 87 inferred matching genotypes) in the test cases, while human review reported a statistic on 25 of these items (30.9%). Using match statistics to quantify information, probabilistic genotyping was shown to be sensitive, specific, and reproducible. These results demonstrate that objective probabilistic genotyping of biological evidence can reliably preserve DNA identification information.

Keywords: DNA evidence; developmental validation; forensic science; identification information; likelihood ratio; mixture interpretation; probabilistic genotype.


Figures

Fig 1
Fig 1
Study mixture weights. The distribution of mixture weight over the case items' matched contributors is shown as a histogram. The x-axis is the TrueAllele-determined mixture weight of the matching contributor, binned in groups of 10% (i.e., 0–10%, 11–20%, etc.). The y-axis is the number of matches that fall within each mixture weight bin. The total number of counts (87) is the number of reported computer matches.
Fig 2
Fig 2
Genotype information sensitivity. The distribution of genotype match information (as inferred by TrueAllele) is shown as a log(LR) histogram of counts for each complexity category, with theta at 1%. The simple items (blue) are distributed more to the right than the intermediate items (green). The leftmost distribution is for the complex items (orange), which tend to be less informative.
Fig 3
Fig 3
Genotype information specificity. The distribution of genotype mismatch comparison information (as inferred by TrueAllele) is shown as a log(LR) histogram of counts for each complexity category, with theta at 1%. The simple items are most specific (blue), distributed more to the left than the intermediate items (green). The rightmost distribution is for the complex items (orange), which are the least specific.
Fig 4
Fig 4
Replicate genotype information. The inferred genotypes are sorted by descending match information, with theta at 1%. For each matched genotype, the first (blue bar) and second (green bar) independent TrueAllele computer runs' match statistics are shown on a log(LR) scale. The information difference between the two genotype replicates is shown (red line).
Fig 5
Fig 5
Computer versus human match information. The blue background shows the computer-inferred match information for each genotype, as in Fig.4. The foreground bars show logarithms of human match statistics obtained on the same DNA mixture genotypes. The human review methods used were conditional match probability (CMP) (gray), combined likelihood ratio (CLR) (green), and combined probability of inclusion (CPI) (orange). The TrueAllele LRs were calculated with theta at 0% for CLR and CPI and at theta = 3% for CMP, to correspond to the reported laboratory results.
Fig 6
Fig 6
Mixture weight comparison. The mixture weights of items having two contributors were determined by two different quantitative allele peak methods. TrueAllele used all of the peak height data at all loci in a Markov chain computation. Human calculation was made on a spreadsheet that used peak heights from alleles that could be separated by assumed contributor. A histogram of the differences is shown, with the x-axis showing the difference in inferred mixture weight between human and computer and the y-axis showing the number of such occurrences.
Fig 7
Fig 7
Mixture weight versus information. For each category, a scatter plot is shown of information versus mixture weight for all genotypes in that category. The (A) simple items tend to have more identification information and higher mixture weights than other items. The (B) intermediate items have less information and lower mixture weights, while the (C) complex items have the least information, on average. The likelihood ratio values were calculated with theta at 1%.

References

    1. Faigman DL, Kaye DH, Saks MJ, Sanders J. Science in the law: forensic science issues. St. Paul, MN: West Group; 2002.
    1. Butler JM. Forensic DNA typing: biology, technology, and genetics of STR markers. 2. New York, NY: Academic Press; 2005.
    1. Kadash K, Kozlowski BE, Biega LA, Duceman BW. Validation study of the TrueAllele® automated data review system. J Forensic Sci. 2004;49(4):1–8. - PubMed
    1. Perlin MW, Legler MM, Spencer CE, Smith JL, Allan WP, Belrose JL, et al. Validating TrueAllele® DNA mixture interpretation. J Forensic Sci. 2011;56(6):1430–47. - PubMed
    1. Curran JM, Buckleton J. Inclusion probabilities and dropout. J Forensic Sci. 2010;55(5):1171–3. - PubMed

Publication types

LinkOut - more resources