. 2013 Sep 30;219(1):142-54.
doi: 10.1016/j.jneumeth.2013.06.011. Epub 2013 Jul 15.

A coaxial optrode as multifunction write-read probe for optogenetic studies in non-human primates

Affiliations

A coaxial optrode as multifunction write-read probe for optogenetic studies in non-human primates

Ilker Ozden et al. J Neurosci Methods. .

Abstract

Background: Advances in optogenetics have led to first reports of expression of light-gated ion-channels in non-human primates (NHPs). However, a major obstacle preventing effective application of optogenetics in NHPs and translation to optogenetic therapeutics is the absence of compatible multifunction optoelectronic probes for (1) precision light delivery, (2) low-interference electrophysiology, (3) protein fluorescence detection, and (4) repeated insertion with minimal brain trauma.

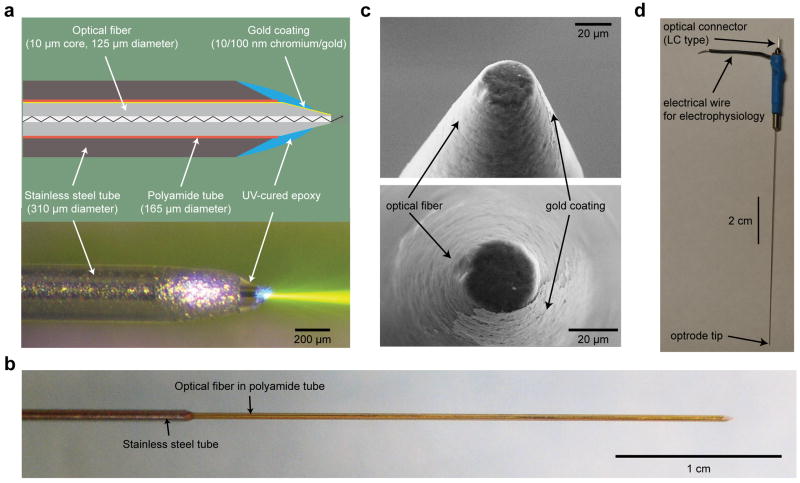
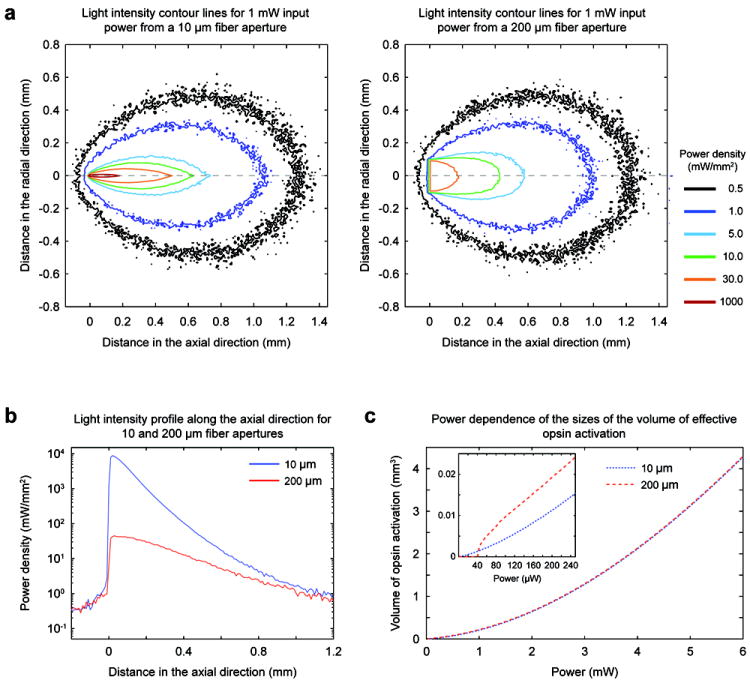
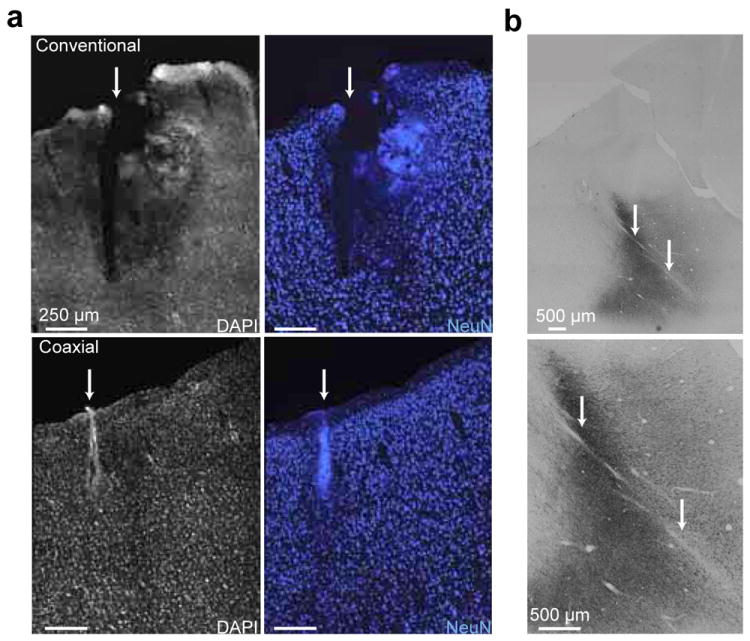
New method: Here we describe a novel brain probe device, a "coaxial optrode", designed to minimize brain tissue damage while microfabricated to perform simultaneous electrophysiology, light delivery and fluorescence measurements in the NHP brain. The device consists of a tapered, gold-coated optical fiber inserted in a polyamide tube. A portion of the gold coating is exposed at the fiber tip to allow electrophysiological recordings in addition to light delivery/collection at the tip.

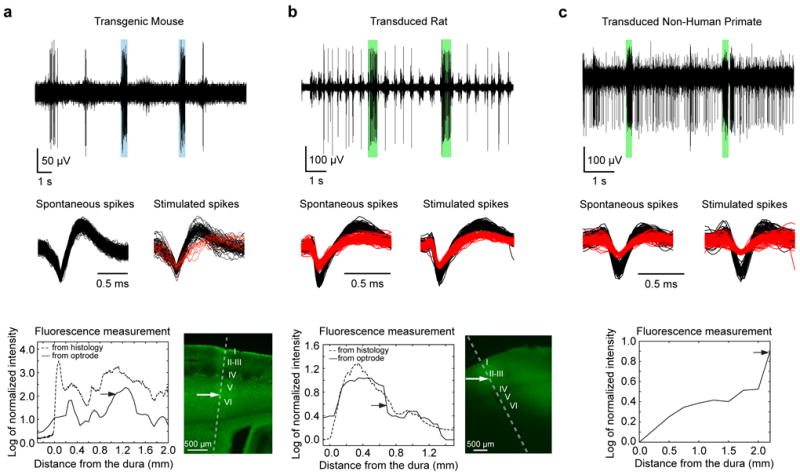
Results: Coaxial optrode performance was demonstrated by experiments in rodents and NHPs, and characterized by computational models. The device mapped opsin expression in the brain and achieved precisely targeted optical stimulation and electrophysiology with minimal cortical damage.

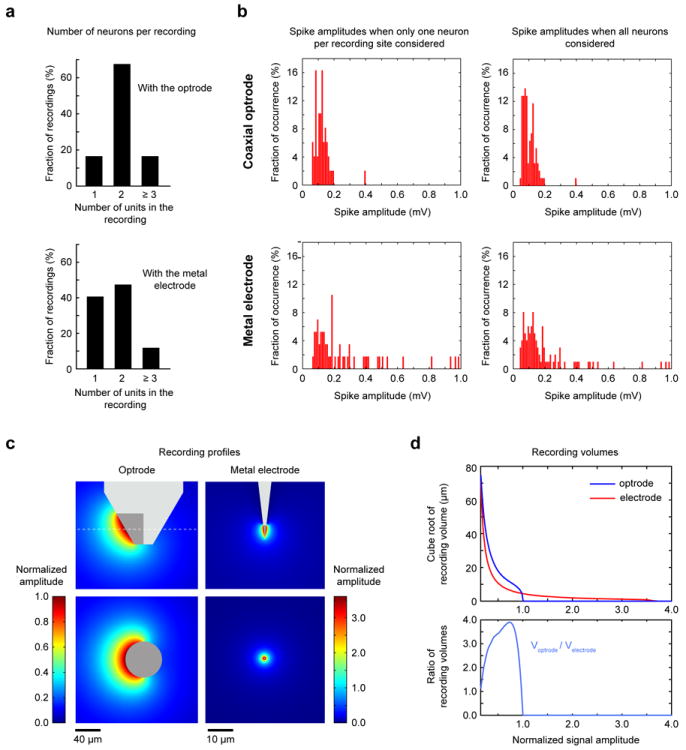
Comparison with existing methods: Overall, combined electrical, optical and mechanical features of the coaxial optrode allowed a performance for NHP studies which was not possible with previously existing devices.

Conclusions: Coaxial optrode is currently being used in two NHP laboratories as a major tool to study brain function by inducing light modulated neural activity and behavior. By virtue of its design, the coaxial optrode can be extended for use as a chronic implant and multisite neural stimulation/recording.

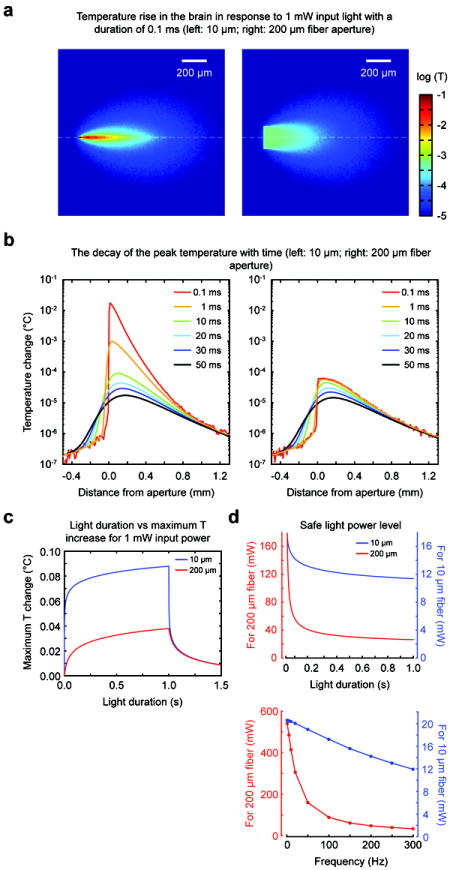
Keywords: Fluorescence detection; Light propagation in tissue; Non-human primates; Optoelectronic devices; Optogenetics; Tissue heating.


Figures

Figure 1
Figure 1. The structure of the coaxial optrode
(a) Cross sectional schematic (top) and side view photograph (bottom) of the coaxial optrode showing main constituent parts. The center optical fiber has a 10 μm diameter optical aperture (exposed core of the fiber) leading to highly directional light output as visualized in dye-doped saline. The saline contains ~1 μM fluorescein with fluorescence excited by 473 nm laser light (bottom). (b) A larger scale image of the device where the reinforcing thin stainless steel jacket (310 μm outer diameter) was kept few centimeters away from the tip leading to a thinner tissue penetrating portion of the shaft (diameter 165 μm). (c) Scanning electron microscope images of the coaxial optrode tip. The tip was polished to a flat circular tip of diameter 20-30 μm to separate the optical aperture from the surrounding gold recording electrode layer. This design reduced light-induced artifacts in the electrophysiological recordings to noise level. (d) Full length photograph of the coaxial optrode showing its electrical and optical connections at the distal end.
Figure 2
Figure 2. In vivo performance of the coaxial optrode
(a-c) Demonstrating the triple-functionality of the device in (a) an anesthetized mouse (transgenic Thy1-ChR2/YFP), (b) anesthetized rat (transduced with AAV5-CAMKIIα-C1V1-eYFP), and (c) awake behaving non-human primate (transduced with AAV5-CAMKIIα-C1V1-eYFP). The top panels in (a-c) show examples of optically modulated electrophysiological recordings from somatosensory cortices with blue and green bars indicating periods of light delivery (at 473 nm for the mouse and 561 nm for the rat and NHP cases, respectively). The recordings were acquired at depths indicated by arrows in the bottom panels. Light-induced increase in spiking activity is clearly visible in all recordings. The spike shapes of the isolated neurons (black and red traces in middle panels) were indistinguishable during spontaneous and optically-stimulated periods indicating that the activity of the recorded neurons was modulated by light. In case of the transgenic mouse, optical stimulation evoked spiking from another nearby neuron which was otherwise silent (column a, middle panel). The bottom panels (a-c, solid lines) show the fluorescence signal amplitudes (from YFP) collected as the device was advanced into the brain during the recording sessions (at 50 μm and 250 μm intervals in case of rodents and NHP, respectively). The fluorescence amplitudes were expressed as logarithm of the fluorescence intensity normalized to its value outside the brain. For comparison, fluorescence intensity profiles from histological sections (a-b, bottom right panels) at the sites of penetration are plotted as dashed lines. Except for the initial 200 μm distance from the dura, fluorescence profiles obtained from the coaxial optrode and histology were similar. The cortical layers are indicated with roman numbers to demonstrate the capability of the optrode to detect layer specific expression level. (Histological YFP fluorescence characterization was not performed in the case of the primates; see, however, Figure 6 related to NHP histology). Also note that although the viral injections in rats and NHPs were made at discrete targeted locations, the injection sites were not clearly tractable from the histological and fluorescence collection data since, under our injection conditions, the AAV-based gene delivery at a single site leads to a uniform gene expression within a region of radius more than 1 mm in the tissue, thereby averaging out any clear indication of individual injection sites.
Figure 3
Figure 3. Assessing electrophysiological recording capabilities of the coaxial optrode in comparison to a metal microelectrode (similar impedance value)
(a-b) Experimental comparison of the recording capabilities for the two devices. (a) The distribution of the number of identified neurons per recording for the coaxial optrode and metal electrode. (b) Distribution of spike amplitudes (top for the coaxial optrode, bottom for the metal electrode) when only the average spike-amplitudes of neurons with largest spikes at each recording were considered (left column), and when the average spike-amplitudes of all isolated neurons were considered (right column). (c-d) Comparison through numerical modeling of the recording capabilities of the two devices. (c) The spatial profiles of signal amplitudes recordable by the coaxial optrode (left column) and the metal electrode (right column) are shown as “heatmaps”. The maps in the top rows show the recorded field profiles projected on the plane in which the devices lie, whereas the bottom rows project the amplitude contours onto the perpendicular plane (indicated by dashed lines in the top rows). Note that color code scale for the coaxial optrode is about 3.58 times smaller than the one for the metal electrode. (d) The signal amplitudes for the coaxial optrode and metal electrode vs. the cube-root of the modeled volume (top). For better visualization, the volume is converted to “distance” by taking its cube-root. The ratio of recording volume for the coaxial optrode to that for the metal electrode for each chosen signal amplitude (bottom).
Figure 4
Figure 4. Numerical modeling of the light output pattern for the coaxial optrode (10 μm optical aperture) in comparison to a flat optical fiber (200 μm optical aperture)
(a) Intensity distributions for a total output power of 1 mW from the coaxial optrode (left) and the larger aperture fiber (right). The iso-intensity curves were obtained by Monte Carlo simulations applied to a homogenous medium with absorptive and scattering properties those of cortex. (b) Intensity profiles along the axial (z) propagation direction. (c) Dependence of the effective volumes of opsin excitation on optical power assuming 1 mW/mm2 as sufficient intensity to exceed excitation threshold for opsin expressing neurons (blue and red dashed curves for the coaxial optrode and fiber, respectively). The inset plot shows the excitation volumes at low power regime.
Figure 5
Figure 5. Tissue heating when comparing the coaxial optrode (10 μm optical aperture) with flat optical fiber (200 μm optical aperture)
(a) Maps of temperature rise in tissue in response to a 1 mW light pulse of 0.1 ms “impulse” delivered through the coaxial optrode (left) and the fiber (right). (b) The temperature rise profile along the axial (z) direction following the light impulse (left for the coaxial optrode, right for the fiber). The curves with different colors correspond to different times after the light impulse. (c) The dependence of the temperature rise to representative experimental pulse durations up to 1 s. The cooling of the tissue by diffusive transport is evident in portions of the curves after 1 s (x-axis). (d) The dependence of the estimated safe power levels on optical pulse duration (top) and frequency (bottom). The frequency calculations were made by assuming that each optical event was 3 ms long and applied as a pulse train at the specified frequencies for 1 s. The safe power levels were calculated by assuming that 1°C rise in temperature is acceptable (from regulations by FDA on RF energy deposition generated during MRI). The safe power limits were 11.4 mW and 26.3 mW for 10 μm and 200 μm apertures, respectively, for a light pulse of 1 s duration. In case of trains of light pulses, few selections were 20.4 mW and 408.8 mW for 10 Hz, 19.0 mW and 154.6 mW for 100 Hz, and 13.1 mW and 34.9 mW for 250 Hz for 10 μm and 200 μm apertures, respectively.
Figure 6
Figure 6. Comparison of brain tissue damage induced by the coaxial and dual-pronged optrodes after penetrations
(a) Upper images are from dual-pronged optrode insertion. Lower images are from coaxial optrode insertion. Images on the left display tissue stained with 4’,6-diamidino-2-phenylindole (DAPI), a non-specific marker for DNA. Images on the right display tissue stained with NeuN, a marker for neurons. (b) Histological images (low and high magnification at the top and bottom, respectively) of the somatosensory cortex from a macaque. The dark regions are where the opsin C1V1 is expressed as reveled by anti-YFP immunostaining. This region was penetrated more than 30 times with the coaxial optrode over a six months period. The optrode tracks are indicated by white arrows. The full tracks are not visible in these images since the coronal histological sections were not parallel to the optrode track.

References

    1. Anikeeva P, Andalman AS, Witten I, Warden M, Goshen I, Grosenick L, Gunaydin LA, Frank LM, Deisseroth K. Optetrode: a multichannel readout for optogenetic control in freely moving mice. Nat Neurosci. 2012;15:163–70. - PMC - PubMed
    1. Aravanis AM, Wang LP, Zhang F, Meltzer LA, Mogri MZ, Schneider MB, Deisseroth K. An optical neural interface: in vivo control of rodent motor cortex with integrated fiberoptic and optogenetic technology. J Neural Eng. 2007;4:S143–56. - PubMed
    1. Ayling OG, Harrison TC, Boyd JD, Goroshkov A, Murphy TH. Automated light-based mapping of motor cortex by photoactivation of channelrhodopsin-2 transgenic mice. Nat Methods. 2009;6:219–24. - PubMed
    1. Binding J, Ben Arous J, Leger JF, Gigan S, Boccara C, Bourdieu L. Brain refractive index measured in vivo with high-NA defocus-corrected full-field OCT and consequences for two-photon microscopy. Opt Express. 2011;19:4833–47. - PubMed
    1. Cardin JA, Carlen M, Meletis K, Knoblich U, Zhang F, Deisseroth K, Tsai LH, Moore CI. Targeted optogenetic stimulation and recording of neurons in vivo using cell-type-specific expression of Channelrhodopsin-2. Nat Protoc. 2010;5:247–54. - PMC - PubMed

Publication types

MeSH terms