. 2013 Jul 15;26(1):59-72.
doi: 10.1016/j.devcel.2013.06.005.

Otx2 and Onecut1 promote the fates of cone photoreceptors and horizontal cells and repress rod photoreceptors

Affiliations

Otx2 and Onecut1 promote the fates of cone photoreceptors and horizontal cells and repress rod photoreceptors

Mark M Emerson et al. Dev Cell. .

Abstract

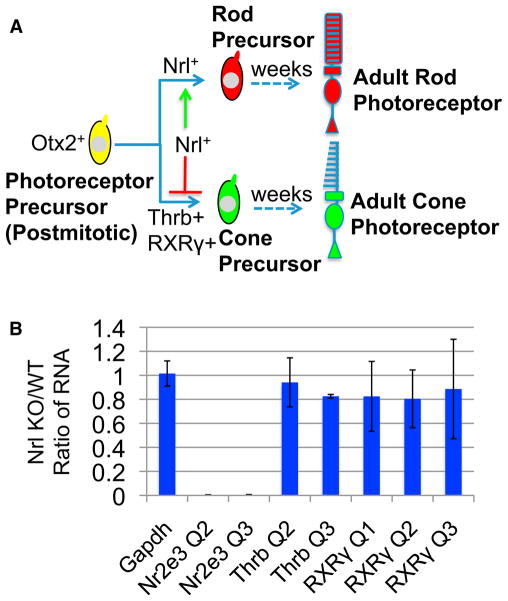
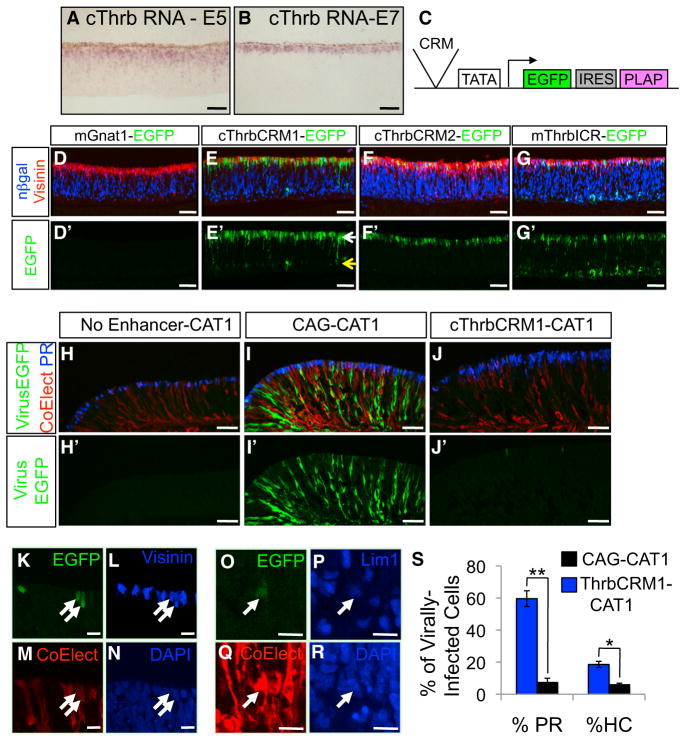
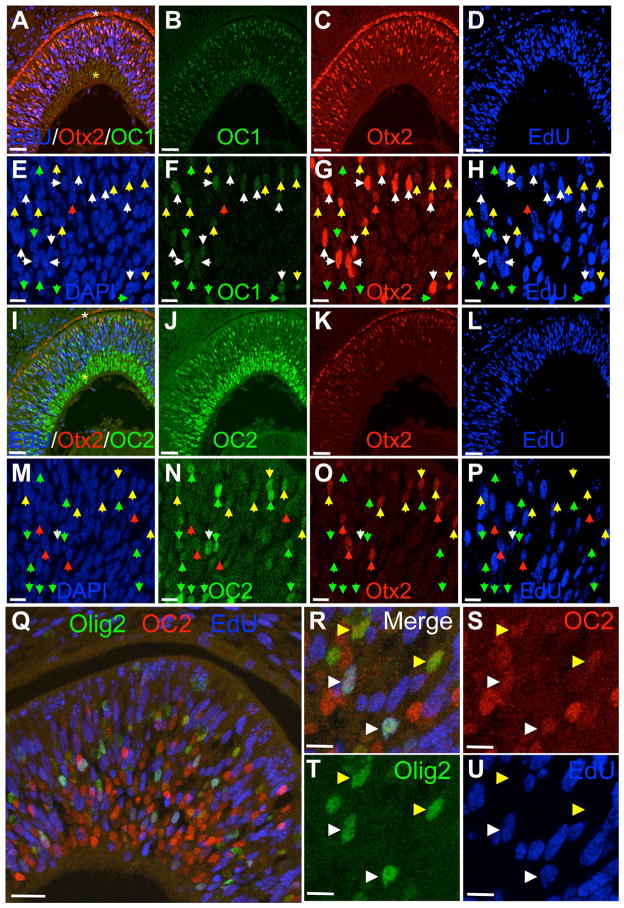
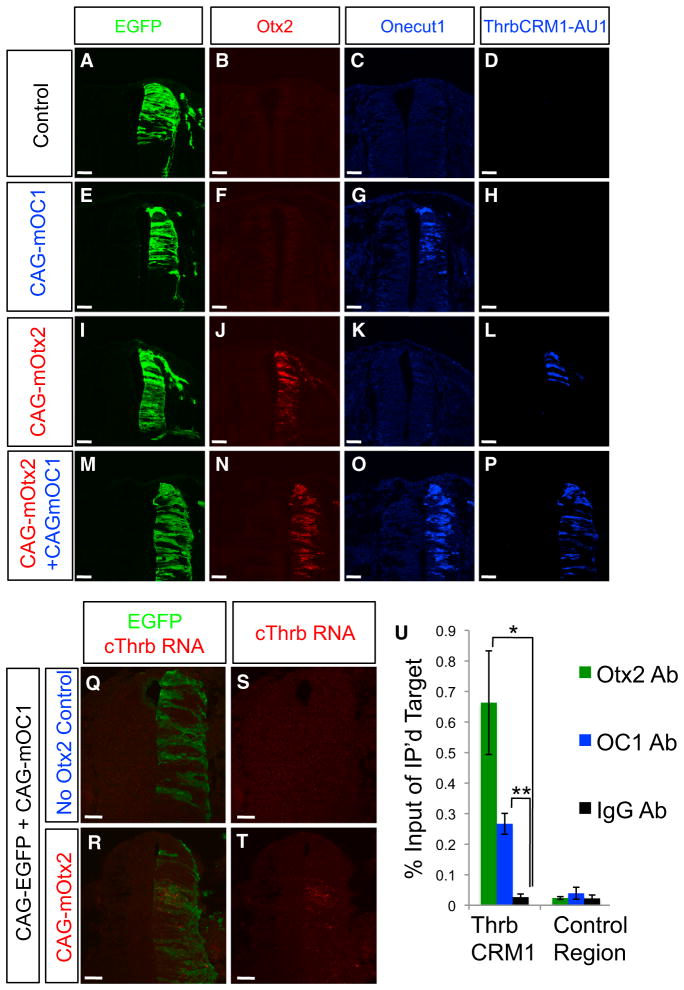
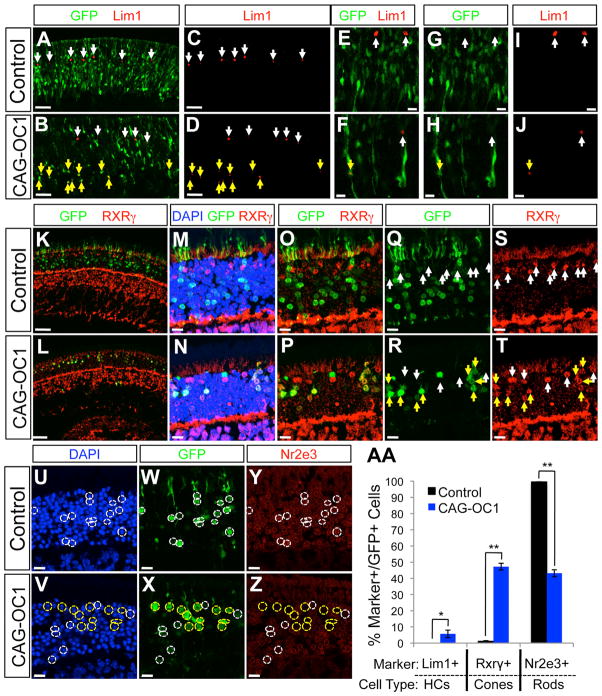
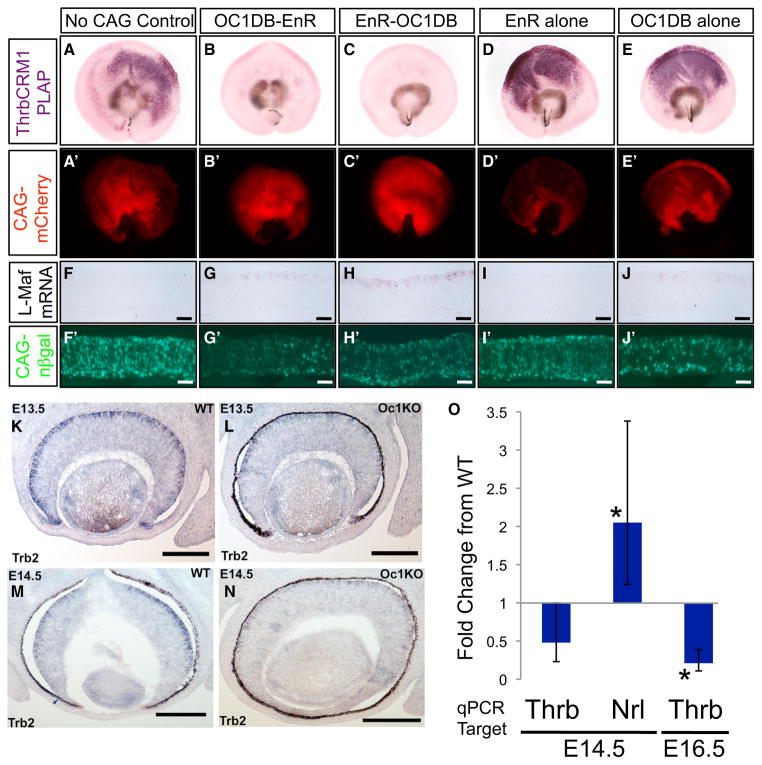
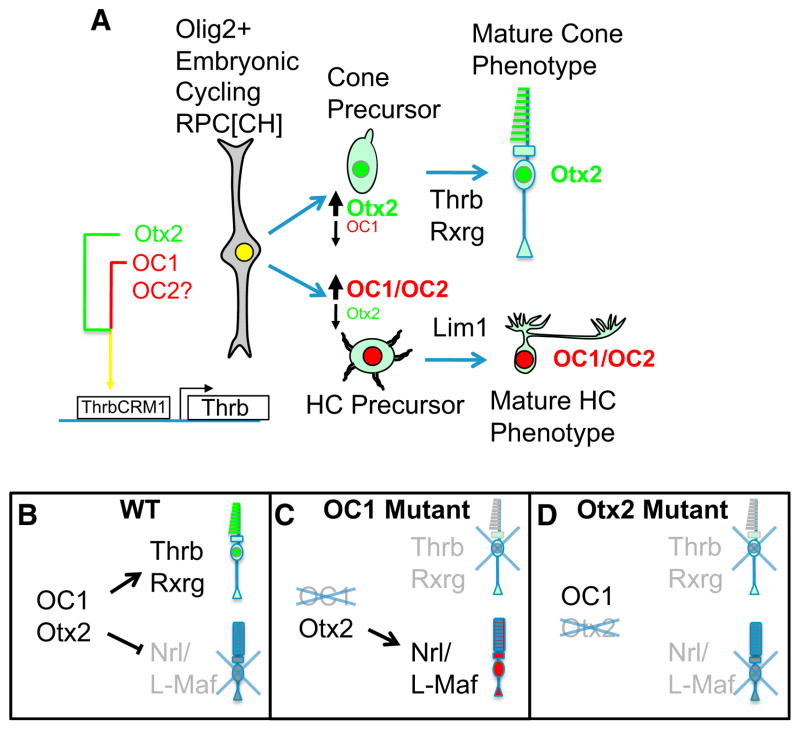
Cone photoreceptors carry out phototransduction in daylight conditions and provide the critical first step in color vision. Despite their importance, little is known about the developmental mechanisms involved in their generation, particularly how they are determined relative to rod photoreceptors, the cells that initiate vision in dim light. Here, we report the identification of a cis-regulatory module (CRM) for the thyroid hormone receptor beta (Thrb) gene, an early cone marker. We found that ThrbCRM1 is active in progenitor cells biased to the production of cones and an interneuronal cell type, the horizontal cell (HC). Molecular analysis of ThrbCRM1 revealed that it is combinatorially regulated by the Otx2 and Onecut1 transcription factors. Onecut1 is sufficient to induce cells with the earliest markers of cones and HCs. Conversely, interference with Onecut1 transcriptional activity leads to precocious rod development, suggesting that Onecut1 is critically important in defining cone versus rod fates.


Figures

Figure 1
Figure 1. Examination of Photoreceptor mRNA Levels in Nrl Knockout Retinas
(A) A current model of photoreceptor specification (based on Swaroop et al., 2010). (B) qPCR analysis of mRNA for rod and cone genes in retinal complementary DNA from P0 using the qPCR primer pairs for the gene noted along the x axis. The y axis represents the fold difference of relative RNA levels between WT and Nrl KO mice. Error bars represent SD.
Figure 2
Figure 2. Identification and Analysis of Thrb CRMs
(A and B) RNA in situ hybridization for cThrb at E5 (A) and E7 (B) in central chicken retina. (C) Schematic of the Stagia3 reporter vector. (D–G) E5 retinas were coelectroporated with CAG-nβ-gal plasmids and Stagia3 plasmids, cultured for 2 days, sectioned, and immunohistochemically stained with αEGFP (green), αVisinin (red), and αβ-gal (blue). The electroporated Stagia3 reporter is shown above each column of images. (D′–G′) EGFP channels alone of the above images. The white arrow in E′ shows the position of GFP+ cells just vitread to the scleral surface, and the yellow arrow shows the GFP+ cells just sclerad to the vitreal surface. (H–J) Analysis of RPC progeny that express ThrbCRM1. Antigens detected were EGFP (green), AU1 (red), and Visinin (blue). The CAT1 plasmids used are shown at the top of each column. (H′–J′) EGFP channels alone of the images in (H)–(J). (K–R) Magnified views of ThrbCRM1-CAT1 retinas detected for viral EGFP (K and O), Visinin (L), AU1 (coelectroporation control) (M and Q), DAPI (N and R), and Lim1 (P). (S) Percentage of virally transduced EGFP-positive cells that were identified as photoreceptors (Visinin+) or HCs (Lim1+) in retinas with the ThrbCRM1-CAT1 (blue bars) or CAG-CAT1 elements (black bars). Values represent the average of the data from three biological replicates. Error bars represent SEM. A two-tailed t test was used to assess statistical significance (**p < 0.001; *p < 0.005). Scale bar represents 40 μm for (A), (B), (D)–(G), (D′)–(G′), (H)–(J), and (H)′–(J′) and 10 μm for (K–R). See also Figures S1 and S2.
Figure 3
Figure 3. Otx2 Is Coexpressed with Onecut1 and Onecut2 in Mouse RPCs, and Onecut2 Is Expressed in Embryonic Olig2+ RPCs
E13.5 mouse retinas were exposed in utero to EdU for 2.5 hr before harvest and immunohistochemical analysis. (A–D) Sections were imaged for OC1 (green), Otx2 (red), EdU (blue), and DAPI (not shown). Shown is (A) a merge of the three channels, (B) OC1, (C) Otx2, and (D) EdU. (E–H) Single z-plane images of each channel as denoted. Green arrows (OC1+ only), red arrows (Otx2+ only), yellow arrows (Otx2+/OC1+), and white arrows (Otx2+/OC1+/EdU+) point to specific cells. The white asterisk marks Otx2+ RPE, and the yellow asterisk marks the OC1+ retinal ganglion cell layer. (I–P) Same as in (A)–(H) but imaged for OC2 (green) instead of OC1. (Q) Imaged for Olig2 (green), OC2 (red), and EdU (blue). (R–U) High-magnification view of retina processed as in (Q), with channels denoted. The white arrows (Olig2+/OC2+/EdU+) and yellow arrows (Olig2+/OC2+) point to specific cells. Scale bar represents 40 μm for (A)–(D), (I)–(L), and (Q) and 10 μm for (E)–(H), (M)–(P), and (R)–(U). See also Figure S3.
Figure 4
Figure 4. Effects of Spinal Cord Misexpression of mOC1 and mOtx2 on the ThrbCRM1 Reporter and cThrb Endogenous Gene Expression
(A–P) Chicken spinal cords were electroporated with CAG-EGFP and ThrbCRM1-AU1, and the misexpression plasmid is listed to the left of each row. Spinal cord sections were processed for detection of EGFP (green), Otx2 (red), OC1 (blue), and AU1 (blue). (Q and R) Spinal cords were electroporated with the plasmids shown to the left of the rows and processed for detection of cThrb RNA (red) and EGFP (green). (S and T) Shown is the cThrb RNA signal alone. Dorsal is the top of the section. Similar results were found for n ≥ 3 spinal cords for each experiment. (U) A graph of the amount of the target DNA region noted on the x axis immunoprecipitated by antibodies to Otx2 (green bars), OC1 (blue bars), and normal rabbit IgG (black bars). The y axis represents the amount immunoprecipitated as a percentage of the total chromatin input. Bars represent the averages of three biological replicates for each condition. Error bars represent SEM. A two-tailed t test showed statistically significant differences between some samples (*p < 0.02; **p < 0.005). Scale bar represents 40 μm. See also Figure S4.
Figure 5
Figure 5. mOC1 Misexpression in the Postnatal Mouse Retina Induces HC and Cone Gene Expression and Inhibits Rod Differentiation
Mouse P0 retinas were electroporated in vivo with CAG-EGFP, with or without CAG-mOC1. The channels shown in each panel are denoted at the top of each column and the presence or absence of mOC1 to the left of each row. (A–J) Shown are retinas harvested at P4. The white arrows point to Lim1+ cells that were not electroporated (EGFP−), corresponding to the normally generated HCs, and the yellow arrows point to EGFP+/Lim1+ cells. (E–J) High-magnification single z-section images. (K–T) Shown are retinas harvested at P30. The white arrows point to RXRγ+ cells that were not electroporated (EGFP−), corresponding to normally generated cones, and the yellow arrows point to EGFP+/RXRγ+ cells. (U–Z) Shown are retinas harvested at P30. White dotted lines encompass EGFP+/Nr2e3+ nuclei and yellow dotted lines GFP+/Nr2e3− nuclei. (AA) Quantitation of the overlap of CAG-GFP with the marker listed along the x axis in either control (black bars) or CAG-OC1 (blue bars) electroporated retinas (as in A–Z). The cell type normally associated with that marker expression and location is given below the markers. Values represent the percentage of marker-positive cells among the GFP-positive cells (for Nr2e3 and RXRγ, only the ONL population was counted) and are the average from three retinas. Error bars represent SEM. Statistical significance was determined by t test (*p < 0.05 using a one-tailed t test; **p < 0.0001 using a two-tailed t test). Scale bar represents 10 μm in (E)–(J), (M)–(T), and (W)–(D′) and 40 μm in (A)–(D), (K), (L), (U), and (V).
Figure 6
Figure 6. Interference with Onecut Transcriptional Activity in Both Chickens and Mice Leads to Downregulation of ThrbCRM1/Thrb mRNA Expression and Upregulation of Rod Photoreceptor Gene Nrl/L-Maf
(A–E) E5 chicken retinas were electroporated with CAG-mCherry, ThrbCRM1-PLAP, and the CAG construct noted at the top of each column and developed for PLAP activity 2 days later. (A′–E′) CAG-mCherry visualization of the retinas shown above. (F–J) E5 retinas were electroporated with CAG-nβ-gal (and the CAG construct is shown at the top of each column), cultured for 3 days, and processed for RNA in situ hybridization to detect L-Maf as shown by alkaline phosphatase staining. Biological replicates and experiments with a different probe to L-Maf gave the same result. (F′–J′) β-gal expression for the sections in (F)–(J). (K–N) RNA in situ hybridization to detect mThrb expression in the embryonic retina of WT (K and M) and OC1 KO mice (L and N) at E13.5 and E14.5. (O) qPCR analysis of Thrb and Nrl expression in the embryonic retinas graphed as the fold change of the RNA listed along the x axis in OC1 KO mice relative to WT mice at E14.5 and E16.5. Error bars represent SEM. N ≥ 3 animals per genotype. Asterisks denote p < 0.01 using a two-tailed t test. Scale bar represents 25 μm for (F)–(J) and (F′)–(J′) and 100 μm for (K–N). See also Figure S5.
Figure 7
Figure 7. Models for the Roles of Otx2 and Onecut Factors in Horizontal Cell and Photoreceptor Genesis
(A) A model for OC1 and Otx2 action in the retina is shown. The RPC[CH] divides to give rise to cones and HCs. In cone precursor cells, the level of OC1 declines and Otx2 is maintained while in HC precursors, the level of OC1 increases and Otx2 decreases. OC2 may be functionally redundant with OC1 in RPC[CH]s. (B) In WT RPCs, coexpression of Otx2 and OC1 promotes cone genesis (green cells) and inhibits rod genesis (red cells). (C) In OC1 mutants, rod genesis is promoted and cone genesis is impaired. (D) In Otx2 mutants, all photoreceptor genesis is inhibited and amacrine cells are generated instead.

References

    1. Akimoto M, Cheng H, Zhu D, Brzezinski JA, Khanna R, Filippova E, Oh ECT, Jing Y, Linares JL, Brooks M, et al. Targeting of GFP to newborn rods by Nrl promoter and temporal expression profiling of flow-sorted photoreceptors. Proc Natl Acad Sci USA. 2006;103:3890–3895. - PMC - PubMed
    1. Albritton LM, Tseng L, Scadden D, Cunningham JM. A putative murine ecotropic retrovirus receptor gene encodes a multiple membrane-spanning protein and confers susceptibility to virus infection. Cell. 1989;57:659–666. - PubMed
    1. Brzezinski JA, 4th, Kim EJ, Johnson JE, Reh TA. Ascl1 expression defines a subpopulation of lineage-restricted progenitors in the mammalian retina. Development. 2011;138:3519–3531. - PMC - PubMed
    1. Carter-Dawson LD, LaVail MM. Rods and cones in the mouse retina. II Autoradiographic analysis of cell generation using tritiated thymidine. J Comp Neurol. 1979;188:263–272. - PubMed
    1. Chen J, Rattner A, Nathans J. The rod photoreceptor-specific nuclear receptor Nr2e3 represses transcription of multiple cone-specific genes. J Neurosci. 2005;25:118–129. - PMC - PubMed

Publication types

MeSH terms

LinkOut - more resources