. 2013:4:2181.
doi: 10.1038/ncomms3181.

Tracking axonal action potential propagation on a high-density microelectrode array across hundreds of sites

Affiliations

Tracking axonal action potential propagation on a high-density microelectrode array across hundreds of sites

Douglas J Bakkum et al. Nat Commun. 2013.

Abstract

Axons are traditionally considered stable transmission cables, but evidence of the regulation of action potential propagation demonstrates that axons may have more important roles. However, their small diameters render intracellular recordings challenging, and low-magnitude extracellular signals are difficult to detect and assign. Better experimental access to axonal function would help to advance this field. Here we report methods to electrically visualize action potential propagation and network topology in cortical neurons grown over custom arrays, which contain 11,011 microelectrodes and are fabricated using complementary metal oxide semiconductor technology. Any neuron lying on the array can be recorded at high spatio-temporal resolution, and simultaneously precisely stimulated with little artifact. We find substantial velocity differences occurring locally within single axons, suggesting that the temporal control of a neuron's output may contribute to neuronal information processing.


Conflict of interest statement

Competing financial interests: The authors declare no competing financial interests.

Figures

Figure 1
Figure 1. Immunofluorescent images of neurons grown over the array and their spontaneous electrical signals.
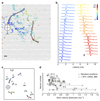
(a) Fluorescence image of an isolated neuron’s soma and dendrites stained with MAP2. Black rectangles highlight one column of electrodes located underneath the neuron and are plotted to scale (8.2 × 5.8 µm2 per electrode). Scale bar, 20 µm. (b) Fluorescence image of a cluster of neurons and one highlighted column of electrodes (black rectangles). Scale bar, 20 µm. (c) Spatial distribution of action potential waveforms for the neuron in a, termed a footprint. Ten peak-aligned spikes were averaged for electrodes from all columns. The highlighted column shown in a is plotted in grey in c. Scale bars, 2 ms horizontal and 200 µV vertical. (d,e) Voltage traces recorded on the electrodes marked by rectangles in a and b, respectively, during a network burst. The isolated neuron produced clear individual spikes detected on multiple electrodes (d), whereas the cluster of neurons produced overlapping spikes (e). Shrinkage during the cell fixation process or cell movement before fixation may cause some misalignment between the recorded activity and cell locations. Scale bars, 10 ms horizontal and 400 µV vertical.
Figure 2
Figure 2. Biphasic voltage stimulation saturated signals only on nearby recording electrodes.
(a) The duration of a saturated signal occurring after stimuli is plotted versus distance from the stimulation electrode (mean ± s.e.m.; N = 18 stimulation electrodes from five CMOS-based MEAs). Stimuli consisted of biphasic voltage pulses between 100 and 200 µs duration per phase and between ±400 and 800 mV amplitude. On an average, signals on <1% of the electrodes become saturated after a stimulus. (b) A raw voltage trace recorded at an electrode neighbouring a stimulation electrode saturated for about 4 ms (flat line). The stimulus was applied at time zero. (c) A raw voltage trace recorded at an electrode located 1.46 mm away from a stimulation electrode did not saturate; the signal during stimulation was blanked in software before recording. Synaptic activity was pharmacologically blocked (see Methods), demonstrating that the stimulus directly evoked an action potential that antidromically propagated until evoking the exceptionally large somatic action potential plotted here.
Figure 3
Figure 3. Stimuli activated neural tissue with high spatial precision.
(a) Locations of stimulation electrodes that directly evoked (black boxes) or did not evoke (empty or filled grey boxes) action potentials detected at a soma located ~890 mm away. Electrodes are plotted to scale 8.2 x 5.8 µm2, and the electrode numbering and line arrow indicate the orthodromic propagation direction. Scale bar, 20 µm. (b) Location of the soma (grey crosshair) with respect to the stimulation electrodes (black line) and the geometry of the array (box). Scale bar, 200 µm. (c) Voltage traces of somatic action potentials elicited by biphasic voltage stimuli. Traces in response to eight stimuli are overlaid for each of three stimulation magnitudes (indicated at the top), plotted for all effective (black) and four ineffective stimulation sites (grey at the bottom). Stimulation electrode locations are represented as numbered boxes in a. Towards the end of the experiment, the algorithm that randomly sets electrode configurations took progressively longer to route the remaining electrodes. Therefore, owing to time considerations, not all electrodes were selected (that is, black electrode 3 in the first column and grey electrode 3 in the last column). Scale bar, 200 µV.
Figure 4
Figure 4. Antidromic and orthodromic action potentials and velocities.
(a) Mean voltages calculated from 60 stimulation trials along a pathway for a neuron bathed in standard media (left) and media supplemented by the synaptic receptor antagonists 2-amino-5-phosphonovaleric acid (APV), CNQX and bicuculline methiodide (BMI; right; see Methods). Heat maps from 95 electrodes and a subset of their averaged raw traces plotted next to the heat maps show a propagating antidromic action potential, subsequent somatic depolarization (green) and an action potential rebounding from the soma (highlighted in blue). Arrows indicate the propagation direction and yellow bolts indicate the stimulation time. Scale bars, 1 ms horizontal; 100 µV vertical. (b) A footprint of the pathway stitched together from 17 adjacent recording configurations represented by the peak-to-peak median voltage at each electrode (grey scale pixels). Red circles denote locations of the subset of traces in a, with synaptic antagonists. Scale bar, 100 µm. (c) Velocities from ac without (black) and with (red) synaptic antagonists calculated by using a bootstrapping procedure (mean±s.d.; N=1000 bootstrap estimates from re-sampling with replacement; dots above the plot indicate significant differences, P-value <10– 3, Mann–Whitney U-test). (d) Velocity profiles (colour) along the propagation pathway without (left) and with (right) synaptic antagonists. (eg) The same analysis was performed for an orthodromic action potential recorded in a single-electrode configuration. Propagation continued into two branches (‘East’ and ‘South’). The red cross in g indicates the stimulation electrode located near the soma, and arrows indicate the propagation direction. Scale bars, 1 ms in e and 100 µm in g. See also Supplementary Movie 2.
Figure 5
Figure 5. Velocity differences existed between neighbouring segments.
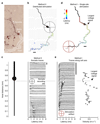
(a) Live-cell images of a neuron expressing red fluorescent protein (RFP) were taken between DIV 20 and DIV 22. The axonal trunk is highlighted for clarity. Images are a montage of two frames. Scale bar, 40 µm. (b) Stimuli were repeatedly applied to a single electrode (stimulation location indicated by the yellow bolt) over 3 days (repeated once on DIV 22 at a different site a few minutes later; see (i) and (ii)), whereas a series of eight recording configurations were scanned across the axon. Velocities were measured at two isolated sections of the axon (mean ± s.d.; N = 1,000 bootstrap estimates from re-sampling with replacement; asterisks denote significant differences, and P-value <10− 3 for every combination, Mann–Whitney U-test). The recording electrodes are marked by black and grey rectangles, and the antidromic propagation direction is shown by arrows. Scale bar, 40 µm. (c) Mean voltages from 90 stimulation trials were used to calculate the relative action potential timing (red bars) at the recording electrodes numbered in b. Stimulation artifact was removed by subtracting a curve fit to the signal (Supplementary Fig. S4). Scale bar, 5 µV. See also Supplementary Movie 3.
Figure 6
Figure 6. Extracellular detection of propagating action potentials and the effect of averaging.
(a) Examples of elicited tri-, bi- and mono-phasic spikes detected at three sites (columns) along the same axon. The top row shows individual raw traces, and the other rows show traces averaged as indicated. Scale bars, 1 ms horizontal, 10 μV vertical. (b) The amount of averaging necessary to detect a spike with a given height (0.5–3σ) with respect to the detection threshold; note that 5σnoise is a common threshold to reliably detect somatic spikes. The number of trials necessary to average is equal to the square of the detection threshold divided by the spike height: N = (T/H)2.
Figure 7
Figure 7. Spatio-temporal reconstruction of segments of a neuronal arbour.
(a) Stimulated electrodes are plotted that evoked (coloured by median latency until detection of somatic action potentials) or did not evoke (light grey) somatic action potentials at the crosshair (its radius indicates the approximate area affected by saturated signals after a stimulus; see Fig. 2a). Scale bar, 100 µm. (b) Somatic action potentials evoked by stimuli applied to different electrodes (rows) along two putative arbour pathways (dark grey in (a)). Colour again represents latency but also maps electrodes to their positions in a. Scale bar, 200 µV. (c) Locations of arbour sections of the neuron in a used to calculate velocities in the colour-matched circles in d, numbered by increasing velocity. (d) Propagation velocities estimated by a linear regression of distance versus latency from 89 arbour sections (circles in standard conditions; crosses when synaptic activity was blocked) from 12 neurons (horizontal lines, colour matches (ac); R2 values were 0.93 mean ± 0.08 s.d.; N = 89). See also Supplementary Movie 4.
Figure 8
Figure 8. Both methods applied to track an axon of a red fluorescent protein (RFP)-expressing neuron.
(a) Live-cell image at DIV 21 of a neuron transfected with RFP at DIV 17. The axonal trunk is highlighted for clarity. The image is a montage of three frames. Scale bar, 40 µm. (b) Stimulated electrodes that evoked (coloured by median latency until action potential detection) or did not evoke (light grey) ‘somatic’ action potentials at the crosshair (its radius indicates the approximate area affected by saturated signals after a stimulus; see Fig. 2). Scale bar, 40 µm. (c) Overlaid voltage traces recorded at the soma in response to stimuli applied along the main axonal and dendritic trunks. Stimulation electrode locations are the same as the recording electrode locations indicated by dots in d. Scale bar, 400 µV. (d) Stimuli were repeatedly applied to a single electrode (red cross), whereas a series of 12 recording configurations were scanned across the neuron. Latencies (colour) with respect to the largest voltage signal (arrow) are plotted for detected action potentials. Scale bar, 40 µm. (e) Mean voltages from 90 stimulation trials recorded along the main axonal and dendritic trunks and soma. Recording electrode locations are indicated in d. Velocities were calculated by using a bootstrapping procedure (mean±s.d.; N=1,000 bootstrap estimates from re-sampling with replacement). Scale bar, 400 µV. See also Supplementary Movie 5.

References

    1. Shu Y, Hasenstaub A, Duque A, Yu Y, McCormick DA. Modulation of intracortical synaptic potentials by presynaptic somatic membrane potential. Nature. 2006;441:761–765. - PubMed
    1. Alle H, Geiger JR. Combined analog and action potential coding in hippocampal mossy fibers. Science. 2006;311:1290–1293. - PubMed
    1. Sasaki T, Matsuki N, Ikegaya Y. Action-potential modulation during axonal conduction. Science. 2011;331:599–601. - PubMed
    1. Bakkum DJ, Chao ZC, Potter SM. Long-term activity-dependent plasticity of action potential propagation delay and amplitude in cortical networks. PLoS One. 2008;3:e2088. - PMC - PubMed
    1. Izhikevich EM. Polychronization: computation with spikes. Neural Comput. 2006;18:245–282. - PubMed

Publication types