. 2013:3:2240.
doi: 10.1038/srep02240.

Acinetobacter phage genome is similar to Sphinx 2.36, the circular DNA copurified with TSE infected particles

Affiliations

Acinetobacter phage genome is similar to Sphinx 2.36, the circular DNA copurified with TSE infected particles

Toshisangba Longkumer et al. Sci Rep. 2013.

Abstract

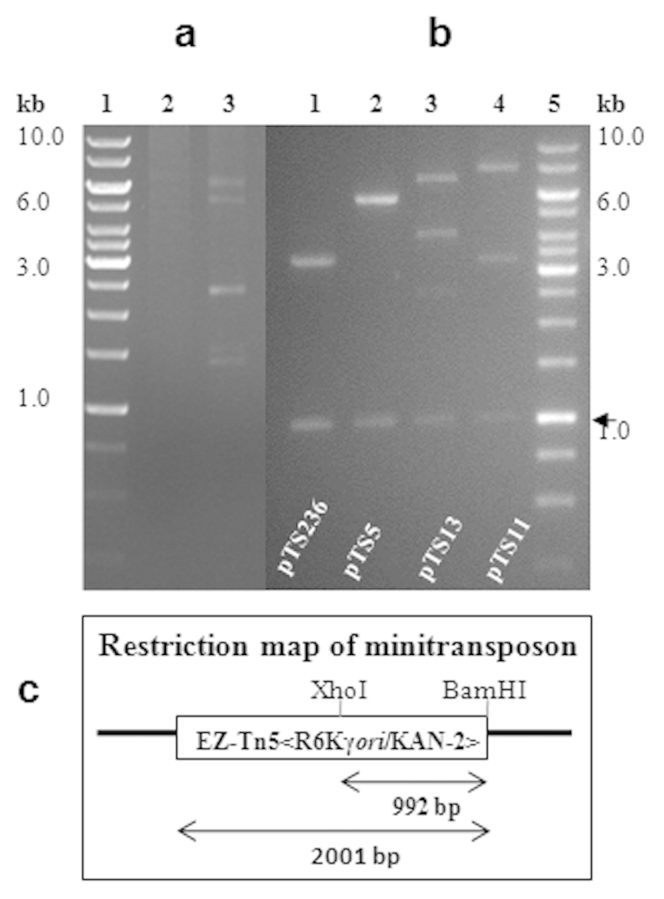
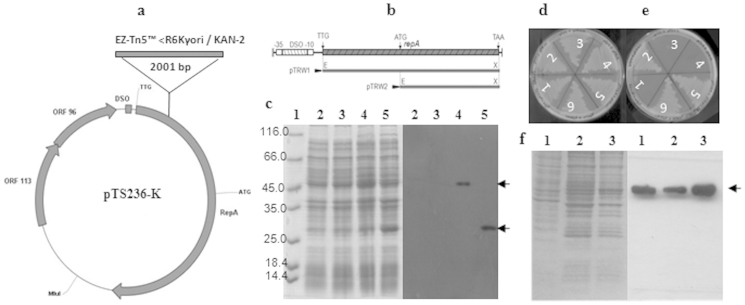
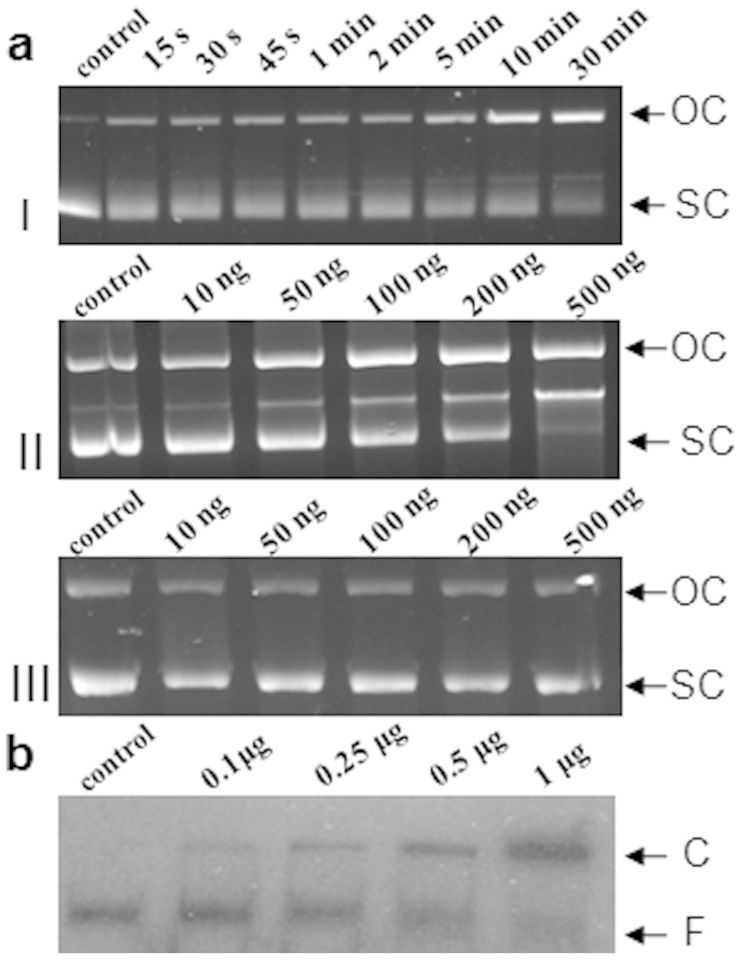
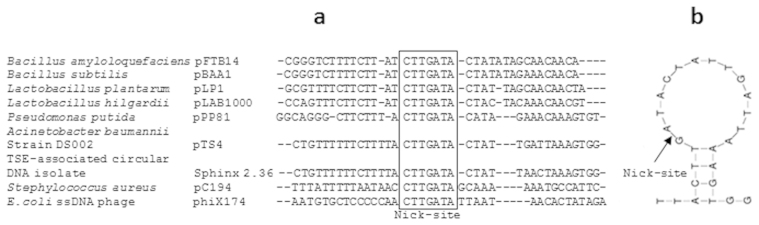
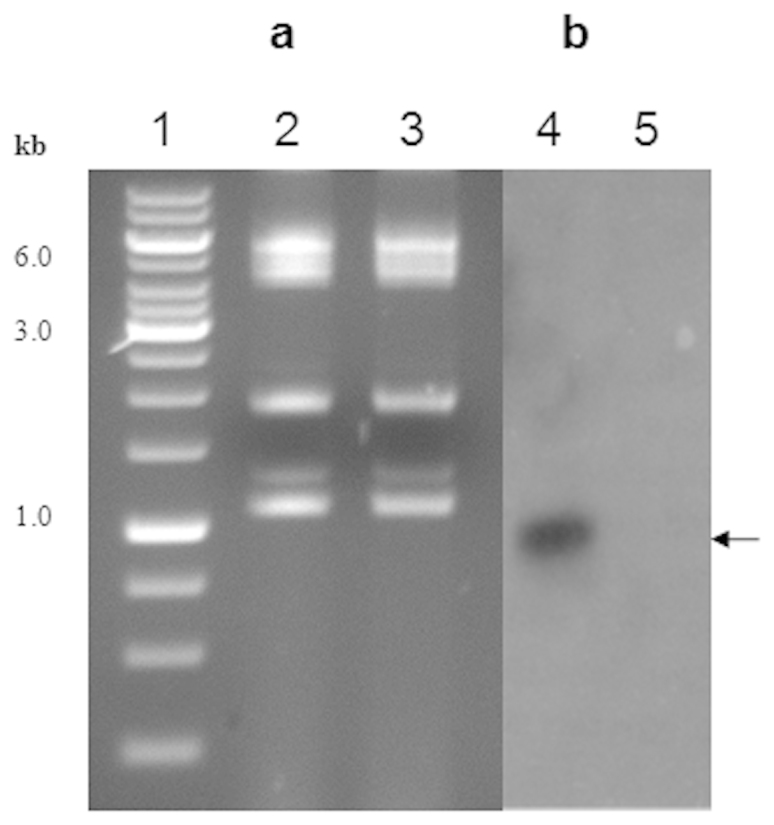
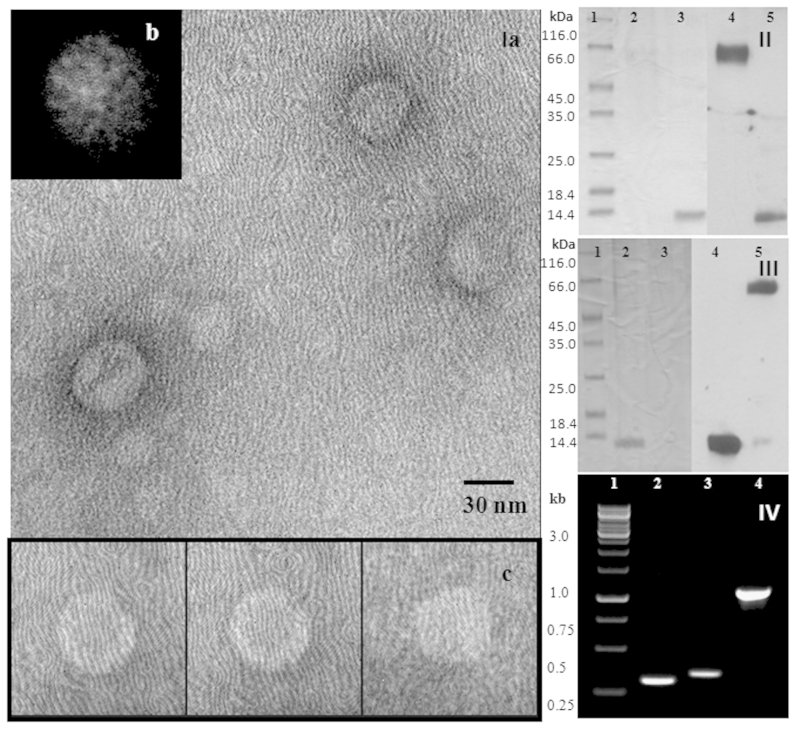
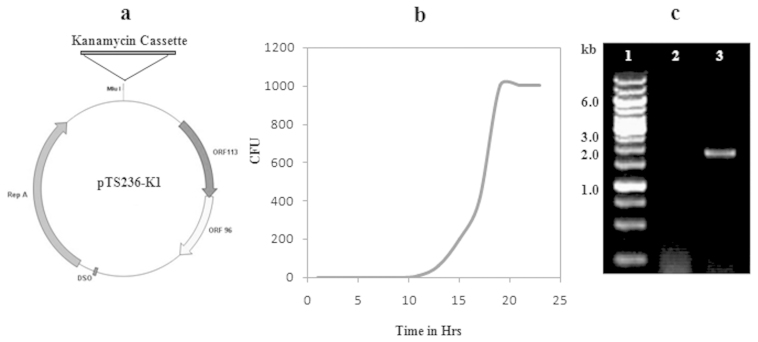
While analyzing plasmids of Acinetobacter sp. DS002 we have detected a circular DNA molecule pTS236, which upon further investigation is identified as the genome of a phage. The phage genome has shown sequence similarity to the recently discovered Sphinx 2.36 DNA sequence co-purified with the Transmissible Spongiform Encephalopathy (TSE) particles isolated from infected brain samples collected from diverse geographical regions. As in Sphinx 2.36, the phage genome also codes for three proteins. One of them codes for RepA and is shown to be involved in replication of pTS236 through rolling circle (RC) mode. The other two translationally coupled ORFs, orf106 and orf96, code for coat proteins of the phage. Although an orf96 homologue was not previously reported in Sphinx 2.36, a closer examination of DNA sequence of Sphinx 2.36 revealed its presence downstream of orf106 homologue. TEM images and infection assays revealed existence of phage AbDs1 in Acinetobacter sp. DS002.


Figures

Figure 1
Figure 1
In panel (a) an agarose gel shows the existence of multiple plasmids in Acinetobacter sp. DS002. Lane 1 and 2 represent a kilobase DNA ladder as standard and plasmid preparations from the plasmid-free E. coli strain used as negative control, respectively. The plasmids found in Acinetobacter sp. DS002 are shown in lane 3. Panel (b) shows the restriction profile of rescue-cloned plasmids of Acinetobacter sp. DS002 isolated from E. coli pir116 cells. The plasmids were independently digested with XhoI and BamHI and analyzed on 0.8% (w/v) agarose gels. The total size of the rescue-cloned plasmids was calculated based on the electrophoretic mobility of the DNA fragments generated upon restriction digestion. A portion of the minitransposon released as a XhoI and BamHI fragment is shown with an arrow. While calculating the total size of rescue-cloned plasmids a size of 2 kb based on the size of the minitransposon was deduced. Panel (c) shows the restriction map of the minitransposon-EZ-Tn5<R6Kγori/KAN-2> inserted into rescue-cloned plasmids. The open box represents the minitransposon and the lines flanking the open box indicate the rescue-cloned plasmid. The size of the minitransposon and the 1.0 kb portion released upon digesting with BamHI and XhoI is indicated with inverted arrows.
Figure 2
Figure 2
Panel (a) shows the pTS236-K map with a minitransposon insertion between the predicted start codon UUG and a single AUG codon of repA specifying 165-methionine residue. Arrows indicate the transcriptional orientation of repA, orf106 and orf96. The DSO found upstream of repA start codon UUG is shown as a filled square. Panel (b) shows the physical map of the DSO and repA region of pTS236. DSO is shown as a hatched box. The extent of repA cloned to generate expression plasmids coding RepA (pTRW1) from predicted start codon UUG and from the AUG specifying 165-methionine (pTRW2) are indicated with solid lines. Panel (c) shows an SDS-PAGE and the corresponding western blot probed using anti-His antibody. Lane 1 represents the protein molecular mass marker. Lanes 2 and 3 show protein extracts prepared from uninduced E. coli BL21(DE3) cells having either pTRW1(lane 2) or pTRW2 (lane 3). Lanes 4 and 5 represent similar extracts prepared from induced cultures. RepA-specific signals seen in induced cultures are shown with arrows. Panel (d) and (e) represent replication of pTS236-K in permissive (E. coli pir116) and non-permissive (E. coli BL21) hosts. Panel (d) shows growth on LB with ampicillin and kanamycin plates of E. coli pir116 (pTS236-K) containing expression vector pET23b (sector 1), pTRW1 (sector 2), pTRW2 (sector 3), pTRM (sector 4). Sectors 5 and 6 represent growth of E. coli pir116 (pTRW1) having plasmids pT106M and pT96M, respectively. Growth of E. coli BL21 carrying the same plasmids is shown in panel (e). Panel (f) shows an SDS-PAGE and the corresponding western blots generated using RepA specific antibodies. Lane 1 represents total proteins of Acinetobacter sp. DS002. Lanes 2 and 3 are protein extracts prepared from E. coli BL21 cells expressing RepA from predicted start codon with or without C-terminal histidine tag, respectively.
Figure 3
Figure 3. RepA-mediated generation of open-circular (OC) form of plasmid pTS236-K from a super-coiled (SC) form.
Panel (a) indicates SC to OC conversion of pTS236-K against time (I) or with increasing concentration of RepA (II). The pTS236-K incubated with increasing concentrations of RepA(Y265F) is shown in panel (a) III. Electrophoretic Mobility Shift Assay (EMSA) for DSO and RepA is shown in panel (b). A shift in DSO mobility was observed due to the formation of DSO-RepA complex when labelled DSO was incubated with increased concentrations of RepA. Control represents 32P-labelled DSO without RepA. The DSO mobility shift is shown with an arrow (C) while F represents the free probe.
Figure 4
Figure 4. Alignment of Double-Stranded Origin of replication (DSO) of plasmid pTS236 with the known rolling circle replicating plasmids (Panel a).
Panel (b) shows the secondary structure of DSO. The proposed site of the nick is shown with an arrow.
Figure 5
Figure 5. Detection of the single-stranded intermediate of pTS236: Lane 1 represents 1 kb DNA ladder, lanes 2 and 3 represent total plasmid preparation treated with (2) and without (3) S1 nuclease.
Lanes 4 and 5 represent the corresponding autoradiogram developed using labelled pTS236 as probe. Single-stranded pTS236 is shown with an arrow mark.
Figure 6
Figure 6
Panel I (a): TEM image of phage AbDs1. Out of the 50 isolated particles used for generating a class average, a few selected virions are shown in panel (c). The icosahedral features that are seen in the class average generated using the EMAN software tool, confirms the formation of virions (panel b). Panel (II) shows a western blot analysis of immune-purified phage AbDs1 using Orf96-specific antibodies. Lane 1 represents the molecular mass marker, lanes 2 and 3 are loaded with phage proteins and recombinant Orf96, respectively. Lanes 4 and 5 show the corresponding western blots. The western blot performed using Orf106-specific antibodies is shown in panel (III). Lanes 2 and 3 represent recombinant Orf106 and proteins of phage AbDs1, respectively. Lanes 4 and 5 show the corresponding western blots. Amplification of pTS236-specific ORFs from immune-purified AbDs1 phage particles is shown in panel (IV). Lane 1 represents kilo base ladder. Lanes 2, 3 and 4 show amplification of orf96, orf106 and repA, respectively.
Figure 7
Figure 7
Panel (a) indicates physical map of pTS236-K1. Panel (b) indicates the generation of kanamycin resistant Acinetobacter sp. DS002 colonies after infection with AbDs1 (pTS236-K1). Amplification of the kanamycin gene from immune-purified phage particles, AbDs1 (pTS236-K1), is shown in panel (c). Lane 1 represents the kilobase ladder, lanes 2 and 3 are loaded with the PCR-amplified kanamycin gene from AbDs1 and AbDs1 (pTS236-K1).

References

    1. Minas W. & Gutnick D. L. Isolation, characterization, and sequence analysis of cryptic plasmids from Acinetobacter calcoaceticus and their use in the construction of Escherichia coli shuttle plasmids. Appl Environ Microbiol 59, 2807–2816 (1993). - PMC - PubMed
    1. Reams A. B. & Neidle E. L. Genome plasticity in Acinetobacter: new degradative capabilities acquired by the spontaneous amplification of large chromosomal segments. Mol Microbiol 47, 1291–1304 (2003). - PubMed
    1. Fischer R., Bleichrodt F. S. & Gerischer U. C. Aromatic degradative pathways in Acinetobacter baylyi underlie carbon catabolite repression. Microbiology 154, 3095–3103 (2008). - PubMed
    1. Towner K. J. Acinetobacter: an old friend, but a new enemy. J Hosp Infect 73, 355–363 (2009). - PubMed
    1. Bergogne-Berezin E. & Towner K. J. Acinetobacter spp. as nosocomial pathogens: microbiological, clinical, and epidemiological features. Clin Microbiol Rev 9, 148–165 (1996). - PMC - PubMed

Publication types

Associated data