. 2013 Dec;132(12):1351-60.
doi: 10.1007/s00439-013-1334-z. Epub 2013 Jul 19.

How meaningful are heritability estimates of liability?

Affiliations

How meaningful are heritability estimates of liability?

Penny H Benchek et al. Hum Genet. 2013 Dec.

Abstract

It is commonly acknowledged that estimates of heritability from classical twin studies have many potential shortcomings. Despite this, in the post-GWAS era, these heritability estimates have come to be a continual source of interest and controversy. While the heritability estimates of a quantitative trait are subject to a number of biases, in this article we will argue that the standard statistical approach to estimating the heritability of a binary trait relies on some additional untestable assumptions which, if violated, can lead to badly biased estimates. The ACE liability threshold model assumes at its heart that each individual has an underlying liability or propensity to acquire the binary trait (e.g., disease), and that this unobservable liability is multivariate normally distributed. We investigated a number of different scenarios violating this assumption such as the existence of a single causal diallelic gene and the existence of a dichotomous exposure. For each scenario, we found that substantial asymptotic biases can occur, which no increase in sample size can remove. Asymptotic biases as much as four times larger than the true value were observed, and numerous cases also showed large negative biases. Additionally, regions of low bias occurred for specific parameter combinations. Using simulations, we also investigated the situation where all of the assumptions of the ACE liability model are met. We found that commonly used sample sizes can lead to biased heritability estimates. Thus, even if we are willing to accept the meaningfulness of the liability construct, heritability estimates under the ACE liability threshold model may not accurately reflect the heritability of this construct. The points made in this paper should be kept in mind when considering the meaningfulness of a reported heritability estimate for any specific disease.


Figures

Fig. 1
Fig. 1
Percent bias as a function of trait prevalence and gene frequency (gene freq.). Percent bias was calculated according to Eq. (2), where the true distribution of the additive genetic component of the liability is non-normal due to a single causal diallelic gene, and the true parameter values are: a σA2=0.2, σC2=0.6; b σA2=0.4, σC2=0.4; c σA2=0.6, σC2=0.2; d σA2=0.8, σC2=0.1
Fig. 2
Fig. 2
Percent bias as a function of trait prevalence and exposure probability. Percent bias was calculated according to Eq. (2), where the true distribution of the common environmental component of the liability is Bernoulli, and the true parameter values are: a σA2=0.1, σC2=0.8; b σA2=0.2, σC2=0.6; c σA2=0.4, σC2=0.4; d σA2=0.6, σC2=0.2
Fig. 3
Fig. 3
Percent bias as a function of trait prevalence and degrees of freedom (df). Percent bias was calculated according to Eq. (2), where the true liability has a t distributed common environmental component. The true parameter values are: a σA2=0.1, σC2=0.8; b σA2=0.2, σC2=0.6; c σA2=0.4, σC2=0.4; d σA2=0.6, σC2=0.2
Fig. 4
Fig. 4
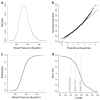
Systolic blood pressure (SBP) in males 55+. a Density plot of SBP; b QQ plot of expected quantiles if SBP is normally distributed versus observed quantiles; c CDF plot with step function = empirical CDF from SBP data and smooth function = CDF from mixture model; d percent bias as a function of cutoff value. Cutoff value determines hypertension (HTN) status. Percent bias was calculated according to Eq. (2), where the true distribution of the random environment is set to be a mixture of normal distributions. The true parameter values are: continuous lines σA2=0.4, σC2=0.1; dashed lines σA2=0.3, σC2=0.2
Fig. 5
Fig. 5
Percent bias as a function of sample size and prevalence. Percent bias was calculated according to Eq. (2), where the true liability distribution follows the ACE model. The true parameter values are: a σA2=0.6, σC2=0.15; b σA2=0.15, σC2=0.6

References

    1. Baranzini SE, Mudge J, Van Velkinburgh JC, Khankhanian P, Khrebtukova I, Miller NA, Zhang L, Farmer AD, Bell CJ, Kim RW. Genome, epigenome and RNA sequences of monozygotic twins discordant for multiple sclerosis. Nature. 2010;464:1351–1356. - PMC - PubMed
    1. Benaglia T, Chauveau D, Hunter DR, Young DS. mixtools: An R package for analyzing mixture models. J Stat Softw. 2009;32(6):1–29.
    1. Boardman JD, Blalock CL, Pampel FC. Trends in the genetic influences on smoking. J Health Soc Behav. 2010;51:108–123. - PMC - PubMed
    1. Boomsma D, Busjahn A, Peltonen L. Classical twin studies and beyond. Nat Rev Genet. 2002;3:872–882. - PubMed
    1. Bruder CEG, Piotrowski A, Gijsbers AACJ, Andersson R, Erickson S, Diaz de Ståhl T, Menzel U, Sandgren J, von Tell D, Poplawski A. Phenotypically concordant and discordant monozygotic twins display different DNA copy-number-variation profiles. Am J Human Genet. 2008;82:763–771. - PMC - PubMed

Publication types

LinkOut - more resources