. 2013 Jul 18;4(7):e732.
doi: 10.1038/cddis.2013.257.

Glucose starvation induces cell death in K-ras-transformed cells by interfering with the hexosamine biosynthesis pathway and activating the unfolded protein response

Affiliations

Glucose starvation induces cell death in K-ras-transformed cells by interfering with the hexosamine biosynthesis pathway and activating the unfolded protein response

R Palorini et al. Cell Death Dis. .

Erratum in

  • Cell Death Dis. 2013;4:e910. Cammarata, F [corrected to Cammarata, F P]

Abstract

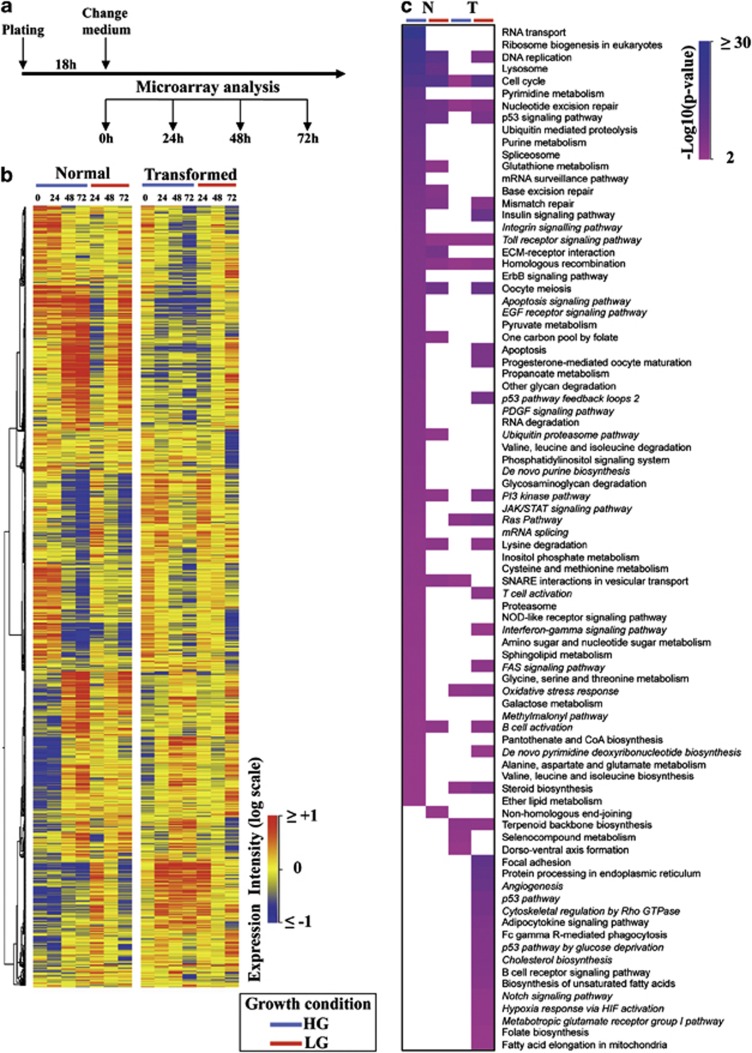
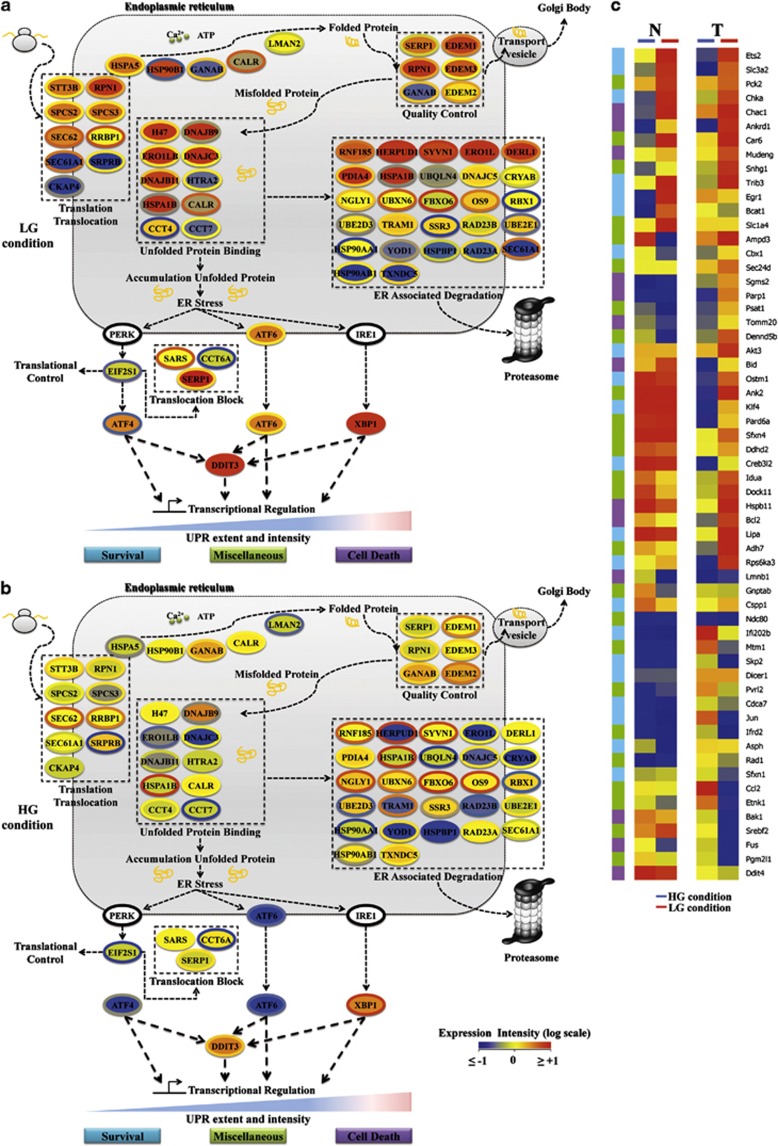
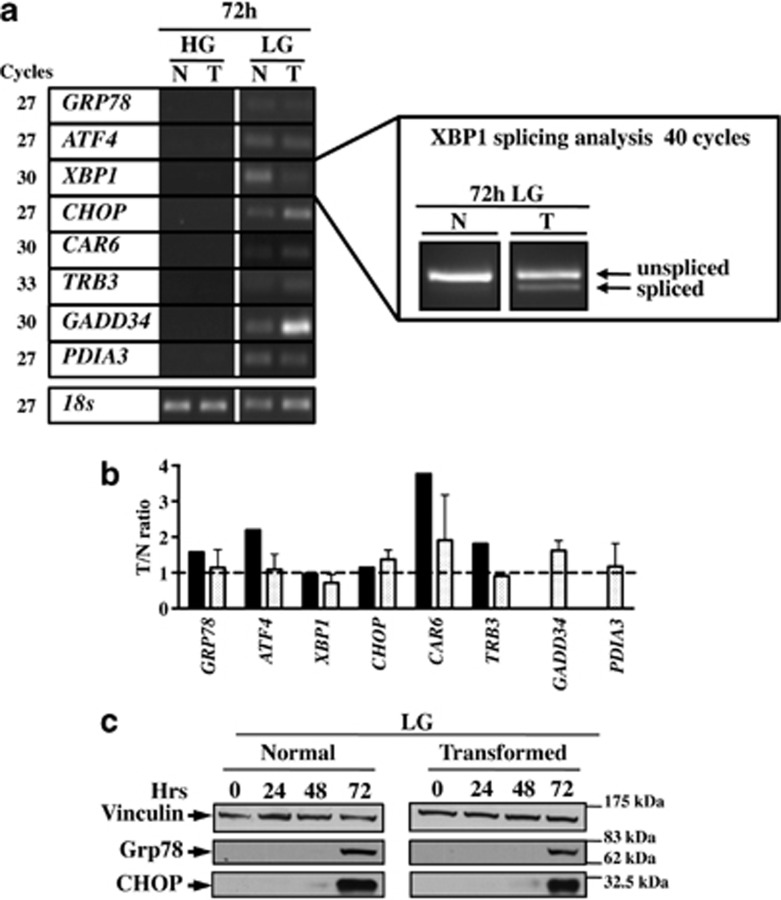
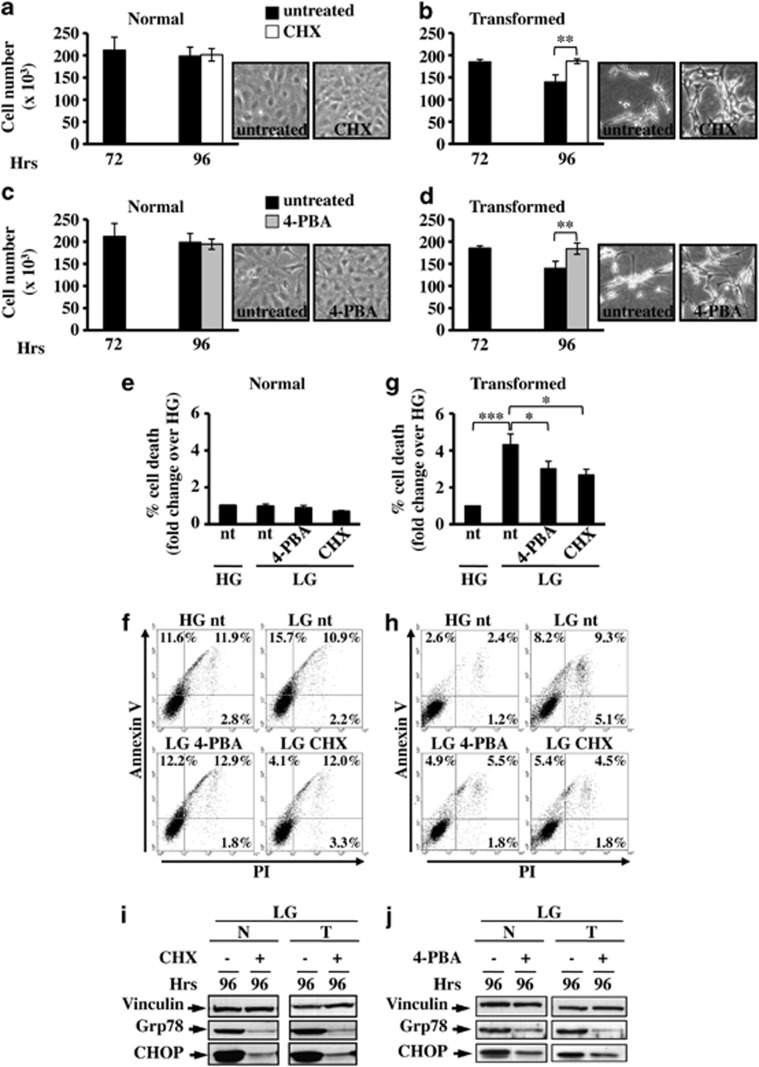
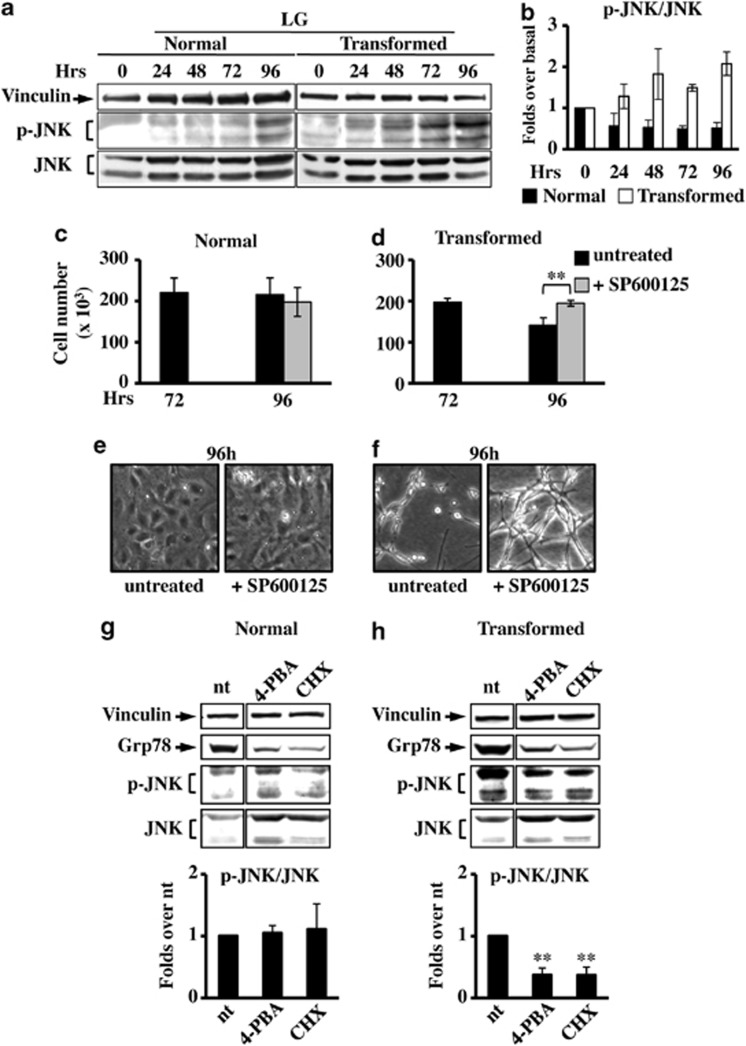
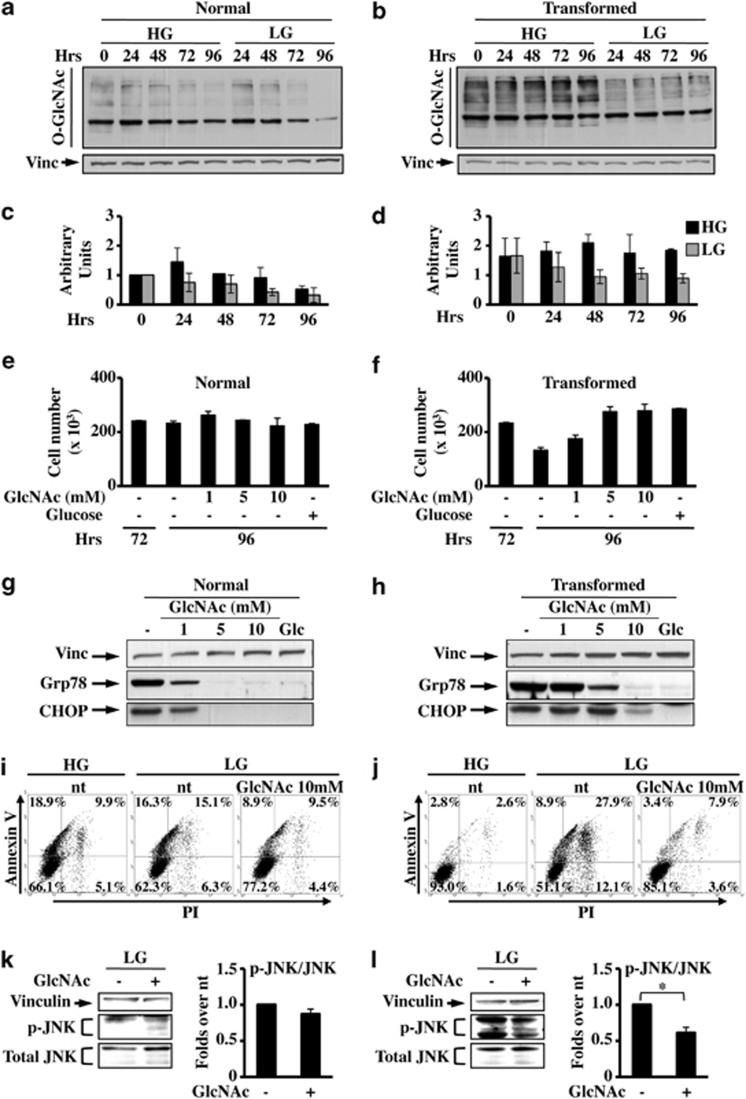
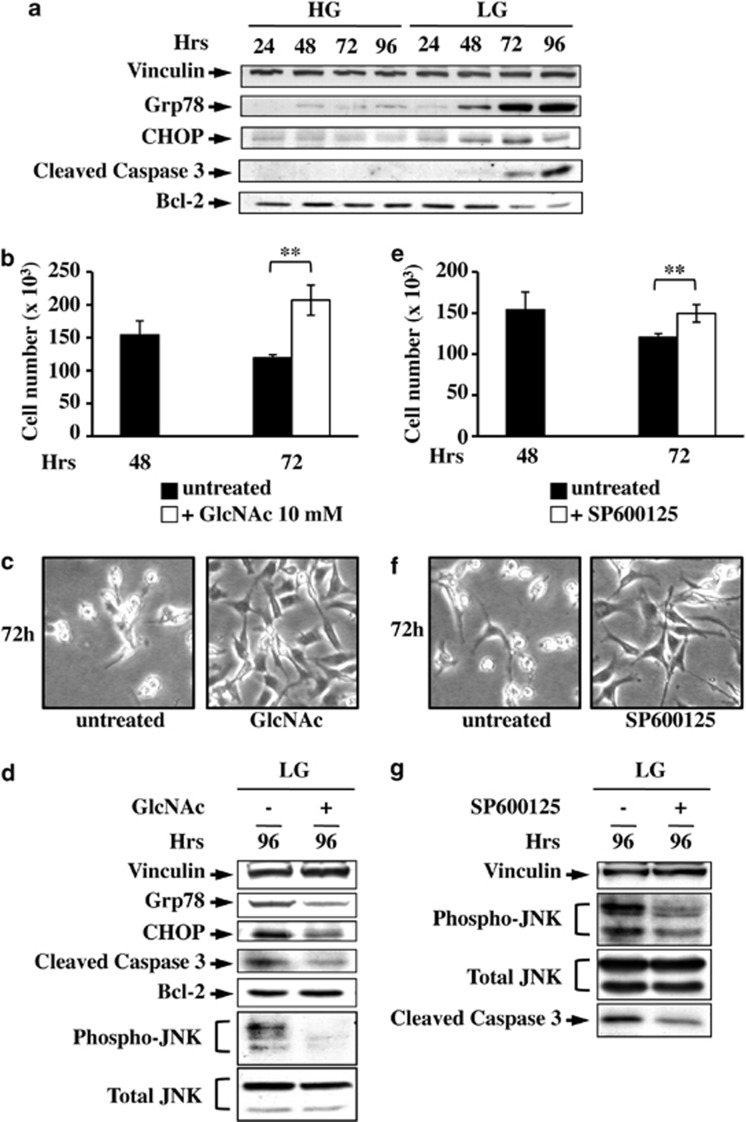
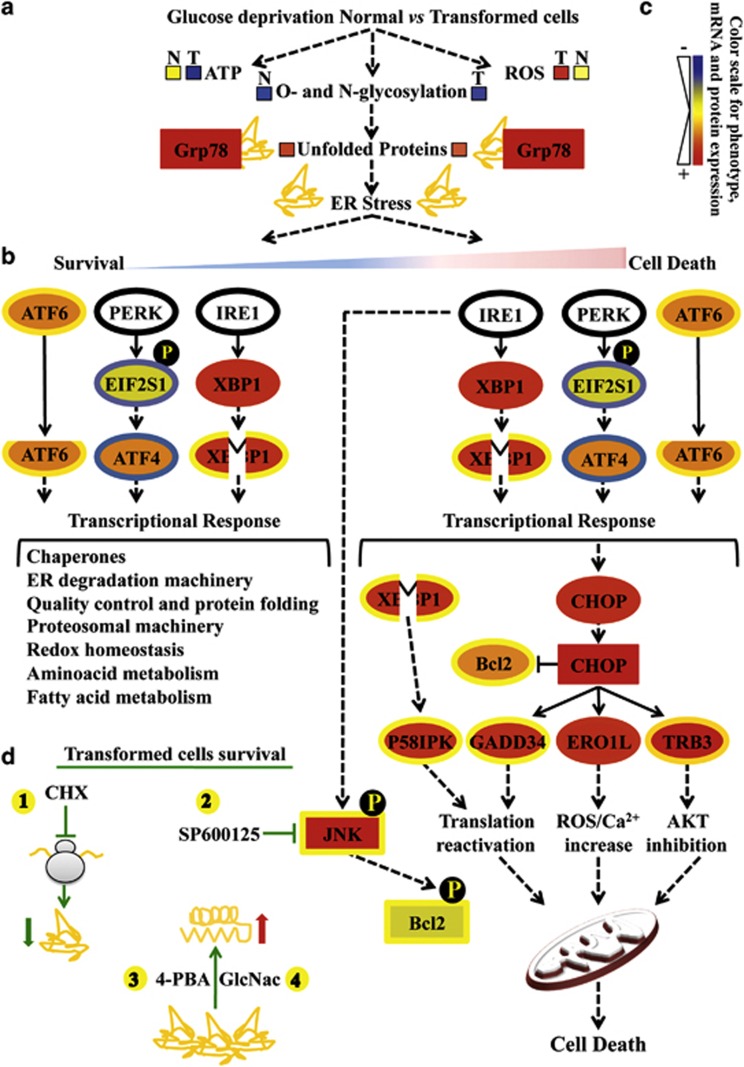
Cancer cells, which use more glucose than normal cells and accumulate extracellular lactate even under normoxic conditions (Warburg effect), have been reported to undergo cell death under glucose deprivation, whereas normal cells remain viable. As it may be relevant to exploit the molecular mechanisms underlying this biological response to achieve new cancer therapies, in this paper we sought to identify them by using transcriptome and proteome analysis applied to an established glucose-addicted cellular model of transformation, namely, murine NIH-3T3 fibroblasts harboring an oncogenic K-RAS gene, compared with parental cells. Noteworthy is that the analyses performed in high- and low-glucose cultures indicate that reduction of glucose availability induces, especially in transformed cells, a significant increase in the expression of several unfolded protein response (UPR) hallmark genes. We show that this response is strictly associated with transformed cell death, given that its attenuation, by reducing protein translation or by increasing cell protein folding capacity, preserves the survival of transformed cells. Such an effect is also observed by inhibiting c-Jun NH2-terminal kinase, a pro-apoptotic signaling mediator set downstream of UPR. Strikingly, addition of N-acetyl-D-glucosamine, a specific substrate for the hexosamine biosynthesis pathway (HBP), to glucose-depleted cells completely prevents transformed cell death, stressing the important role of glucose in HBP fuelling to ensure UPR attenuation and increased cell survival. Interestingly, these results have been fully recognized in a human model of breast cancer, MDA-MB-231 cells. In conclusion, we show that glucose deprivation, leading to harmful accumulation of unfolded proteins in consequence of a reduction of protein glycosylation, induces a UPR-dependent cell death mechanism. These findings may open the way for new therapeutic strategies to specifically kill glycolytic cancer cells.


Figures

Figure 1
Figure 1
Genes and pathways regulated in normal and transformed cells grown in HG and LG. (a) Schematic representation of the experimental procedure used to identify regulated genes in both cell lines grown along a time course of 72 h and in two glucose concentrations. (b) Starting from 5295 genes identified by Welch's ANOVA and PCA, a hierarchal clustering was performed. Expression levels are depicted by a color log scale from red (high expression) to blue (low expression). Each row indicates the expression value of a transcript in a specific condition (columns). (c) Pathway enrichment analysis, according to their P-values, of the differentially expressed genes achieved at 72 h in both cell lines grown in HG and LG. The pathways have been ranked according to normal cells grown in HG
Figure 2
Figure 2
The ER networks for normal and transformed cells grown in LG (a) and in HG (b), derived by using mRNA expression data at 72 h, are presented. Each mRNA is represented by a colored ellipse; in particular, the external ellipse represents normal cell data and the internal ellipse transformed cell data. Changes in gene expression levels are represented by a color log scale from red (high expression) to blue (low expression). Unchanged level of expression (yellow) has been considered when mRNA had a value between −0.5 and 0.5. The double-color triangle below the regulated processes indicated the relation between time and intensity of ER stress and effect on cell homeostasis (blue survival, red death). (c) Hierarchical clustering of 58 known UPR target genes. UPR-related genes have been identified in our transcriptional analysis and their 72 h values for normal and transformed cells grown in HG and LG have been clustered
Figure 3
Figure 3
Semi-quantitative RT-PCR and western blot analysis indicated that UPR is activated at LG. (a) Semi-quantitative RT-PCR of the mRNAs specific for different UPR-related genes in normal (N) and transformed cells (T) at 72 h in HG and LG. (b) Comparison between the relative levels of expression calculated by Affymetrix and semi-quantitative RT-PCR for the same genes at LG. (c) Western blot analysis of UPR activation upon glucose depletion. To follow UPR activation, the expression of Grp78 and CHOP proteins was analyzed. Images are representative of at least three independent experiments
Figure 4
Figure 4
Attenuation of UPR by cycloheximide (CHX) or sodium 4-phenylbutyrate (4-PBA) protects transformed cells from death. Cell death and UPR activation were analyzed in normal and transformed cells grown in LG for 72 h and treated for the further 24 h with CHX or 4-PBA. Normal (a and c) and transformed (b and d) cells were counted at 72 h and 96 h, after treatment with CHX (a and b) or 4-PBA (c and d). Data represent the average of at least three independent experiments (±S.D.); **P<0.01, Student's t-test. Phase contrast microscopy images of untreated and treated transformed cells at 96 h of culture are shown. (eh) FACS analysis of normal (e and f) and transformed (g and h) cells stained with Annexin V-FITC and propidium iodide. The percentage of cell death for normal and transformed cells was calculated considering Annexin V- and PI-stained cells alone and in combination; representative dot plots of normal (f) and transformed (h) cells are shown. Data represent the average of at least three independent experiments (±S.E.M); *P<0.05, ***P<0.001, Student's t-test. UPR activation after CHX (i) and 4-PBA (j) treatments was followed through the expression analysis of Grp78 and CHOP proteins. Figures are representative of three independent experiments
Figure 5
Figure 5
JNK inhibition causes survival in transformed cells grown in LG. (a) For JNK expression analysis, normal and transformed cells, grown in LG, were collected at indicated time points and total cellular extracts were subjected to SDS-PAGE followed by western blot analysis with antibodies anti-phospho-JNK Thr183/Tyr185 (p-JNK) and anti-total JNK. As loading control the expression of vinculin was analyzed. (b) Quantitative analysis of JNK phosphorylation status was performed by densitometric analysis of western blot films. The values obtained for P-JNK were normalized to the corresponding total JNK and vinculin values and plotted as fold changes over basal sample (0 h=1). Normal (c) and transformed (d) cells, grown in LG, were counted at 72 h and 96 h after 24 h of treatment with the JNK inhibitor, SP600125. Phase contrast microscopy images were collected for untreated and treated normal (e) and transformed (f) cells at 96 h of culture. All data represent the average of at least three independent experiments (±S.D.); **P<0.01, Student's t-test. (g and h) Analysis of p-JNK level in normal (g) and transformed (h) cells at 96 h of culture after 24 h of treatment with 4-PBA and CHX. The densitometric values for p-JNK, shown in the bottom histograms, were normalized as above and plotted as fold change over untreated (nt) sample. Data represent the average of at least three independent experiments (±S.E.M.); **P<0.01 as compared with nt, Student's t-test. UPR activation was followed through the expression analysis of Grp78 and as loading control the expression of vinculin was used
Figure 6
Figure 6
N-Acetyl-𝒟-glucosamine (GlcNAc) protects transformed cells from glucose depletion-dependent cell death. Normal (a) and transformed (b) cells, grown in HG and LG, were subjected to western blot analysis with anti O-glycosylation antibody (O-GlcNAc). As loading control the expression of vinculin and Ponceau staining (data not shown) was analyzed. Quantitative analysis of O-glycosylation status was performed by densitometric analysis of western blot films of normal (c) and transformed (d) cells. The values obtained for O-GlcNAc were normalized to the corresponding vinculin values and plotted as fold change over the normal sample 0 h (0 h=1) both in HG and LG. Normal (e) and transformed (f) cells, grown in LG, were counted at 72 and 96 h after 24 h of treatment with different concentrations of GlcNAc or 1 mM glucose. Data represent the average of at least three independent experiments (±S.D.). (g and h) UPR activation after GlcNAc or glucose (Glc) treatment was followed through the expression analysis of Grp78 and CHOP proteins. (i and j) FACS analysis of Annexin-V plus PI-labeled normal (i) and transformed (j) cells, grown until 96 h in HG (left panels), LG (middle panels) and LG+10 mM GlcNAc (24 h of treatment). Figures are representative of three independent experiments. (k and l) Analysis of the expression of p-JNK in normal (k) and transformed (l) cells at 96 h of culture. The values obtained for p-JNK, shown in the right histograms, were normalized to the corresponding total JNK and vinculin values and plotted as fold changes over nt samples. Data represent the average of at least three independent experiments (±S.E.M.); *P<0.05, Student's t-test. As loading control the expression of vinculin was used
Figure 7
Figure 7
Glucose-addicted human cancer cells are protected from cell death by N-acetyl-𝒟-glucosamine (GlcNAc) and JNK inhibitor. (a) Western blot analysis of UPR and cell death activation in MDA-MB-231 grown in HG and LG. To follow the UPR and cell death processes, the expression levels of Grp78 and CHOP as well as of cleaved caspase 3 and Bcl-2 were analyzed, respectively. MDA-MB-231 cell survival was analyzed by counting untreated cells at either 72 h of LG growth or after 24 h of treatment with 10 mM GlcNAc (b) or SP600125 (e). Data represent the average of at least three independent experiments (±S.D.); **P<0.01, Student's t-test. Phase contrast microscopy images were collected for untreated and treated (+GlcNAc, c; +SP600125, f) cells at 72 h of culture. (d) UPR activation and cell death at LG and upon GlcNAc treatment were followed through the expression analysis of Grp78, CHOP, cleaved caspase 3, Bcl-2 and p-JNK. (g) JNK inhibitor effect on cell survival was followed by western blot analysis of JNK phosphorylation, as control, and caspase 3 activation. Figures are representative of three independent experiments
Figure 8
Figure 8
Glucose deprivation in cancer cells activates UPR following HBP flux reduction. Proteins are represented by a colored rectangle; in particular, the external rectangle represents normal cell data and the internal rectangle transformed cell data. Similarly, each mRNA has been represented by a colored ellipse, in which the external ellipse represents normal cell data and the internal ellipse transformed cell data. Changes in protein and gene expression levels are represented by a color scale between red (high expression) and blue (low expression); yellow indicates unchanged expression. Levels of ATP, ROS and unfolded proteins in normal (N) and transformed (T) cells (a) are represented by colored boxes. The double-color triangle in a under ER stress indicated the relation between time and intensity of ER stress and effect on cell homeostasis (blue: survival, red: death). (b) Survival processes activated by UPR have been represented as a cascade of events starting from UPR sensors activation (ATF6 cleavage, eIF2a phosphorylation, EIF2S1 gene, by PERK, ATF4 expression and XBP1 splicing from expression upon IRE1 activity) and ending with a list of downstream regulated processes (transcriptional response). (c) The cell death process activated by UPR has been presented as a cascade of events starting from UPR sensor activation (as above) and ending either with a transcriptional response (CHOP, P58IPK, GADD34, ERO1L, TRB3) or a post-translational mechanism (phosphorylation) positively controlling JNK and negatively controlling Bcl-2 proteins. (d) Schematic representation of the transformed cells' survival mechanisms identified in our work. The protective effects of CHX (1, translation inhibition), SP600125 (2, JNK inhibitor), 4-PBA (3, chemical chaperone) and GlcNac (4, HBP substrate) are shown

References

    1. Hanahan D, Weinberg RA. Hallmarks of cancer: the next generation. Cell Mar. 2011;144:646–674. - PubMed
    1. Alberghina L, Gaglio D, Gelfi C, Moresco RM, Mauri G, Bertolazzi P, et al. Cancer cell growth and survival as a system-level property sustained by enhanced glycolysis and mitochondrial metabolic remodeling. Front Physio. 2012;3:362. - PMC - PubMed
    1. Chiaradonna F, Moresco RM, Airoldi C, Gaglio D, Palorini R, Nicotra F, et al. From cancer metabolism to new biomarkers and drug targets. Biotechnol Adv. 2011;30:30–51. - PubMed
    1. DeBerardinis RJ, Lum JJ, Hatzivassiliou G, Thompson CB. The biology of cancer: metabolic reprogramming fuels cell growth and proliferation. Cell Metab. 2008;7:11–20. - PubMed
    1. Hsu PP, Sabatini DM. Cancer cell metabolism: Warburg and beyond. Cell. 2008;134:703–707. - PubMed

Publication types

MeSH terms