. 2013:3:2234.
doi: 10.1038/srep02234.

Nanosensor dosimetry of mouse blood proteins after exposure to ionizing radiation

Affiliations

Nanosensor dosimetry of mouse blood proteins after exposure to ionizing radiation

Dokyoon Kim et al. Sci Rep. 2013.

Abstract

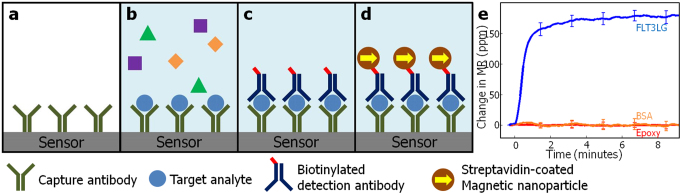
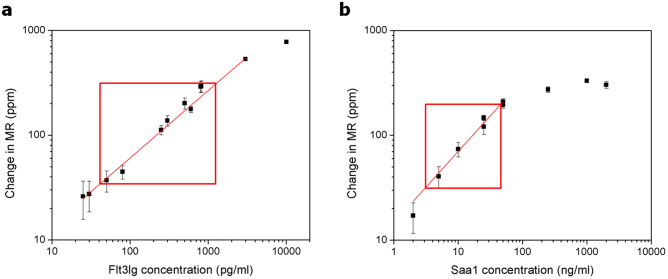
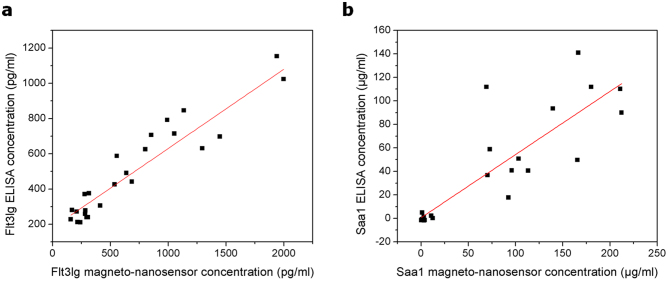
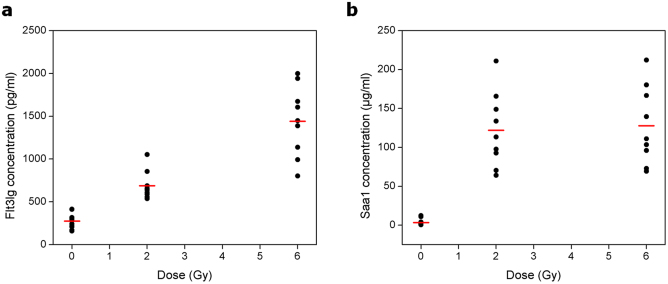
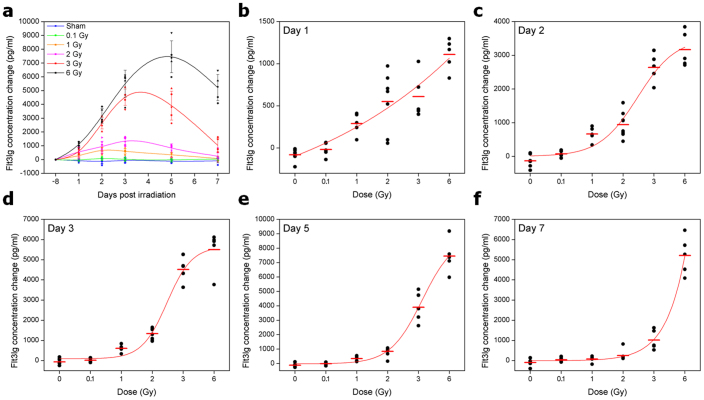
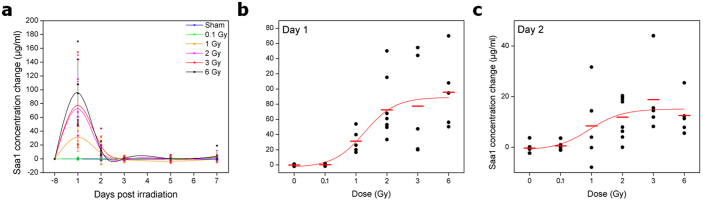
Giant magnetoresistive (GMR) nanosensors provide a novel approach for measuring protein concentrations in blood for medical diagnosis. Using an in vivo mouse radiation model, we developed protocols for measuring Flt3 ligand (Flt3lg) and serum amyloid A1 (Saa1) in small amounts of blood collected during the first week after X-ray exposures of sham, 0.1, 1, 2, 3, or 6 Gy. Flt3lg concentrations showed excellent dose discrimination at ≥ 1 Gy in the time window of 1 to 7 days after exposure except 1 Gy at day 7. Saa1 dose response was limited to the first two days after exposure. A multiplex assay with both proteins showed improved dose classification accuracy. Our magneto-nanosensor assay demonstrates the dose and time responses, low-dose sensitivity, small volume requirements, and rapid speed that have important advantages in radiation triage biodosimetry.


Figures

Figure 1
Figure 1
(a–d) A schematic of magneto-nanosensor biochip immunoassay: (a) Capture antibodies are immobilized covalently on the sensor surface. (b) Target antigens are captured and noncomplementary antigens are subsequently washed away. (c) Addition of biotinylated detection antibody forms a sandwich structure. (d) Streptavidin-coated magnetic nanoparticles bound to the biotinylated detection antibody produce stray magnetic field. (e) An example of real-time binding curve showing the change in magnetoresistance (MR) in parts per million (ppm) over time for 500 pg/ml Flt3lg (blue) compared with BSA negative control (orange) and epoxy reference (red). Error bars are ±1 standard deviation.
Figure 2
Figure 2. Standard curves measured on magneto-nanosensor chips for mouse (a) Flt3lg and (b) Saa1.
Red boxes indicate the ranges of magneto-nanosensor chip signal and biomarker concentration used in the assays performed in this work. Error bars are ±1 standard deviation.
Figure 3
Figure 3. Correlation scatter plots between ELISA and magneto-nanosensor biochip assay for mouse (a) Flt3lg and (b) Saa1.
Figure 4
Figure 4. Radiation dose response behaviour of mouse (a) Flt3lg and (b) Saa1 measured using magneto-nanosensor biochips for 0, 2, and 6 Gy irradiated C57BL/6J mice at 24 hours post-irradiation.
Red bars indicate average values, and each black dot represents one animal.
Figure 5
Figure 5
(a) Radiation time response behaviour of mouse Flt3lg measured using magneto-nanosensor biochips for sham, 0.1, 1, 2, 3, and 6 Gy (blue, green, orange, magenta, red, and black, respectively) irradiated C57BL/6J mice at 8 days before, 1, 2, 3, 5, and 7 days post-irradiation. Error bars indicate ±1 standard deviation for each radiation exposure group. Dose response behaviours of mouse Flt3lg at days (b) 1, (c) 2, (d) 3, (e) 5, and (f) 7 after exposure to radiation. Red bars indicate average values, and each black dot represents one animal. Red lines are dose response fitting curves.
Figure 6
Figure 6
(a) Radiation time response behaviour of mouse Saa1 measured using magneto-nanosensor biochips for sham, 0.1, 1, 2, 3, and 6 Gy (blue, green, orange, magenta, red, and black, respectively) irradiated C57BL/6J mice at 8 days before, 1, 2, 3, 5, and 7 days post-irradiation.Error bars indicate ±1 standard deviation for each radiation exposure group. Dose response behaviours of mouse Saa1 at days (b) 1 and (c) 2 after exposure to radiation. Red bars indicate average values, and each black dot represents one animal. Red lines are dose response fitting curves.

References

    1. Brenner D. J. et al. Cancer risks attributable to low doses of ionizing radiation: assessing what we really know. Proc. Natl. Acad. Sci. USA 100, 13761–13766 (2003). - PMC - PubMed
    1. Atkinson J. et al. A mitochondria-targeted inhibitor of cytochrome c peroxidase mitigates radiation-induced death. Nat. Commun. 2, 497 (2011). - PMC - PubMed
    1. Blakely W. F., Salter C. A. & Prasanna P. G. S. Early-response biological dosimetry— recommended countermeasure enhancements for mass-casualty radiological incidents and terrorism. Health Phys. 89, 494–504 (2004). - PubMed
    1. Pinto M. M. P. L., Santos N. F. G. & Amaral A. Current status of biodosimetry based on standard cytogenetic methods. Radiat. Environ. Biophys. 49, 567–581 (2010). - PubMed
    1. Fenech M. Current status, new frontiers and challenges in radiation biodosimetry using cytogenic, transcriptomic and proteomic technologies. Radiat. Meas. 46, 737–741 (2011).

Publication types