

Proton transfer through the water gossamer
- PMID: 23868853
- PMCID: PMC3752248
- DOI: 10.1073/pnas.1306642110
Proton transfer through the water gossamer
Abstract
The diffusion of protons through water is understood within the framework of the Grotthuss mechanism, which requires that they undergo structural diffusion in a stepwise manner throughout the water network. Despite long study, this picture oversimplifies and neglects the complexity of the supramolecular structure of water. We use first-principles simulations and demonstrate that the currently accepted picture of proton diffusion is in need of revision. We show that proton and hydroxide diffusion occurs through periods of intense activity involving concerted proton hopping followed by periods of rest. The picture that emerges is that proton transfer is a multiscale and multidynamical process involving a broader distribution of pathways and timescales than currently assumed. To rationalize these phenomena, we look at the 3D water network as a distribution of closed directed rings, which reveals the presence of medium-range directional correlations in the liquid. One of the natural consequences of this feature is that both the hydronium and hydroxide ion are decorated with proton wires. These wires serve as conduits for long proton jumps over several hydrogen bonds.
Conflict of interest statement
The authors declare no conflict of interest.
Figures

 and
and  are the symmetrized PT coordinates defined as the difference in distance of the transferring proton along the hydrogen bond [
 and
and  ]. The species O(1), O(2), and O(3) are consecutive oxygen atoms along a wire that house the proton at some point during PT. Associated with each PT coordinate is the distance between the oxygen atoms along the wire:
  ,
,  , and the y axis shows the sum of these two distances. This plot is strikingly similar to the “banana” plots in the stepwise PT jumps (9). Here, instead double jumps are facilitated by collective compressions (see
 , where h is 1 when a tagged species in the system is a proton or 0 if it is not] is shown for individual proton species in the system as well as the ensemble average. The two blue curves, for example, illustrate two limiting cases involving a trapped proton and a very short-lived proton transiently formed during concerted PT events. The red, green, and violet curves shown, interpolate between these two limiting cases. The black curve represents the average over all PT events from different trajectories, whereas the dashed magenta curve is a fit to this average using several exponentials.

 ), whereas the green bars tend to be larger at larger ring values (greater than
  ).
).
 for two directed six-membered rings, and C shows the distribution of
  obtained for neat water. When
  (A), the ring is made up of only DA water molecules, whereas when
  , the ring consists of one DD, one AA, and four DA water molecules. The blue-colored paths show possible realizations of
  obtained for these rings. In particular for the
  ring, the longest outgoing path from the tagged DA water (surrounded by a blue sphere) to waters other than itself, is shown by the blue path that is made of five hydrogen bonds. This path ends at the water surrounded by a yellow sphere. For
  (B), a realization of the longest outgoing wire for a DD water molecule (surrounded by a blue sphere) is shown by the blue path made up of three hydrogen bonds. This path ends at the water surrounded by the yellow sphere. For clarity, in these figures we only show examples of six-membered rings. However, as discussed in the text, the same features hold for rings of all sizes. The distributions of
  of charged systems are quite similar (
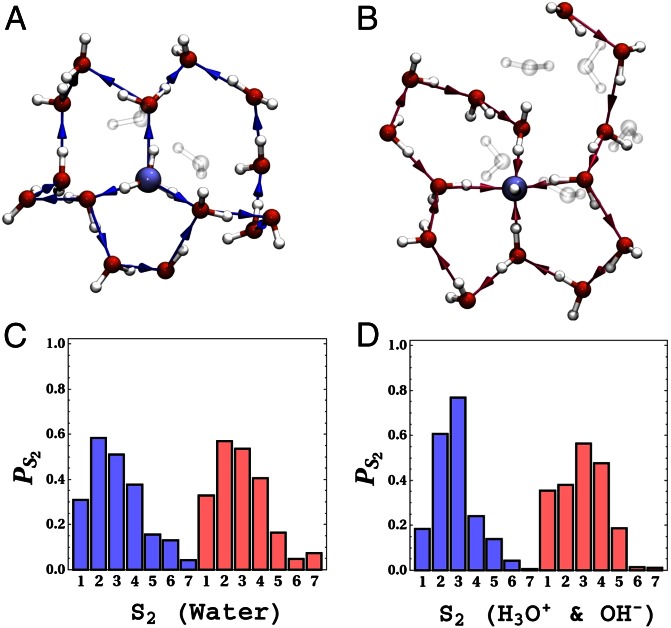
 for neat water [DD (blue) and AA (red)], H3O+ (blue), and OH− (red) systems.
 ,
,  , and
, and  (corresponding to the black, red, and green curves, respectively) are shown. (B) Coupling between the ring interconversions and the umbrella inversion mode of the hydronium during PT events. The data series shows the umbrella inversion mode coordinate on the y axis along with four snapshots from the molecular dynamics trajectory. The purple triangle is formed by the base of three protons, which is used to illustrate the role of the inversion mode. The inversion coordinate is defined by the perpendicular distance between the oxygen atom of the hydronium ion and the plane formed by the hydrogen atoms. In the first example (A), the inversion mode does not change and hence does not play a role in the PT. However, in the second example, the inversion mode changes, which facilitated the formation and breakage of a 4M ring and is coupled to PT. For clarity, we note that in the first 2 ps the oxygen lies below the triangular blue base, whereas between 2 and 6 ps the oxygen lies above the triangular base.
Comment in
-
Probing the mechanisms of proton transfer in liquid water.Proc Natl Acad Sci U S A. 2013 Aug 20;110(34):13697-8. doi: 10.1073/pnas.1312350110. Epub 2013 Aug 8. Proc Natl Acad Sci U S A. 2013. PMID: 23929776 Free PMC article. No abstract available.
References
-
- Agmon N. The Grotthuss mechanism. Chem Phys Lett. 1995;244(5-6):456–462.
-
- James T. Hynes. Physical chemistry: The protean proton in water. Nature. 1999;397(6720):565–567.
-
- Marx D, Chandra A, Tuckerman ME. Aqueous basic solutions: Hydroxide solvation, structural diffusion, and comparison to the hydrated proton. Chem Rev. 2010;110(4):2174–2216. - PubMed
-
- Knight C, Voth GA. The curious case of the hydrated proton. Acc Chem Res. 2012;45(1):101–109. - PubMed
-
- Kreuer KD, Paddison SJ, Spohr E, Schuster M. Transport in proton conductors for fuel-cell applications: Simulations, elementary reactions, and phenomenology. Chem Rev. 2004;104(10):4637–4678. - PubMed
Publication types
MeSH terms
Substances
Grants and funding
LinkOut - more resources
Full Text Sources
Other Literature Sources
Molecular Biology Databases
