

Alterations in cerebrospinal fluid glycerophospholipids and phospholipase A2 activity in Alzheimer's disease
- PMID: 23868911
- PMCID: PMC3770101
- DOI: 10.1194/jlr.M037622
Alterations in cerebrospinal fluid glycerophospholipids and phospholipase A2 activity in Alzheimer's disease
Abstract
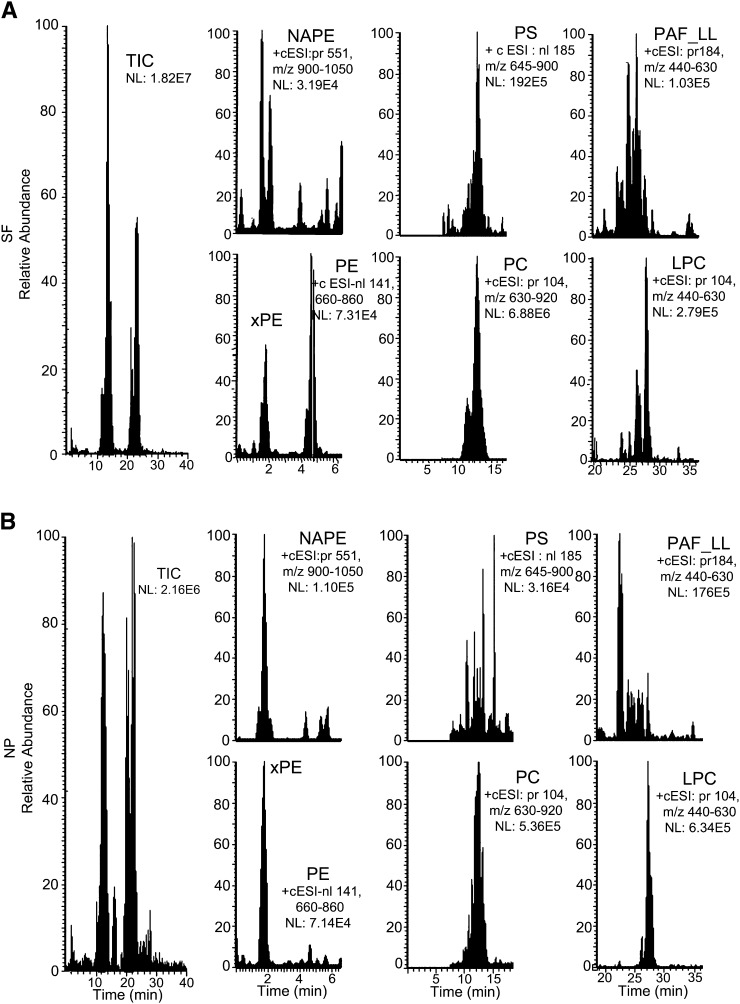
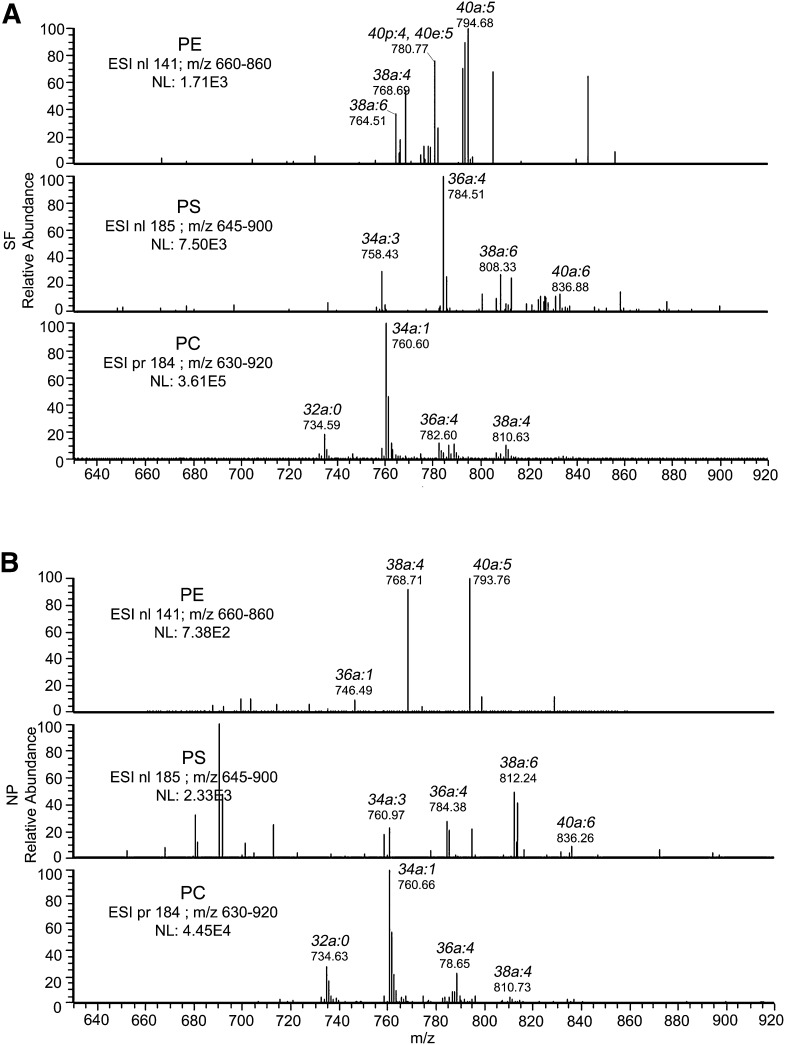
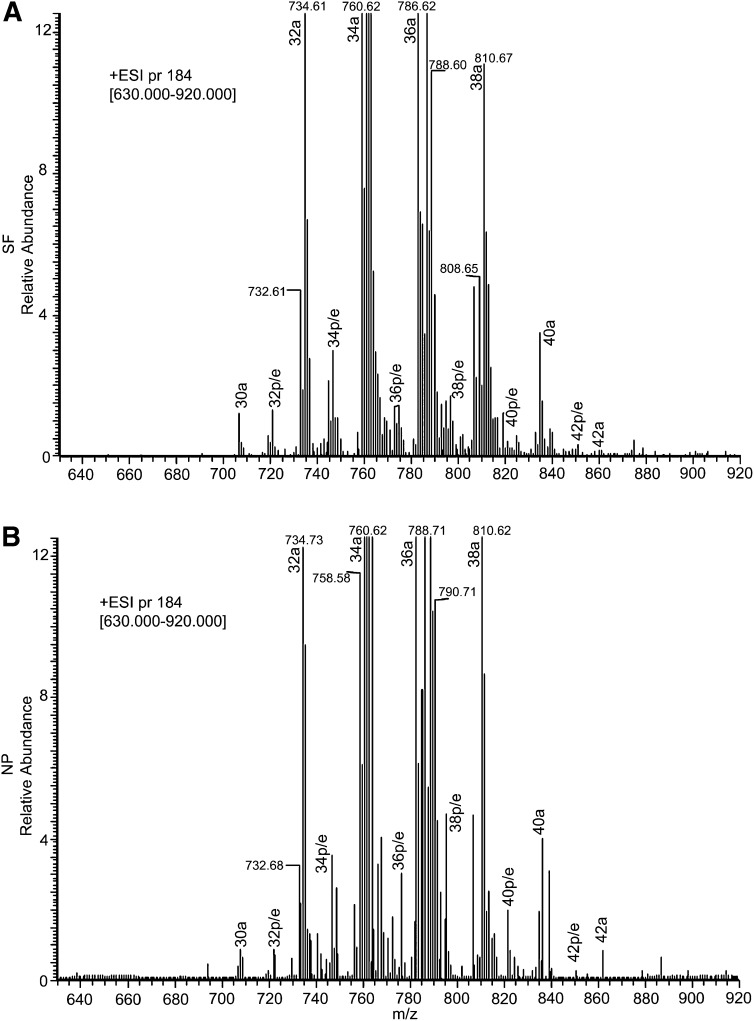
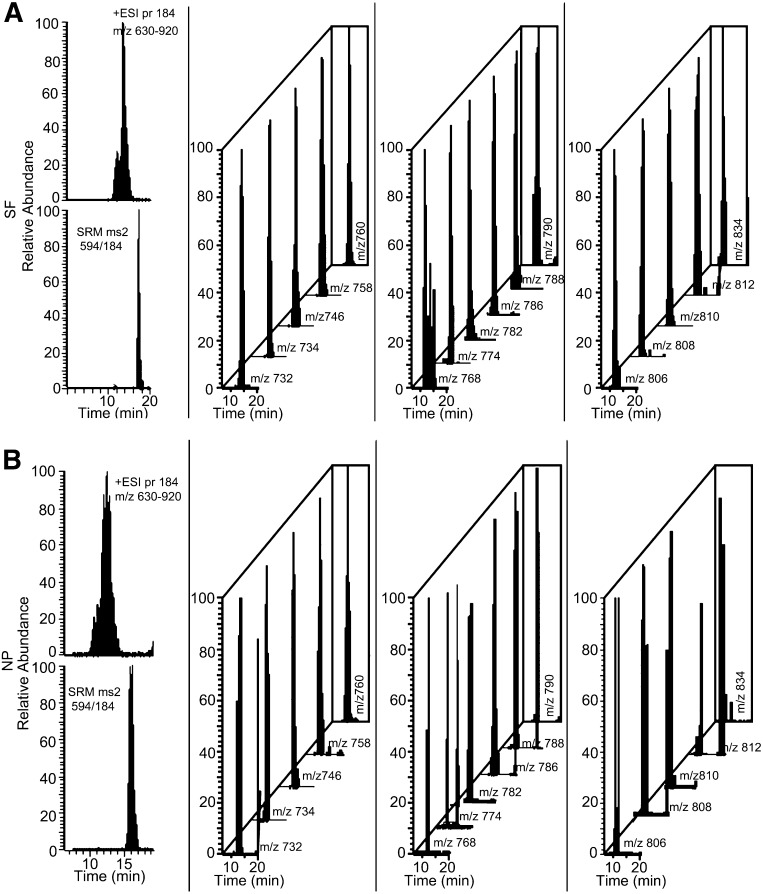
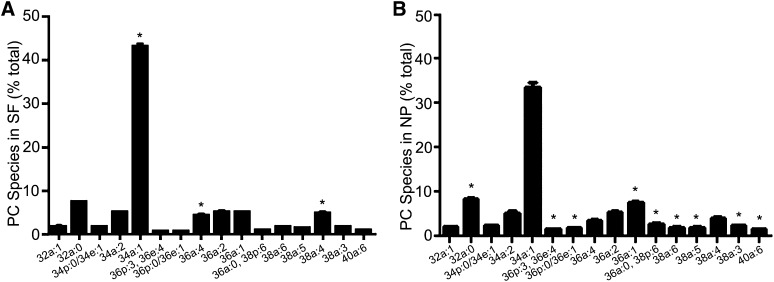
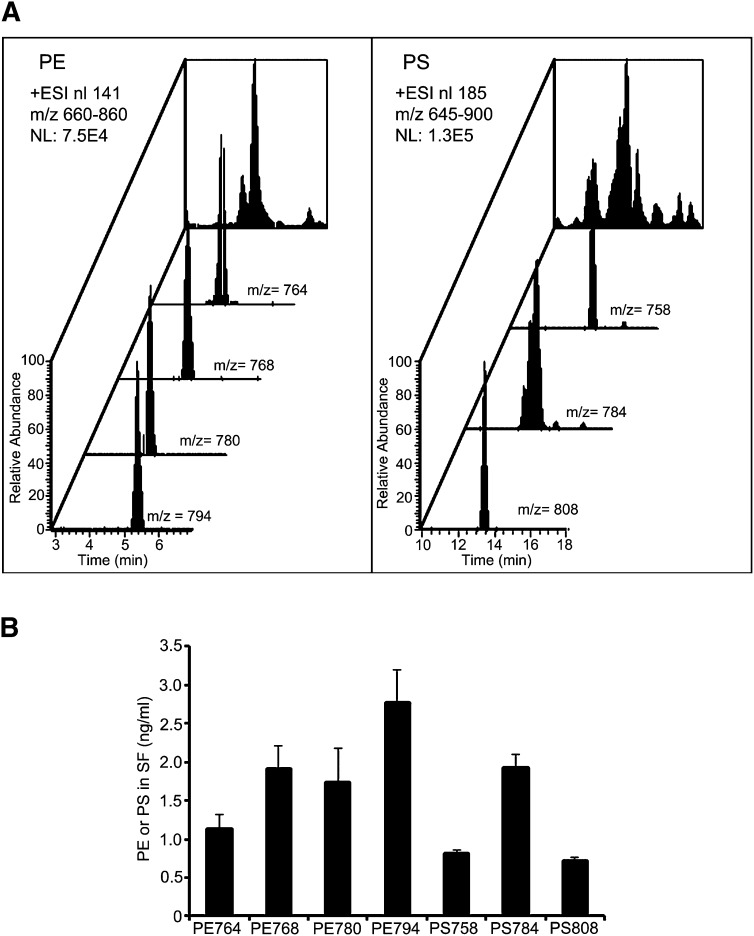
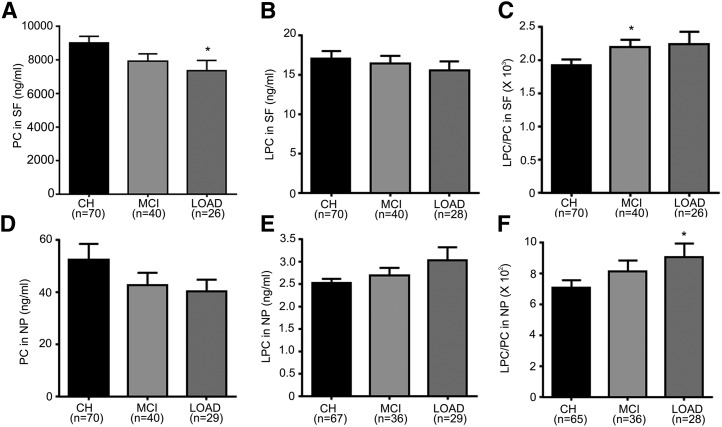
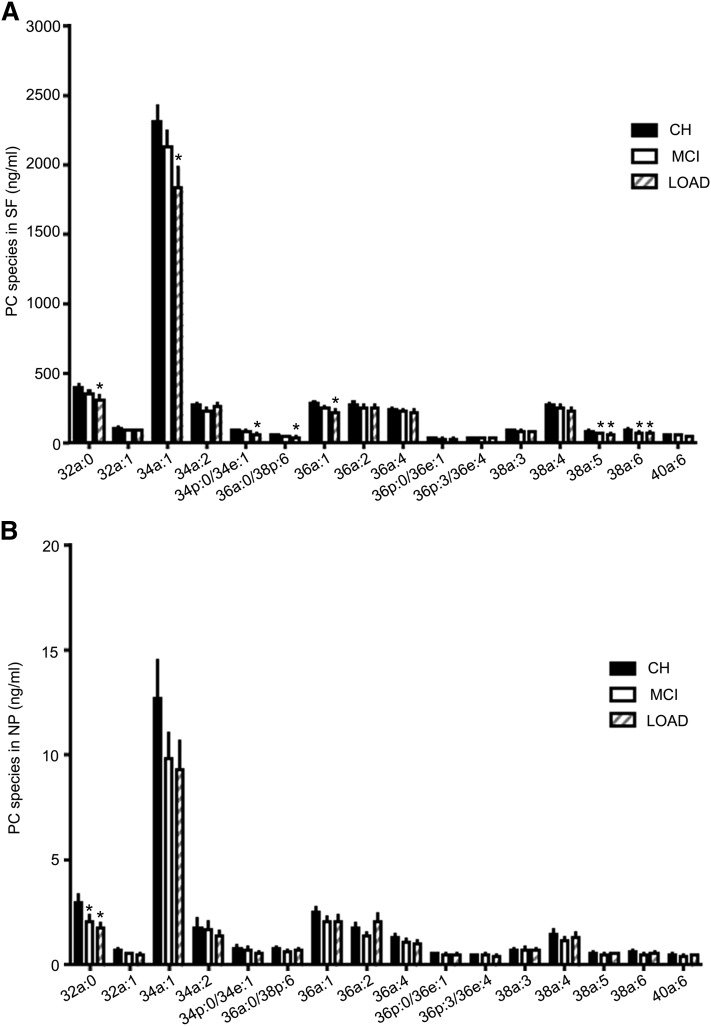
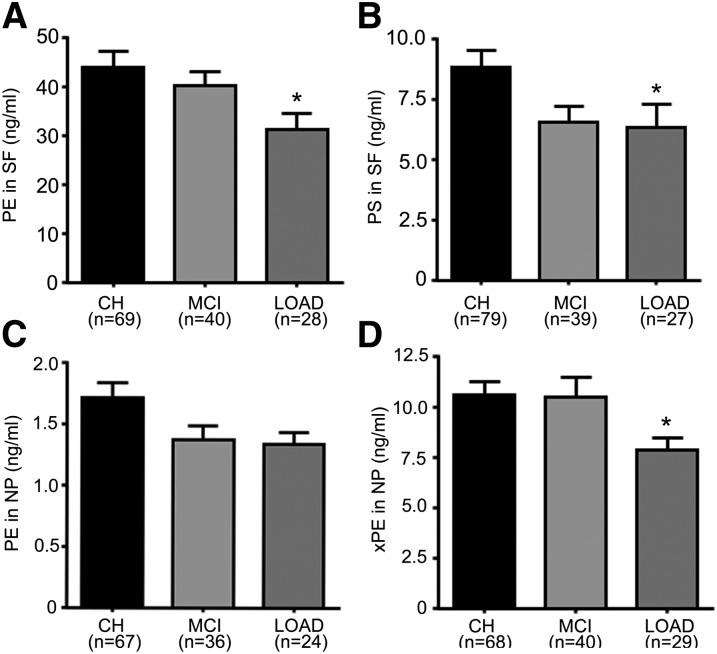
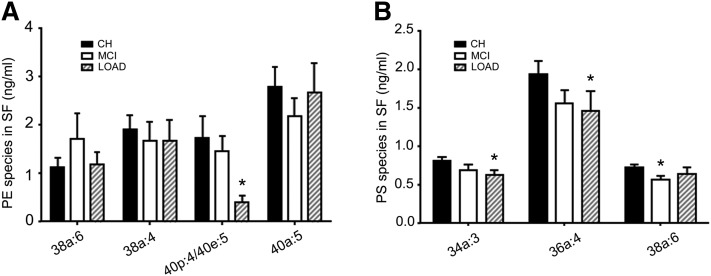
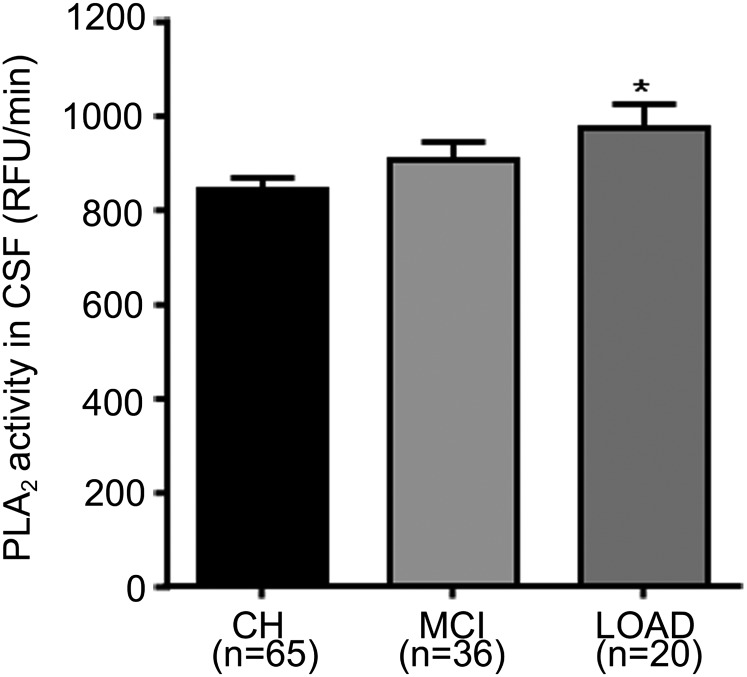
Our aim is to study selected cerebrospinal fluid (CSF) glycerophospholipids (GP) that are important in brain pathophysiology. We recruited cognitively healthy (CH), minimally cognitively impaired (MCI), and late onset Alzheimer's disease (LOAD) study participants and collected their CSF. After fractionation into nanometer particles (NP) and supernatant fluids (SF), we studied the lipid composition of these compartments. LC-MS/MS studies reveal that both CSF fractions from CH subjects have N-acyl phosphatidylethanolamine, 1-radyl-2-acyl-sn-glycerophosphoethanolamine (PE), 1-radyl-2-acyl-sn-glycerophosphocholine (PC), 1,2-diacyl-sn-glycerophosphoserine (PS), platelet-activating factor-like lipids, and lysophosphatidylcholine (LPC). In the NP fraction, GPs are enriched with a mixture of saturated, monounsaturated, and polyunsaturated fatty acid species, while PE and PS in the SF fractions are enriched with PUFA-containing molecular species. PC, PE, and PS levels in CSF fractions decrease progressively in participants from CH to MCI, and then to LOAD. Whereas most PC species decrease equally in LOAD, plasmalogen species account for most of the decrease in PE. A significant increase in the LPC-to-PC ratio and PLA2 activity accompanies the GP decrease in LOAD. These studies reveal that CSF supernatant fluid and nanometer particles have different GP composition, and that PLA2 activity accounts for altered GPs in these fractions as neurodegeneration progresses.
Keywords: lipid metabolism; liquid chromatography; mass spectrometry; minimal cognitive impairment; nanoparticles; neurodegeneration.
Figures
Similar articles
-
Human cerebrospinal fluid fatty acid levels differ between supernatant fluid and brain-derived nanoparticle fractions, and are altered in Alzheimer's disease.PLoS One. 2014 Jun 23;9(6):e100519. doi: 10.1371/journal.pone.0100519. eCollection 2014. PLoS One. 2014. PMID: 24956173 Free PMC article.
-
Lipid Metabolism in Late-Onset Alzheimer's Disease Differs from Patients Presenting with Other Dementia Phenotypes.Int J Environ Res Public Health. 2019 Jun 5;16(11):1995. doi: 10.3390/ijerph16111995. Int J Environ Res Public Health. 2019. PMID: 31195602 Free PMC article.
-
Polyunsaturated Fatty Acid Composition of Cerebrospinal Fluid Fractions Shows Their Contribution to Cognitive Resilience of a Pre-symptomatic Alzheimer's Disease Cohort.Front Physiol. 2020 Feb 14;11:83. doi: 10.3389/fphys.2020.00083. eCollection 2020. Front Physiol. 2020. PMID: 32116789 Free PMC article.
-
Glycerophospholipids and glycerophospholipid-derived lipid mediators: a complex meshwork in Alzheimer's disease pathology.Prog Lipid Res. 2011 Oct;50(4):313-30. doi: 10.1016/j.plipres.2011.06.001. Epub 2011 Jun 15. Prog Lipid Res. 2011. PMID: 21703303 Review.
-
Membrane phospholipid alterations in Alzheimer's disease: deficiency of ethanolamine plasmalogens.Neurochem Res. 1997 Apr;22(4):523-7. doi: 10.1023/a:1027380331807. Neurochem Res. 1997. PMID: 9130265 Review.
Cited by
-
The Differences of Serum Metabolites Between Patients With Early-Stage Alzheimer's Disease and Mild Cognitive Impairment.Front Neurol. 2019 Nov 22;10:1223. doi: 10.3389/fneur.2019.01223. eCollection 2019. Front Neurol. 2019. PMID: 31824405 Free PMC article.
-
Determining the role of novel metabolic pathways in driving intracranial pressure reduction after weight loss.Brain Commun. 2023 Oct 18;5(5):fcad272. doi: 10.1093/braincomms/fcad272. eCollection 2023. Brain Commun. 2023. PMID: 37901040 Free PMC article.
-
Human cerebrospinal fluid fatty acid levels differ between supernatant fluid and brain-derived nanoparticle fractions, and are altered in Alzheimer's disease.PLoS One. 2014 Jun 23;9(6):e100519. doi: 10.1371/journal.pone.0100519. eCollection 2014. PLoS One. 2014. PMID: 24956173 Free PMC article.
-
Sphingolipid metabolism correlates with cerebrospinal fluid Beta amyloid levels in Alzheimer's disease.PLoS One. 2015 May 4;10(5):e0125597. doi: 10.1371/journal.pone.0125597. eCollection 2015. PLoS One. 2015. PMID: 25938590 Free PMC article.
-
Combined Sepiapterin Reductase and Methylmalonyl-CoA Epimerase Deficiency in a Second Patient: Cerebrospinal Fluid Polyunsaturated Fatty Acid Level and Follow-Up Under L-DOPA, 5-HTP and BH4 Trials.JIMD Rep. 2015;22:47-55. doi: 10.1007/8904_2015_410. Epub 2015 Mar 13. JIMD Rep. 2015. PMID: 25763508 Free PMC article.
References
Publication types
MeSH terms
Substances
LinkOut - more resources
Full Text Sources
Other Literature Sources
Medical
Miscellaneous
