. 2013 Sep;33(9):2088-96.
doi: 10.1161/ATVBAHA.113.301375. Epub 2013 Jul 18.

Induction of ATF3 gene network by triglyceride-rich lipoprotein lipolysis products increases vascular apoptosis and inflammation

Affiliations

Induction of ATF3 gene network by triglyceride-rich lipoprotein lipolysis products increases vascular apoptosis and inflammation

Hnin H Aung et al. Arterioscler Thromb Vasc Biol. 2013 Sep.

Abstract

Objective: Elevation of triglyceride-rich lipoproteins (TGRLs) contributes to the risk of atherosclerotic cardiovascular disease. Our work has shown that TGRL lipolysis products in high physiological to pathophysiological concentrations cause endothelial cell injury; however, the mechanisms remain to be delineated.

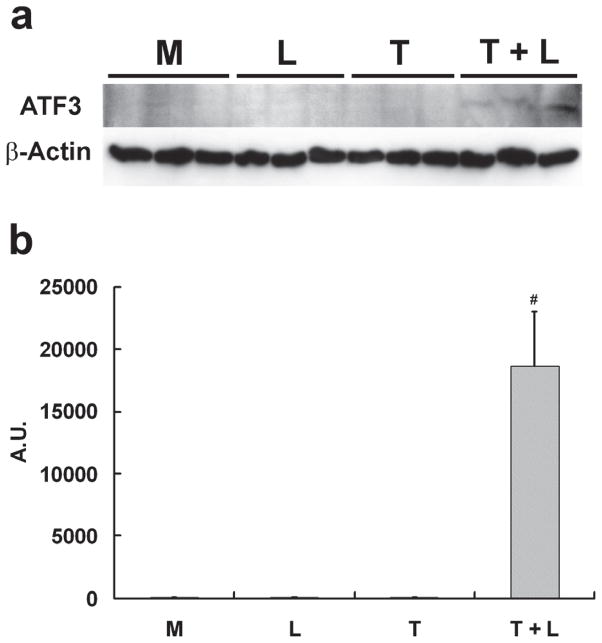
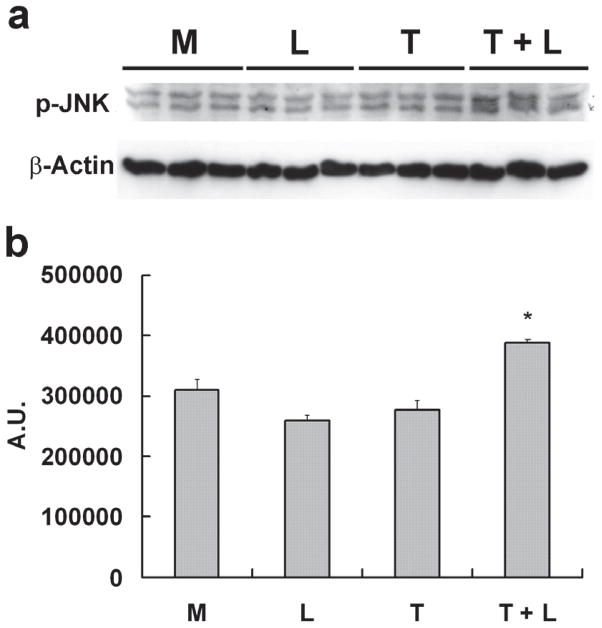
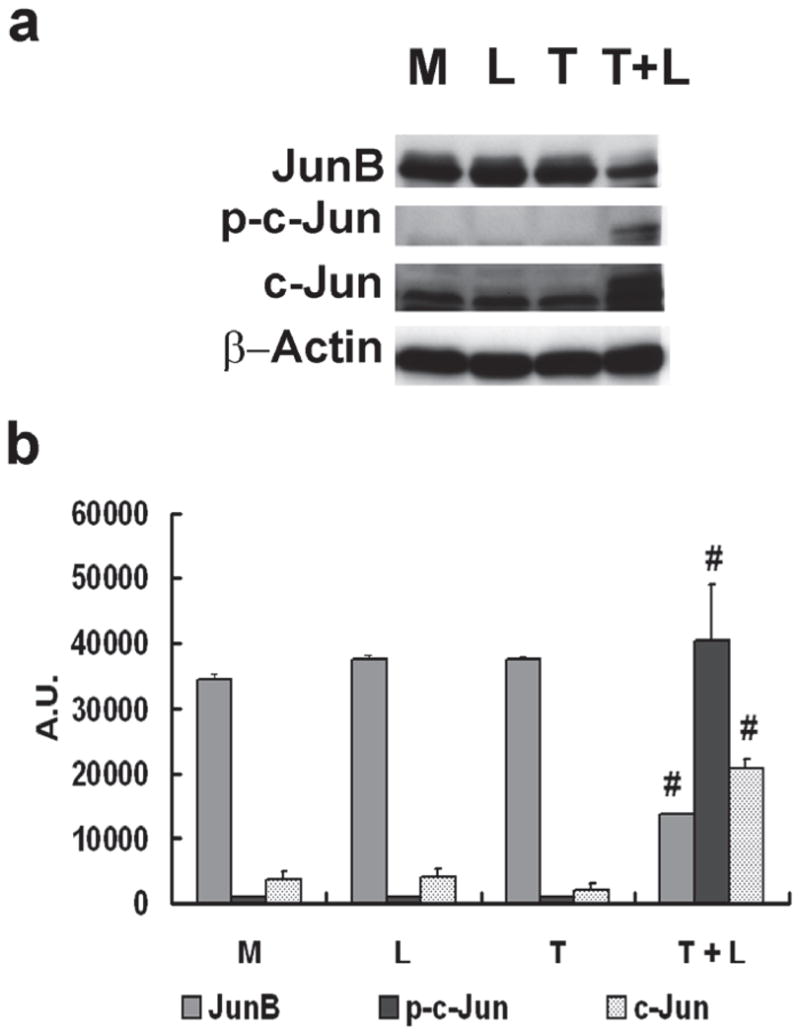
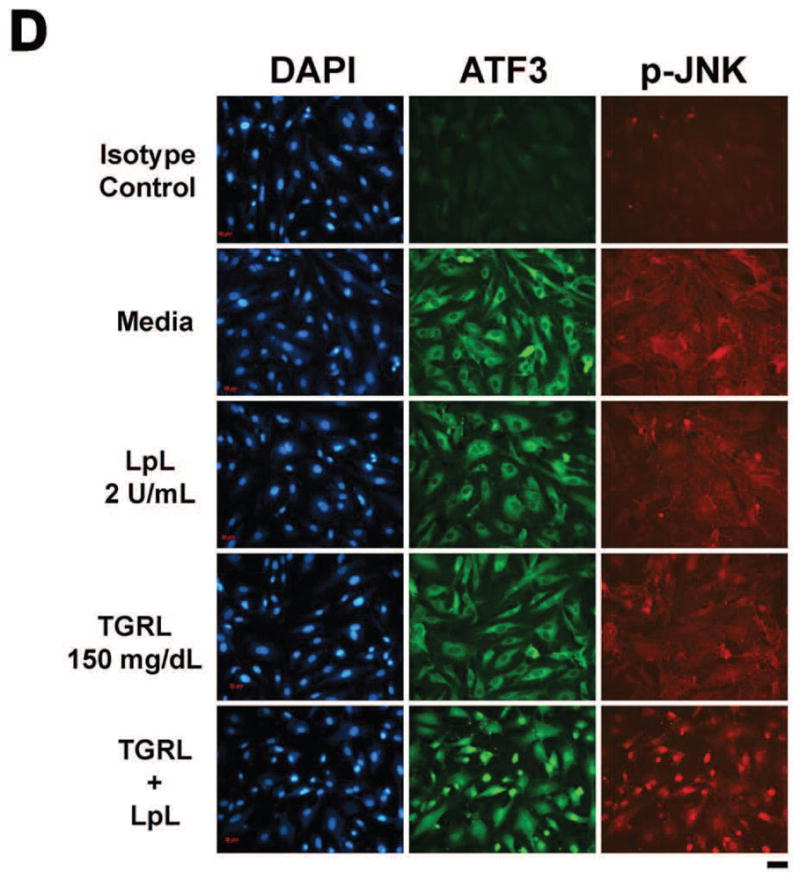
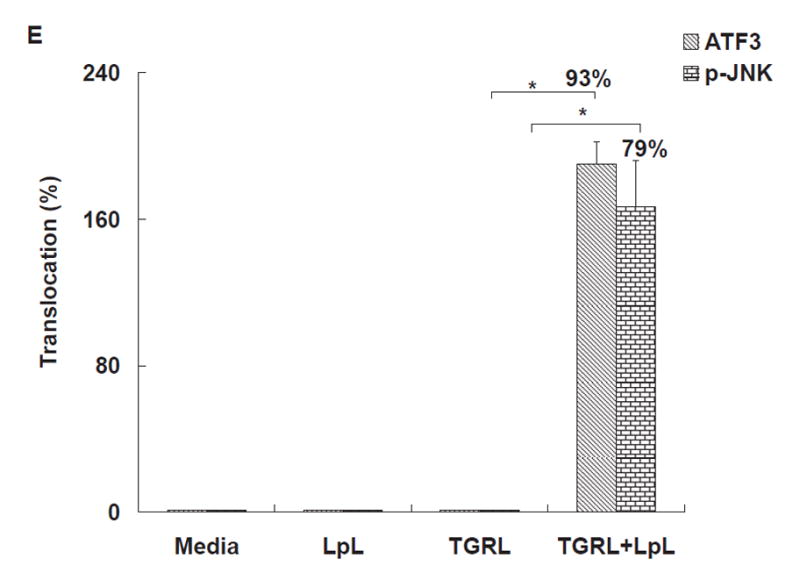
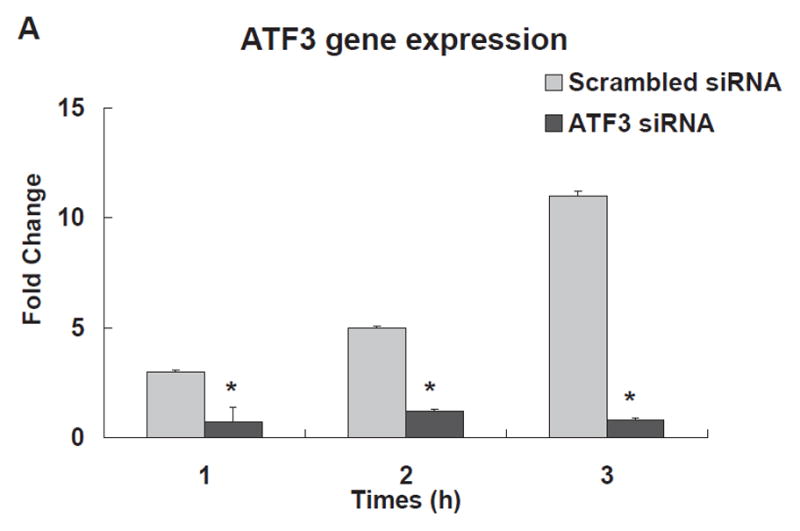
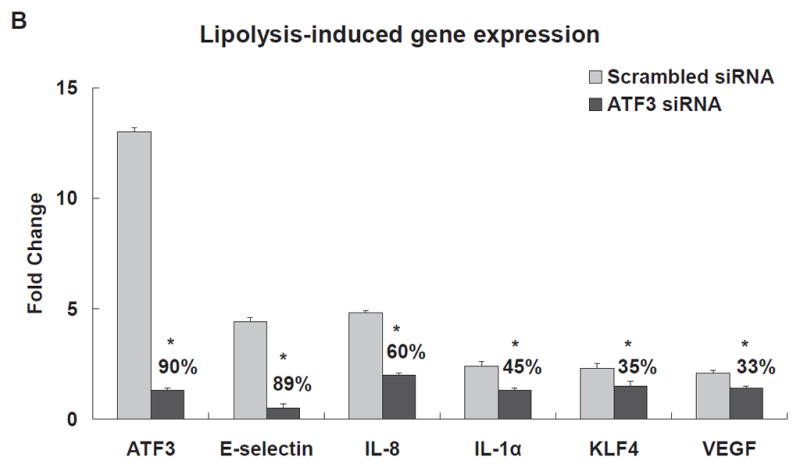
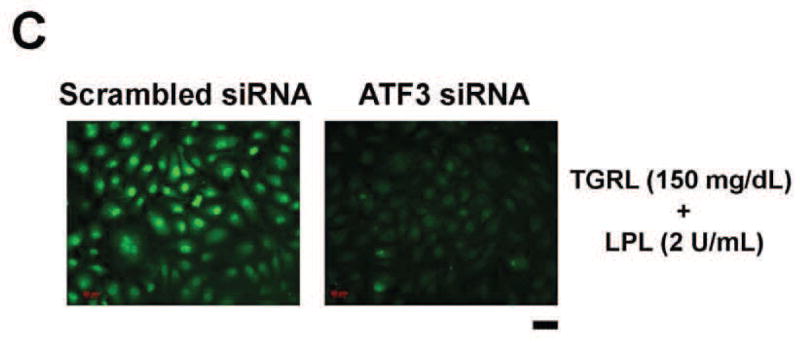
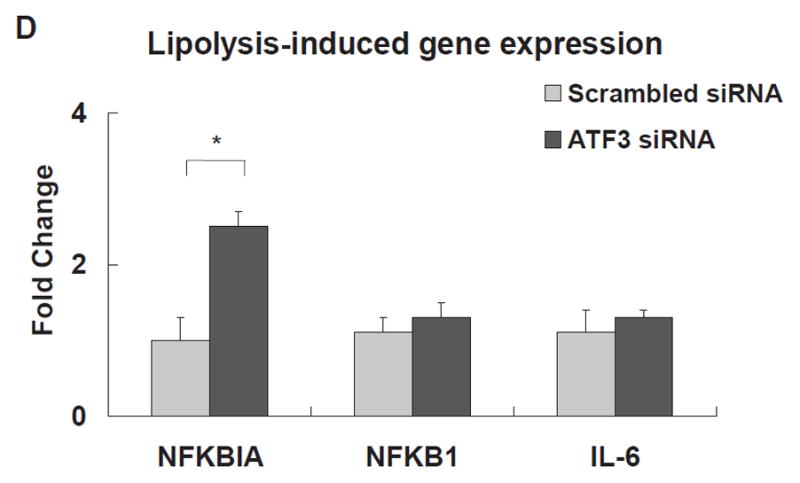
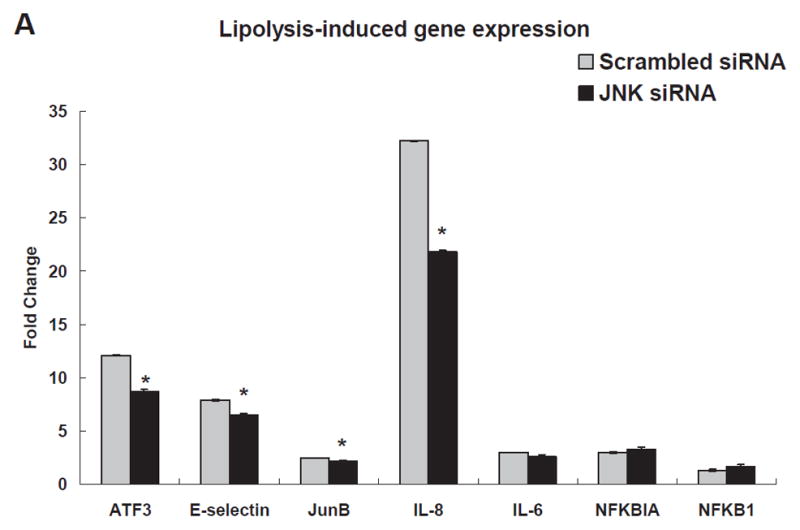
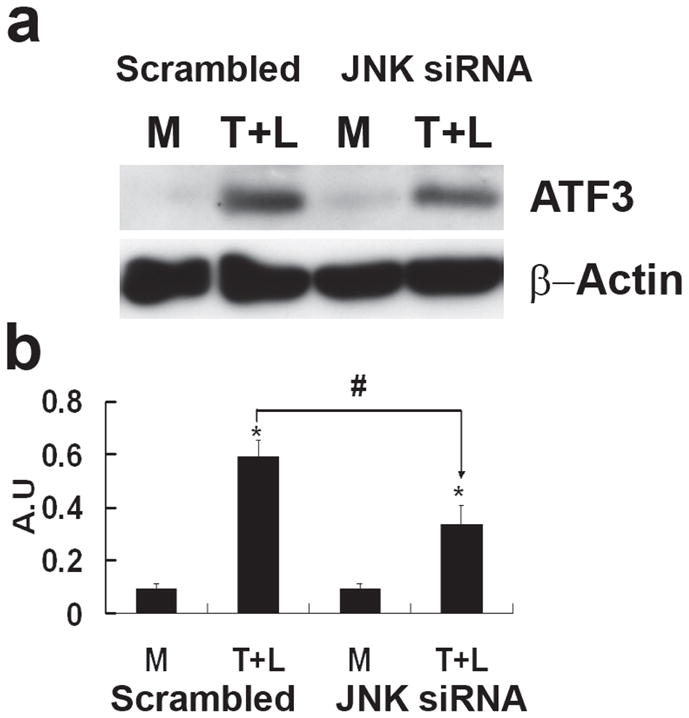
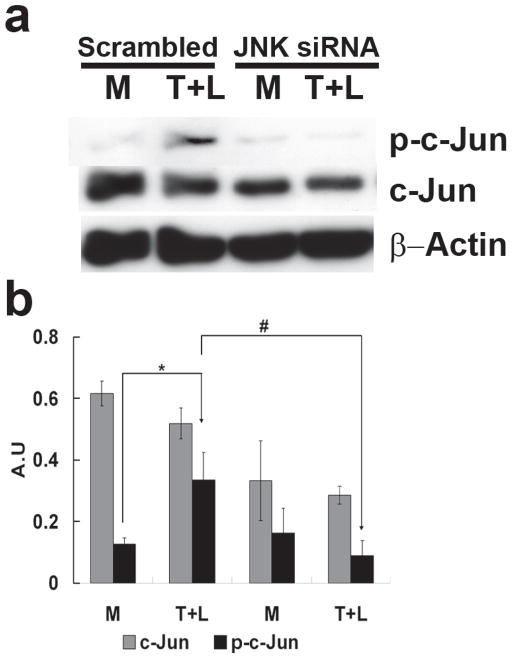
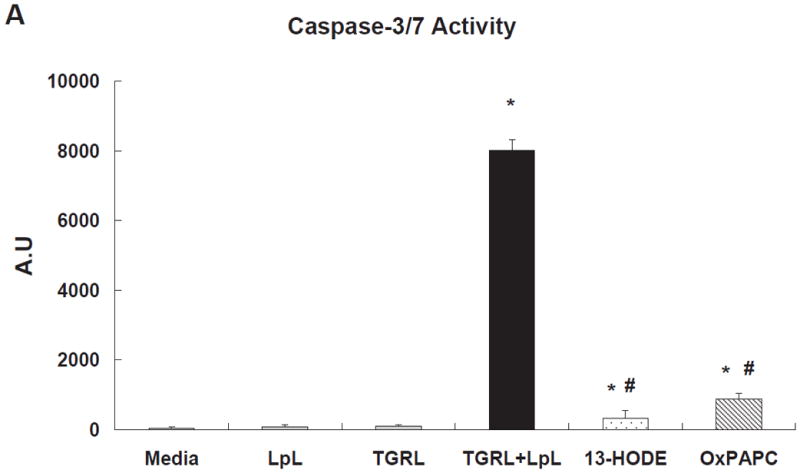
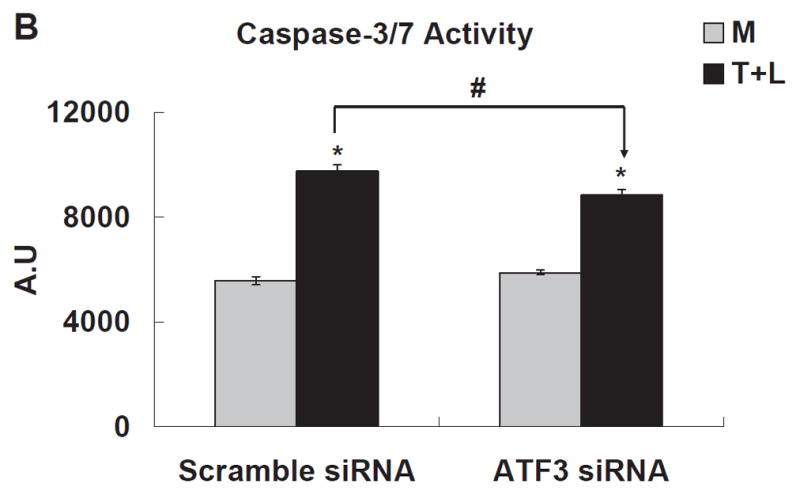
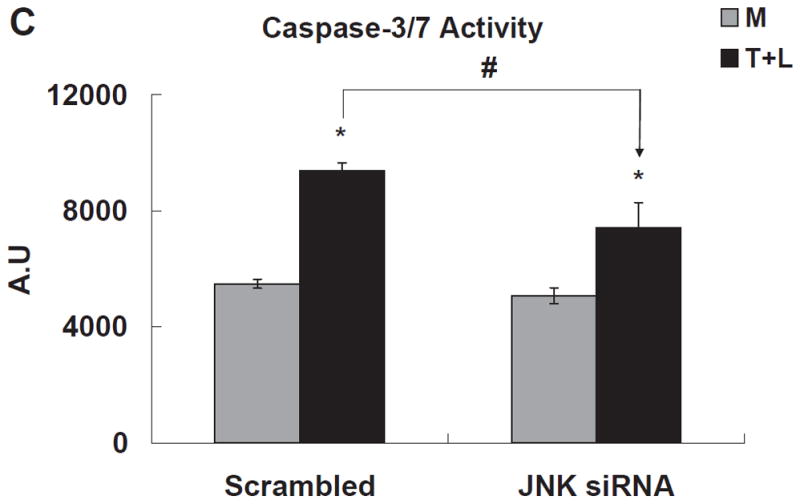
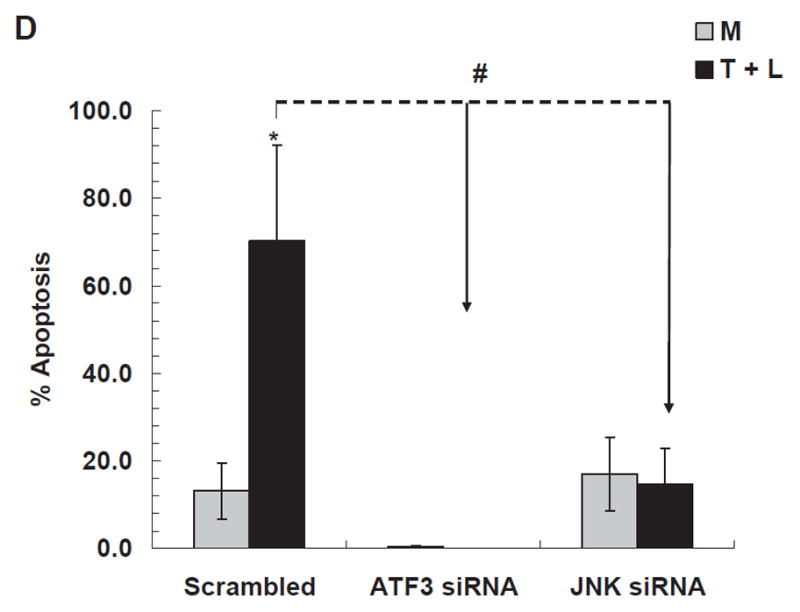
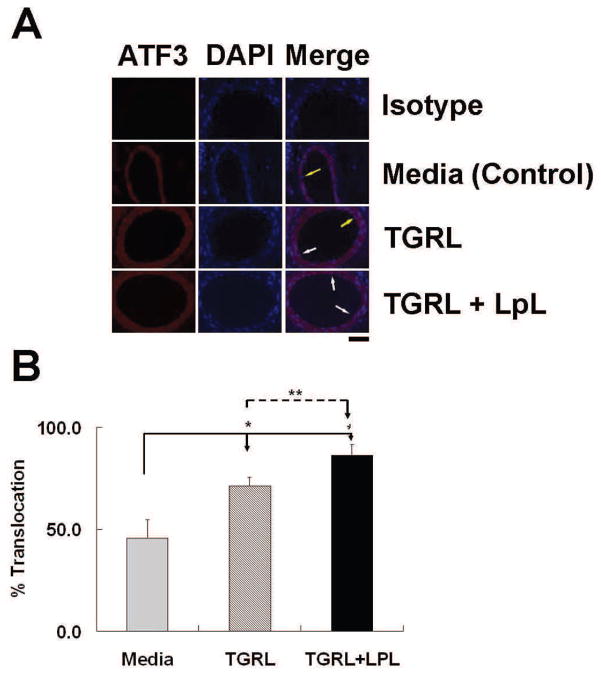
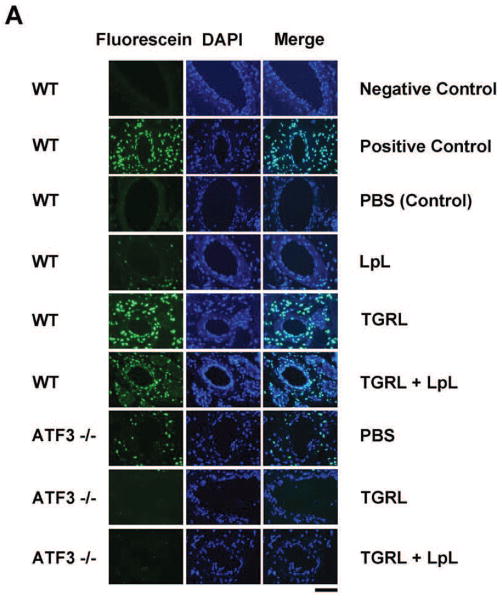
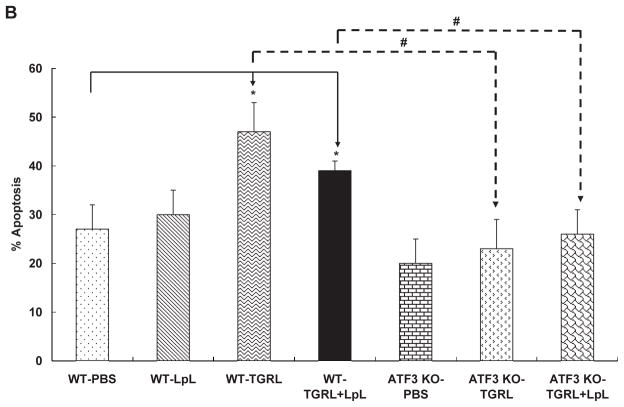
Approach and results: We analyzed the transcriptional signaling networks in arterial endothelial cells exposed to TGRL lipolysis products. When human aortic endothelial cells in culture were exposed to TGRL lipolysis products, activating transcription factor 3 (ATF3) was identified as a principal response gene. Induction of ATF3 mRNA and protein was confirmed by quantitative reverse-transcription polymerase chain reaction and Western blot respectively. Immunofluorescence analysis showed that ATF3 accumulated in the nuclei of cells treated with lipolysis products. Nuclear expression of phosphorylated c-Jun N-terminal kinase (JNK), previously shown to be an initiator of the ATF3 signaling cascade, also was demonstrated. Small interfering RNA (siRNA)-mediated inhibition of ATF3 blocked lipolysis products-induced transcription of E-selectin and interleukin-8, but not interleukin-6 or nuclear factor-κB. c-Jun, a downstream protein in the JNK pathway, was phosphorylated, whereas expression of nuclear factor-κB-dependent JunB was downregulated. Additionally, JNK siRNA suppressed ATF3 and p-c-Jun protein expression, suggesting that JNK is upstream of the ATF3 signaling pathway. In vivo studies demonstrated that infusion of TGRL lipolysis products into wild-type mice induced nuclear ATF3 accumulation in carotid artery endothelium. ATF3(-/-) mice were resistant to vascular apoptosis precipitated by treatment with TGRL lipolysis products. Also peripheral blood monocytes isolated from postprandial humans had increased ATF3 expression as compared with fasting monocytes.

Conclusions: This study demonstrates that TGRL lipolysis products activate ATF3-JNK transcription factor networks and induce endothelial cells inflammatory response.

Keywords: activating transcription factor 3; inflammation; lipolysis; lipoproteins; oligonucleotide arrays.


Figures

Figure 1
Figure 1. TGRL lipolysis products increase ATF3, p-JNK, p-c-Jun, and c-Jun protein expression and translocation of ATF3 and p-JNK from the cytoplasm to the nucleus
HAEC were exposed to TGRL lipolysis products (T+L), media (M), LpL (L), or TGRL (T) for 3 h. Cell lysates were analyzed by western blotting (a) and (b) densitometry. A) Protein expression of ATF3 after the 4 treatments described above; B) Protein expression of p-JNK; C) Protein expression of c-Jun, phosphorylated c-Jun (p-c-Jun), and JunB. For A–C, n=3, # P≤0.05, T+L compared to M, L, or T. D) Immunofluorescence images of ATF3 and p-JNK showing transition of cytosolic to nuclear localizationtranslocation of ATF3 and p-JNK from the cytoplasm to the nucleus following lipolysis product exposure (Bar = 40 μm). DAPI for nucleus stain. E) Percentage of cells with nuclear staining for ATF3 and p-JNK following lipolysis product exposure, n=5 coverslips/treatment group, *P≤0.04 for comparisons between TGRL + LpL to TGRL alone.
Figure 2
Figure 2. Effect of ATF3 siRNA
The expression of each gene was normalized to that of GAPDH and the fold change was calculated as the difference in expression with TGRL lipolysis products in the presence of scrambled siRNA and ATF3 siRNA (n = 3, *P≤0.05). Samples pretreated with siRNA 18 h prior to lipolysis product exposure A) Effect of ATF3 siRNA relative to time on ATF3 levels. B) Alterations in the transcription of ATF3, E-selectin, IL-8, IL-1α, KLF4 and VEGF, C) ATF3 protein expression, as monitored by immunofluorescence was suppressed by ATF3 siRNA (Bar = 40 μm). D) Alterations of NFKBIA, NFKB1 and IL-6 gene expression.
Figure 3
Figure 3. Effect of JNK siRNA on gene transcription and translation
A) Alterations in gene transcription is normalized to that of GAPDH with fold changes calculated as the difference in expression of factors in the presence of TGRL lipolysis products and the exposure to either scrambled siRNA and JNK siRNA. Cells were exposed to siRNA 48 h prior to lipolysis product treatment (n=3, *P≤0.05) B) Alterations in ATF3 protein C) Alterations in p-c-Jun and c-Jun. For both B and C, (a) western blot, (b) densitometry quantification; n=3, *P≤0.05 for comparisons between scrambled siRNA exposed to M and T+L or JNK siRNA exposed to M and T+L; # P≤0.05 difference between T+L in scrambled siRNA and JNK siRNA.
Figure 4
Figure 4. TGRL lipolysis increased apoptosis as measured by caspase-3/7 & TUNEL assays
A) Caspase-3/7 activity was significantly increased with TGRL lipolysis (TGRL + LpL) after 3 h of incubation. * = TGRL + LpL compared to media, LpL, or TGRL alone and oxPAPC or 13-HODE compared to media; # = oxPAPC (40 μg/mL) or 13-HODE (50 μM) compared to TGRL + LpL treatment. B) The caspase-3/7 activity significantly decreased in HAEC pre-treated with ATF3 siRNA transfected for 18 h. C) HAEC transfected with JNK siRNA for 48 h and treated with TGRL lipolysis products for 3 h. * = TGRL + LpL compared to media; # = scrambled compared to either ATF3 or JNK siRNA treatment for T+L. For A, B and C, N=5 treatments/group, P≤0.05, D) TGRL lipolysis product-induced apoptosis is significantly reduced by ATF3 siRNA and JNK siRNA. N=4 treatments/group, *P≤0.05 compared to Media control, #P≤0.05 scrambled compared either ATF3 or JNK siRNA treatment for T+L assayed by TUNEL.
Figure 5
Figure 5. TGRL lipolysis products activate ATF3 expression in mouse carotid arteries
A) Immunostaining for ATF3 protein expression; B) Quantitative evaluation of ATF3 expression in the mice carotid arteries after perfusion with media alone, TGRL alone, or TGRL lipolysis (TGRL + LpL) for 15 min. N = 4 mice/group, *P≤0.02, **P≤0.05. Original magnification 60X. White arrow (ATF3 accumulation in nucleus), yellow arrow (nuclear staining absent).
Figure 6
Figure 6. TGRL lipolysis product-induced apoptosis is reduced in ATF3−/− mouse carotid arteries
A) TUNEL staining of mouse carotid artery; B) % apoptosis of endothelial cell based on FITC and nuclear staining. Both TGRL (47%) and TGRL lipolysis (TGRL + LpL) (39%) significantly induced apoptosis compare to PBS control only in WT carotid arteries, not in ATF3−/− mice. Positive control: DNAse I treated; Negative control: without rTdT enzyme. N = 4 mice/group, *P≤0.05 compared to PBS control of WT mice, #P≤0.05 ATF3−/−compared to WT treatment group. Bar = 20μm.

References

    1. Kannel WB, Vasan RS. Triglycerides as vascular risk factors: new epidemiologic insights. Curr Opin Cardiol. 2009;24(4):345–350. - PMC - PubMed
    1. Norata GD, Grigore L, Raselli S, Seccomandi PM, Hamsten A, Maggi FM, Eriksson P, Catapano AL. Triglyceride-rich lipoproteins from hypertriglyceridemic subjects induce a pro-inflammatory response in the endothelium: Molecular mechanisms and gene expression studies. Journal of molecular and cellular cardiology. 2006;40(4):484–494. - PubMed
    1. Norata GD, Grigore L, Raselli S, Redaelli L, Hamsten A, Maggi F, Eriksson P, Catapano AL. Post-prandial endothelial dysfunction in hypertriglyceridemic subjects: molecular mechanisms and gene expression studies. Atherosclerosis. 2007;193(2):321–327. - PubMed
    1. Ting HJ, Stice JP, Schaff UY, Hui DY, Rutledge JC, Knowlton AA, Passerini AG, Simon SI. Triglyceride-rich lipoproteins prime aortic endothelium for an enhanced inflammatory response to tumor necrosis factor-alpha. Circulation research. 2007;100(3):381–390. - PubMed
    1. Wang L, Gill R, Pedersen TL, Higgins LJ, Newman JW, Rutledge JC. Triglyceride-rich lipoprotein lipolysis releases neutral and oxidized FFAs that induce endothelial cell inflammation. J Lipid Res. 2009;50(2):204–213. - PMC - PubMed

Publication types

MeSH terms