. 2013 Jul 19;341(6143):295-8.
doi: 10.1126/science.1235872.

Predicting and manipulating cardiac drug inactivation by the human gut bacterium Eggerthella lenta

Affiliations

Predicting and manipulating cardiac drug inactivation by the human gut bacterium Eggerthella lenta

Henry J Haiser et al. Science. .

Abstract

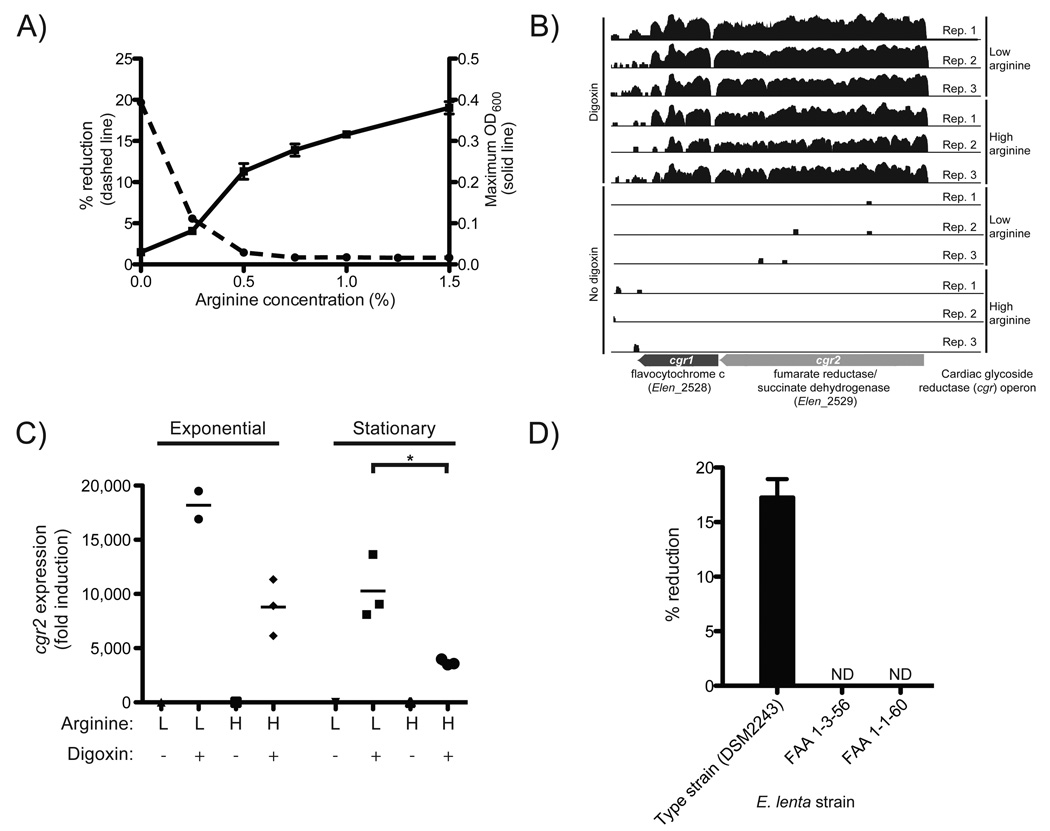
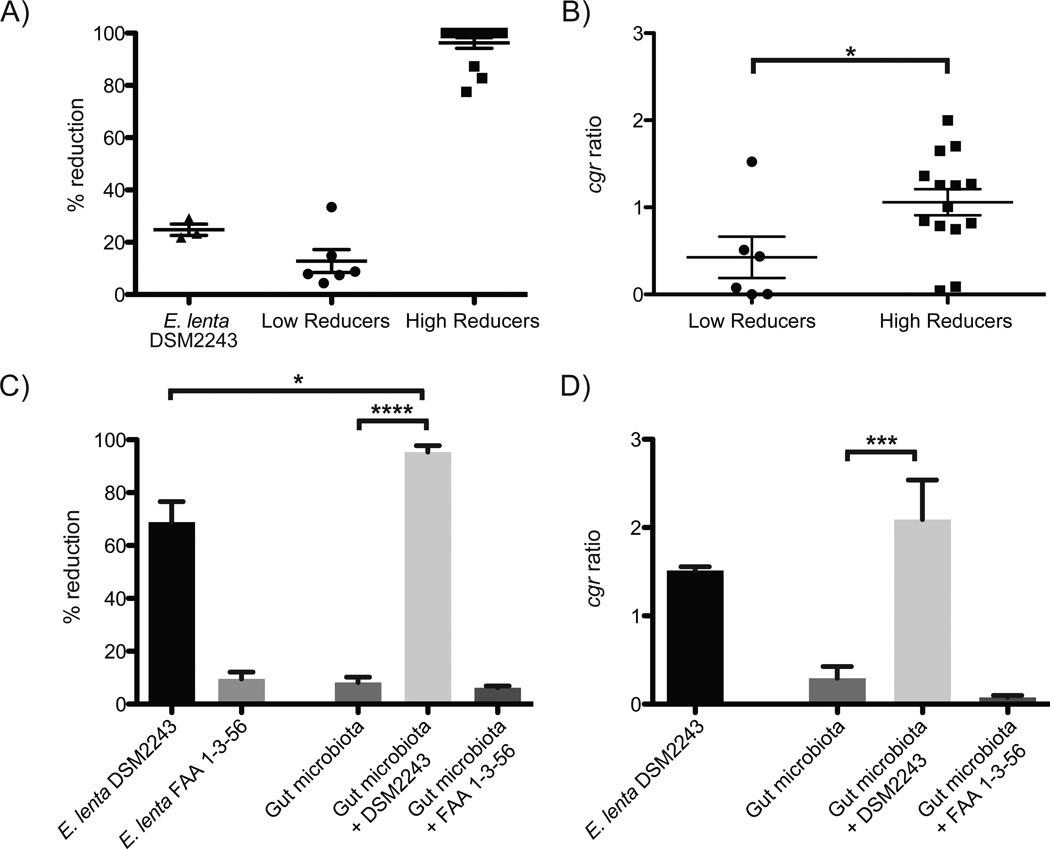
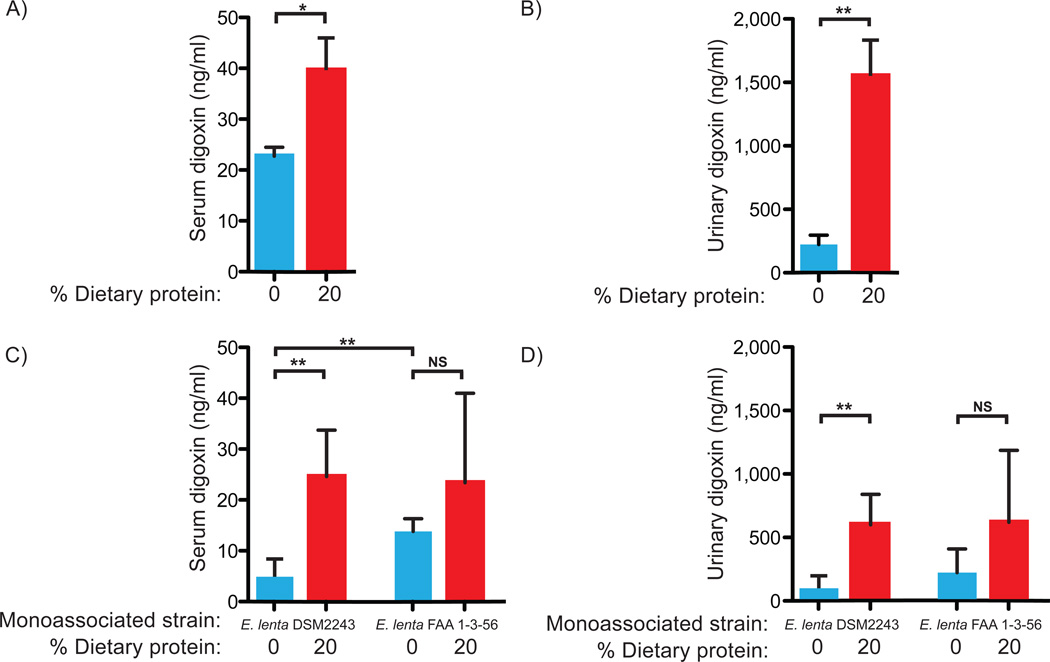
Despite numerous examples of the effects of the human gastrointestinal microbiome on drug efficacy and toxicity, there is often an incomplete understanding of the underlying mechanisms. Here, we dissect the inactivation of the cardiac drug digoxin by the gut Actinobacterium Eggerthella lenta. Transcriptional profiling, comparative genomics, and culture-based assays revealed a cytochrome-encoding operon up-regulated by digoxin, inhibited by arginine, absent in nonmetabolizing E. lenta strains, and predictive of digoxin inactivation by the human gut microbiome. Pharmacokinetic studies using gnotobiotic mice revealed that dietary protein reduces the in vivo microbial metabolism of digoxin, with significant changes to drug concentration in the serum and urine. These results emphasize the importance of viewing pharmacology from the perspective of both our human and microbial genomes.


Figures

Fig. 1
Fig. 1. Discovery of a bacterial operon induced by digoxin
(A) Arginine stimulates the growth of E. lenta DSM2243 in vitro while blocking the reduction of digoxin. Maximum OD600 (solid line; values are the mean±sem; n=3) and digoxin % reduction efficiency (dashed line; values are the mean; n=2) after 48 hours of growth. (B) RNA-Seq profiles of the cardiac glycoside reductase (cgr) operon are shown with/without digoxin during exponential growth in medium containing low/high arginine. The height is proportional to the natural log of the number of unambiguous sequencing reads mapped to each base. (C) cgr2 transcription as determined by qRT-PCR. Asterisks indicate statistical significance by Student’s t test (P<0.05). Horizontal lines are the mean; n=2–3. (D) Identification of 2 strains of E. lenta incapable of reducing digoxin. Values are the mean±sem; n=3. ND=no reduction detected.
Fig. 2
Fig. 2. A microbial biomarker predicts the inactivation of digoxin
(A) Liquid chromatography/mass spectrometry (LC/MS) was used to quantify digoxin reduction in the fecal microbiomes of 20 unrelated individuals. (B) The cgr ratio was significantly different between low and high reducers. Data represent qPCR using the cgr2 gene, and E. lenta specific 16S rDNA primers (table S4). (C) Five low reducing fecal microbial communities were incubated for five days in the presence or absence of E. lenta DSM2243 or FAA 1-3-56. LC/MS was used to quantify the completion of digoxin reduction. Supplementation with the non-reducing strain of E. lenta did not significantly affect digoxin reduction efficiency. (D) The cgr ratio was obtained for each of the low reducing microbial communities post incubation. Outliers were identified using Grubbs’ test (P<0.01) and removed. Values are the mean±sem. Points in A,B represent biological replicates. Asterisks indicate statistical significance by Student’s t test (*=P<0.05; ***=P<0.001; ****=P<0.0001).
Fig. 3
Fig. 3. Dietary protein blocks the inactivation of digoxin
Serum (A) and urinary (B) digoxin levels from the type strain experiment. Fecal digoxin levels showed a consistent trend: the mean area under the curve was 6.226 ng digoxin*h/mL in germ-free mice, 3.576 for mice on the 0% protein diet, and 6.364 for mice on the 20% protein diet. Serum (C) and urinary (D) digoxin levels from each group. Digoxin levels were quantified by ELISA (7). Values are the mean±sem. Asterisks indicate statistical significance by Student’s t test (*=P<0.05; **=P<0.01). n=4–5 mice/group. NS=not significant.

References

    1. Haiser HJ, Turnbaugh PJ. Is it time for a metagenomic basis of therapeutics? Science. 2012;336:1253–1255. - PubMed
    1. Wallace BD, et al. Alleviating cancer drug toxicity by inhibiting a bacterial enzyme. Science. 2010;330:831–835. - PMC - PubMed
    1. Goodman LS, et al. Goodman & Gilman's the pharmacological basis of therapeutics. ed. 12th. New York: McGraw-Hill; 2011.
    1. Lindenbaum J, et al. Inactivation of digoxin by the gut flora: reversal by antibiotic therapy. N. Engl. J. Med. 1981;305:789–794. - PubMed
    1. Farr CD, et al. Three-dimensional quantitative structure-activity relationship study of the inhibition of Na(+),K(+)-ATPase by cardiotonic steroids using comparative molecular field analysis. Biochemistry. 2002;41:1137–1148. - PubMed

Publication types

MeSH terms

Associated data