

Heat waves in the United States: definitions, patterns and trends
- PMID: 23869115
- PMCID: PMC3711804
- DOI: 10.1007/s10584-012-0659-2
Heat waves in the United States: definitions, patterns and trends
Abstract
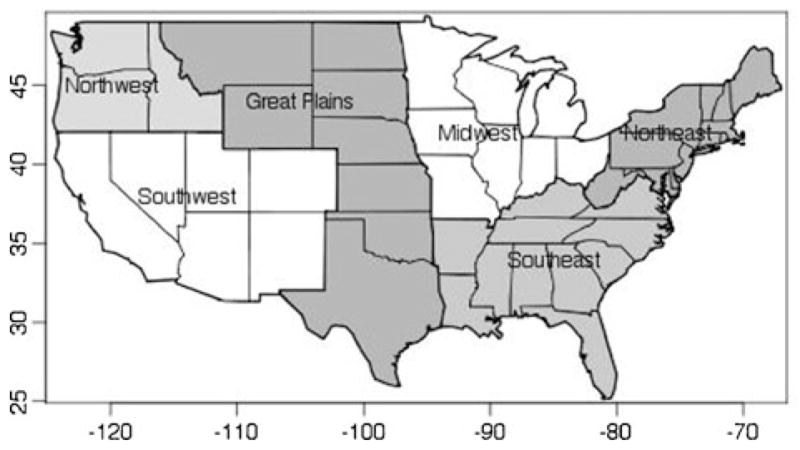
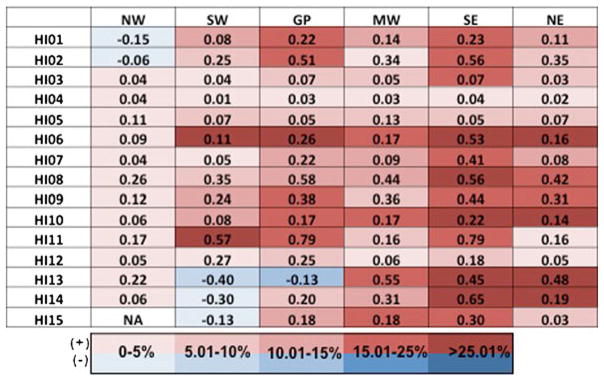
High temperatures and heat waves are related but not synonymous concepts. Heat waves, generally understood to be acute periods of extreme warmth, are relevant to a wide range of stakeholders because of the impacts that these events have on human health and activities and on natural environments. Perhaps because of the diversity of communities engaged in heat wave monitoring and research, there is no single, standard definition of a heat wave. Experts differ in which threshold values (absolute versus relative), duration and ancillary variables to incorporate into heat wave definitions. While there is value in this diversity of perspectives, the lack of a unified index can cause confusion when discussing patterns, trends, and impacts. Here, we use data from the North American Land Data Assimilation System to examine patterns and trends in 15 previously published heat wave indices for the period 1979-2011 across the Continental United States. Over this period the Southeast region saw the highest number of heat wave days for the majority of indices considered. Positive trends (increases in number of heat wave days per year) were greatest in the Southeast and Great Plains regions, where more than 12 % of the land area experienced significant increases in the number of heat wave days per year for the majority of heat wave indices. Significant negative trends were relatively rare, but were found in portions of the Southwest, Northwest, and Great Plains.
Figures
References
-
- Alexander LV, Zhang X, Peterson TC, Caesar J, Gleason B, Tank A, Haylock M, Collins D, Trewin B, Rahimzadeh F, Tagipour A, Kumar KR, Revadekar J, Griffiths G, Vincent L, Stephenson DB, Burn J, Aguilar E, Brunet M, Taylor M, New M, Zhai P, Rusticucci M, Vazquez-Aguirre JL. Global observed changes in daily climate extremes of temperature and precipitation. J Geophys Res-Atmos. 2006;111:22.
-
- Barnett AG, Tong S, Clements ACA. What measure of temperature is the best predictor of mortality? Environ Res. 2010;110:604–611. - PubMed
-
- Cosgrove BA, Lohmann D, Mitchell KE, Houser PR, Wood EF, Schaake JC, Robock A, Marshall C, Sheffield J, Duan QY, Luo LF, Higgins RW, Pinker RT, Tarpley JD, Meng J. Real-time and retrospective forcing in the North American Land Data Assimilation System (NLDAS) project. J Geophys Res-Atmos. 2003;108:12.
Grants and funding
LinkOut - more resources
Full Text Sources