. 2013 Jul 18;154(2):377-90.
doi: 10.1016/j.cell.2013.06.021.

Marking and measuring single microtubules by PRC1 and kinesin-4

Affiliations

Marking and measuring single microtubules by PRC1 and kinesin-4

Radhika Subramanian et al. Cell. .

Erratum in

  • Cell. 2013 Nov 21;155(5):1188

Abstract

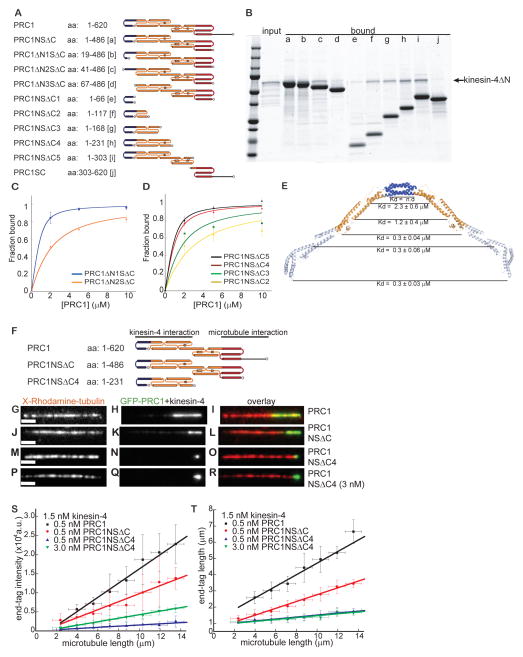
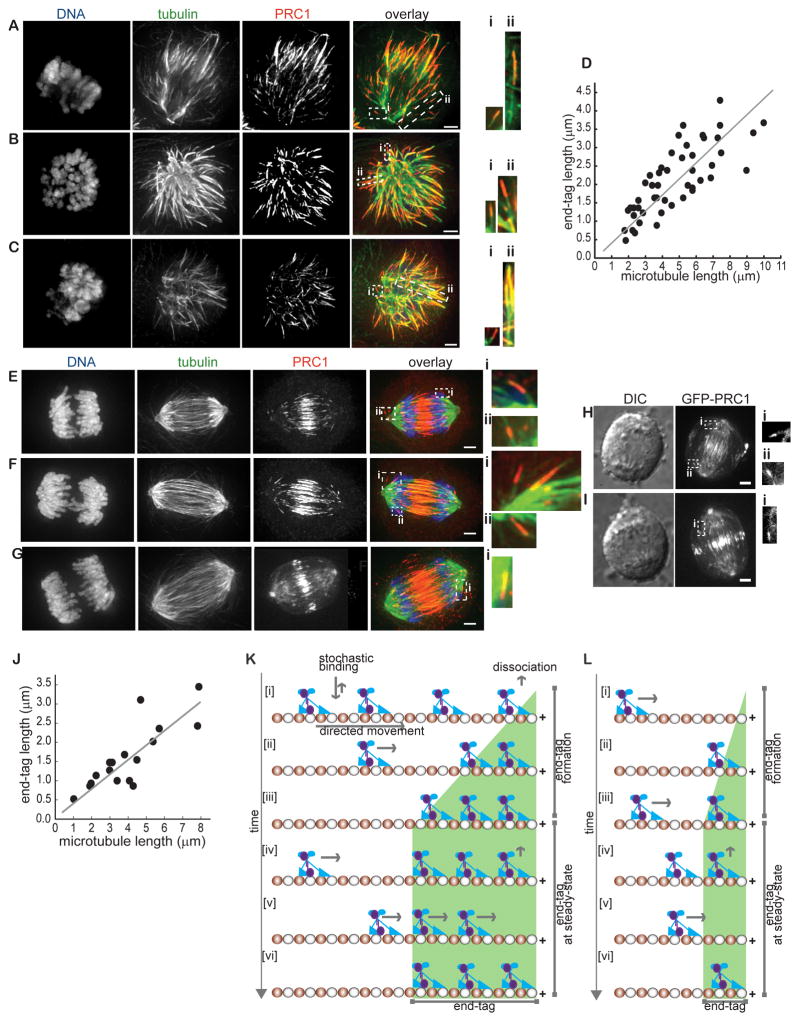
Error-free cell division depends on the assembly of the spindle midzone, a specialized array of overlapping microtubules that emerges between segregating chromosomes during anaphase. The molecular mechanisms by which a subset of dynamic microtubules from the metaphase spindle are selected and organized into a stable midzone array are poorly understood. Here, we show using in vitro reconstitution assays that PRC1 and kinesin-4, two microtubule-associated proteins required for midzone assembly, can tag microtubule plus ends. Remarkably, the size of these tags is proportional to filament length. We determine the crystal structure of the PRC1 homodimer and map the protein-protein interactions needed for tagging microtubule ends. Importantly, length-dependent microtubule plus-end-tagging by PRC1 is also observed in dividing cells. Our findings suggest how biochemically similar microtubules can be differentially marked, based on length, for selective regulation during the formation of specialized arrays, such as those required for cytokinesis.


Figures

Figure 1
Figure 1. The PRC1-kinesin-4 complex tags the ends of single microtubules
(A) Schematic of PRC1 and kinesin-4’s domain organization and the constructs used in binding and microscopy assays. PRC1: N-terminal domain (blue); spectrin domain (red); C-terminal domain (black). Kinesin-4: motor domain (blue); coiled coil domain (gray); C-terminal Cys-rich domain (yellow). (B) Quantitative analysis of the PRC1-kinesin-4 binding interaction. Plot of the fraction kinesin4ΔN (0.3 μM) bound to varying amounts of PRC1NSΔC (0.5–10 μM) (n = 3, mean ± SD). The data were fit to a hyperbola (see methods) to determine the dissociation constant (KD = 0.3 ± 0.03 μM). (C) Schematic of the TIRF microscopy assay used for examining GFP-PRC1’s (purple) binding to a single microtubule (red). Microtubules were sparsely labeled with X-Rhodamine and biotin and immobilized on a glass surface (black line) via biotin-neutravidin linkages (black circles). (D–F) Representative image shows microtubules (D), associated GFP-PRC1 (E) and overlay of the two images (red: microtubules; green: PRC1) (F). (G) Line-scan of GFP-PRC1-bound microtubule marked by an arrow in Fig. 1F. (H) Schematic of the assay used for examining kinesin-4-GFP’s (blue) binding to single microtubules. (I–K) Representative image shows microtubules (I), associated kinesin-4-GFP (J) and overlay of the two images (red: microtubules; green: kinesin-4-GFP) (K). (L) Line-scan of kinesin-4-GFP-bound microtubule marked by an arrow in Fig. 1J. (M) Schematic of the assay used for examining GFP-PRC1’s (purple) binding to single microtubules in the presence of kinesin-4 (blue). (N–P) Representative image shows microtubules (N), associated GFP-PRC1 in the presence of kinesin-4 (O) and overlay of the two images (red: microtubules; green: PRC1) (P). (Q) Line-scan of GFP-PRC1 and kinesin-4 bound microtubule marked by an arrow in Fig. 1P. Assay conditions: PRC1 (0.25 nM) and kinesin-4 (1.5 nM, 1 mM MgATP). Scale bars = 2.5 μm. See also Figure S1.
Figure 2
Figure 2. Size of the PRC1-kinesin-4 end-tag depends on microtubule length and protein concentration
(A) Schematic of the assay used for examining GFP-PRC1’s (purple) binding to single microtubules (red) in the presence of kinesin-4 (blue). (B–D) Representative images of microtubules of different lengths (B), associated GFP-PRC1 (0.25 nM) (C) and (D) overlay of the two images (red: microtubules; green: PRC1). Kinesin-4 was at 1.5 nM. (E) Plot of end-tag intensity as a function of microtubule length in assays with kinesin-4 (1.5 nM) and GFP-PRC1: 0.1 nM (blue; slope = 756±56 a.u./μm, N = 195), 0.25 nM (red; slope = 1960±182 a.u./μm, N = 236), 0.5 nM (black; slope = 3561±183 a.u./μm, N = 275). (F) Plot of end-tag length as a function of microtubule length in assays with kinesin-4 (1.5 nM) and GFP-PRC1: 0.1 nM (blue; slope = 0.22±0.02, N = 195), 0.25 nM (red; slope = 0.26±0.02, N = 236) and 0.5 nM (black; slope = 0.42±0.02, N = 275). (G) Schematic of the assay used for examining kinesin-4-GFP’s binding to single microtubules. (H–J) Representative image of a microtubule (H), associated kinesin-4-GFP (1.5 nM) (I) and overlay of the two images (red: microtubules; green: kinesin-4) (J). (K) Schematic of the assay used for examining kinesin-4-GFP’s binding to single microtubules in the presence of PRC1. (L–N) Representative image of a microtubule (L), associated kinesin-4-GFP (1.5 nM) in the presence PRC1 (0.4 nM) (M), and overlay of the two images (red: microtubules; green: kinesin-4) (N). (O) Plot of end-tag intensity as a function of microtubule length in assays with GFP-kinesin-4 (1.5 nM) and PRC1: 0 nM (blue; slope = 2116±171 a.u./μm, N =116), 0.1 nM (red; slope = 3085±357 a.u./μm, N =119) or 0.4 nM (black; slope = 5337±126 a.u./μm, N =172). (P) Plot of end-tag length as a function of microtubule length in assays with GFP-kinesin-4 (1.5 nM) and PRC1: 0 nM (blue; slope = 0.09±0.007, N =116), 0.1 nM (red; slope = 0.12±0.005, N =119) or 0.4 nM (black; slope = 0.27±0.03, N =172). All experiments include 1mM MgATP. Error bars are standard deviations. Scale bar = 2.5 μm. See also Figure S2.
Figure 3
Figure 3. PRC1-kinesin-4 microtubule end-tags are dynamic steady-state structures
(A) Schematic of the assay used for examining end-tag formation by GFP-PRC1 (purple) and kinesin-4 (blue) on single microtubules (red). (B–C) Image of a microtubule (B) and associated GFP-PRC1 (C) from a time-lapse sequence acquired during end-tag formation. Assay conditions: PRC1 (0.1 nM) and kinesin-4 (1.5 nM). (D) Kymograph corresponding to the time-lapse sequence in Fig. 3C. (E) Portion of the boxed region (yellow dashed rectangle) in Fig. 3D. Image contrast (greyscale) is adjusted to highlight the GFP-PRC1 signal along the microtubule. (F) Schematic of the ‘pulse-chase’ type assay for examining GFP-PRC1 dynamics at the end-tag. (G–H) Image of a microtubule (G) and associated GFP-PRC1 (H) from a time-lapse sequence acquired after addition of unlabeled proteins to microtubules end-tagged with GFP-PRC1 and kinesin-4. Assay conditions: PRC1 (0.15 nM) and kinesin-4 (0.5 nM). (I) Kymograph corresponding to the time-lapse sequence in Fig. 3H. All assays include 1mM MgATP. Scale bars: distance = 2.5 μm; time = 20 s. See also Figure S3.
Figure 4
Figure 4. PRC1 is an elongated rod-shaped molecule
(A) Schematic of PRC1’s domain organization and the construct used for x-ray crystallography (blue and orange: N-terminal domains; red: spectrin domain; black: C-terminal unstructured domain). (B) Ribbon diagram shows the structure of a single PRC1 polypeptide within the homodimer. Dimerization domain (blue): helices H1-H2 and loop L1, rod domain (orange): helices H2-H7 and loops L2-L6, spectrin domain (red): helices H7-H9 and loops L7-L8. (C) Secondary structure topology map corresponding to the ribbon diagram in Fig. 4B. (D) Examples of contacts between helices and loops mediated by conserved amino acid residues in the rod-domain of PRC1. Sidechain atoms of key amino-acid residues (labeled) in view are shown (N: blue; O: red; S: yellow, C: colored by percent conservation as in the scale bar). (i) Conserved contacts between helix H3 and helix H4. (ii) Conserved contacts between helix H4, helix H5 and loop L4. See also Figure S4.
Figure 5
Figure 5. PRC1 dimerization is mediated by bisecting N-terminal helix-based hairpins
(A) Ribbon diagram of the PRC1NSΔC dimer. The two monomers that form the homodimer are colored red and blue. (B) Enlarged view of PRC1’s dimerization domain. Boxed sections are further enlarged in insets (i) and (ii). The views shown in the insets were generated by rotating the structure as indicated. Sidechain atoms of key amino-acid residues (labeled) mediating the interactions in PRC1’s dimerization domain are shown (N: blue; O: red; S: yellow, C: green). (C) Schematic of the constructs generated to test PRC1’s dimerization. (D) Elution profiles from size-exclusion chromatography of constructs PRC1NSΔC (gray), PRC1ΔN1SΔC (cyan), PRC1ΔN2SΔC (blue), PRC1ΔN3SΔC (black). See also Figure S5.
Figure 6
Figure 6. The size of kinesin-4-PRC1 end-tag depends on the strength of the PRC1-microtubule interaction
(A) Schematic of PRC1 deletion constructs used in binding assays with the non-motor domain at kinesin-4’s C-terminus (kinesin4ΔN: aa 733-1232). (B) SDS-PAGE of the fraction of kinesin4ΔN (1 μM) bound to PRC1 constructs (5 μM) shown in Fig. 1A. (C, D) Band intensities from gels were used to determine fraction kinesin4ΔN bound to the PRC1 constructs in Fig. 6A, and plotted against varying PRC1 concentration (n = 3, mean ± SD). The data were fit to a hyperbola to estimate the dissociation constant (KD). PRCΔN1SΔC: KD = 0.21 ± 0.01 μM; PRC1ΔN2SΔC: KD = 1.6 ± 0.11 μM; PRC1NSΔC5: KD = 0.3 ± 0.06 μM; PRC1NSΔC4: KD = 0.3 ± 0.04 μM; PRC1NSΔC3: KD = 1.2 ± 0.4 μM; PRC1NSΔC2: KD = 2.3 ± 0.6 μM. (E) Ribbon diagram of the structure of the PRC1NSΔC dimer with the dimerization domain (blue) and the portion of the rod-domain (orange) involved in kinesin4ΔN binding highlighted. Estimated KD’s for constructs that terminate at different positions (black line) along PRC1’s rod domain are indicated. (F) Schematic of the constructs generated to examine the effect of PRC1’s microtubule binding on plus-end tagging (blue: dimerization domain; orange: rod domain; red: spectrin domain; black: unstructured domain). (G–R) Representative images of a microtubule (G, J, M, P), associated (H) GFP-PRC1 (0.5 nM), (K) GFP-PRC1NSΔC (0.5 nM), (N) GFP-PRC1NSΔC4 (0.5 nM) and (Q) GFP-PRC1NSΔC4 (3 nM), and overlay of the two images (red: microtubules; green: PRC1) (I, L, O, R). Assay includes kinesin-4 (1.5 nM, 1 mM MgATP). (S) Plot of end-tag intensity as a function of microtubule length in this assay: GFP-PRC1 (0.5 nM; black; slope = 1864 ±104 a.u./μm, N =100), GFP-PRC1NSΔC (0.5 nM; red; slope = 1051±93 a.u./μm, N =144), GFP-PRC1NSΔC4 (0.5 nM; blue; slope = 154±16 a.u./μm, N =148) or GFP-PRC1NSΔC4 (3.0 nM; green; slope = 465±11 a.u./μm, N =114). (T) Plot of end-tag length as a function of microtubule length in this assay: GFP-PRC1 (0.5 nM; black; slope = 0.36 ±0.004, N =100), GFP-PRC1NSΔC (0.5 nM; red; slope = 0.21±0.008 a.u./μm, N =144), GFP-PRC1NSΔC4 (0.5 nM; blue; slope = 0.06±0.005, N =148) or GFP-PRC1NSΔC4 (3.0 nM; green; slope = 0.06±0.006 a.u./μm, N =114). Scale bar = 2.5μm. Errors are standard deviations. See also Figure S6.
Figure 7
Figure 7. Microtubule end-tagging in dividing cells during anaphase
(A–C) Analysis of PRC1 localization in monopolar anaphase cells by immunofluorescence. Maximum intensity projections of DNA (blue), tubulin (green), PRC1 (red) and an overlay of the three images are shown. Insets: 2-fold enlargement of the outlined regions (white dashed rectangle) in the overlay image. Maximum intensity projections were generated from optical sections spanning the microtubule in the region. (D) Plot of end-tag length as a function of microtubule length in monopolar cells undergoing anaphase (n = 48; slope = 0.4±0.02). (E–G) Analysis of PRC1 localization in bipolar anaphase cells by immunofluorescence. Maximum intensity projections of DNA (blue), tubulin (green), PRC1 (red) and an overlay of the three images are shown. Insets: 3-fold enlargement of the outlined regions (white dashed rectangle) in the overlay image. Maximum intensity projections were generated from optical sections spanning the microtubule in the region. (H–I) Analysis of anaphase cells expressing GFP-PRC1 by live imaging (Left: DIC, Right: fluorescence). Insets: 2-fold enlargement of the outlined regions (white dashed rectangle) in the fluorescence image. Maximum intensity projections were generated from optical sections spanning the fluorescence signal in the region. (J) Plot of end-tag length as a function of microtubule length in bipolar cells undergoing anaphase (n = 17; slope = 0.35±0.06). (K–L) A model for the formation of filament length dependent microtubule end-tags by PRC1 and kinesin-4. PRC1 (purple) is transported to the filament plus-end by kinesin-4 (blue) along a microtubule (α and β-tubulin are colored red and white respectively; only one protofilament is shown for clarity). PRC1-kinesin-4 molecules persist at the filament end forming an ‘end-tag’. Additional molecules are transported to filament end and ‘line-up’ behind the previously occupied tubulin sites [i–iii]. Eventually a steady-state is reached when the number of PRC1-kinesin-4 molecules transported to microtubule ends equals the number of molecules lost due to unbinding [iv–vi] (K). Smaller end-tags form on shorter microtubules due to fewer PRC1-kinesin-4 binding sites on the lattice (L). Scale bar = 2.5 μm. See also Figure S7.

Comment in

References

    1. Bieling P, Telley IA, Surrey T. A minimal midzone protein module controls formation and length of antiparallel microtubule overlaps. Cell. 2010;142:420–432. - PubMed
    1. Canman JC, Hoffman DB, Salmon ED. The role of pre- and post-anaphase microtubules in the cytokinesis phase of the cell cycle. Curr Biol. 2000;10:611–614. - PubMed
    1. Djinovic-Carugo K, Gautel M, Ylanne J, Young P. The spectrin repeat: a structural platform for cytoskeletal protein assemblies. FEBS Lett. 2002;513:119–123. - PubMed
    1. Djinovic-Carugo K, Young P, Gautel M, Saraste M. Structure of the alpha-actinin rod: molecular basis for cross-linking of actin filaments. Cell. 1999;98:537–546. - PubMed
    1. Duellberg C, Fourniol FJ, Maurer SP, Roostalu J, Surrey T. End-binding proteins and Ase1/PRC1 define local functionality of structurally distinct parts of the microtubule cytoskeleton. Trends Cell Biol 2012 - PubMed

Publication types