. 2013 Jul 18;154(2):391-402.
doi: 10.1016/j.cell.2013.06.010.

Cortical dynein and asymmetric membrane elongation coordinately position the spindle in anaphase

Affiliations

Cortical dynein and asymmetric membrane elongation coordinately position the spindle in anaphase

Tomomi Kiyomitsu et al. Cell. .

Erratum in

  • Cell. 2013 Sep 12;154(6):1401

Abstract

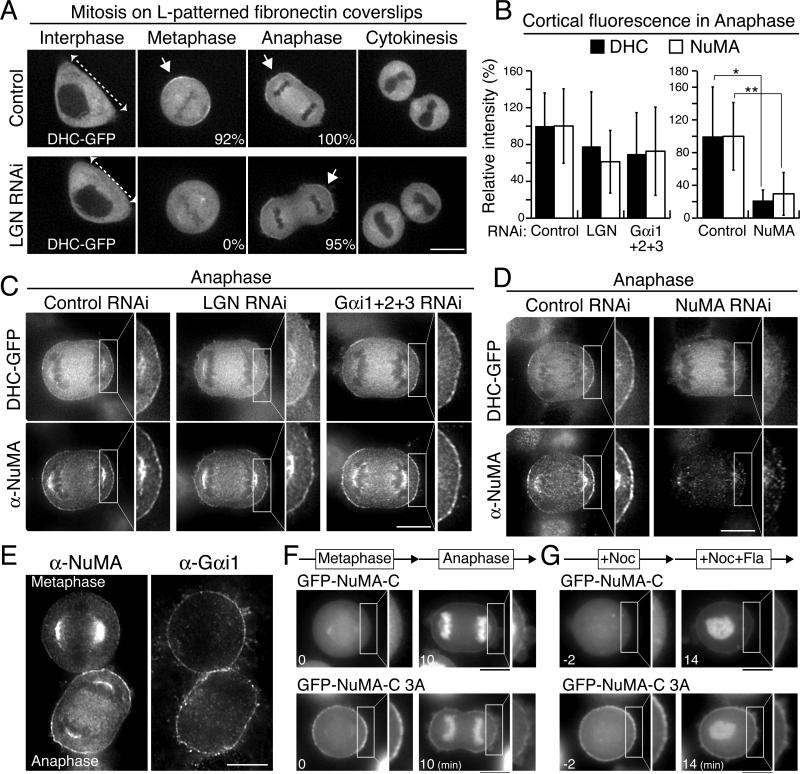
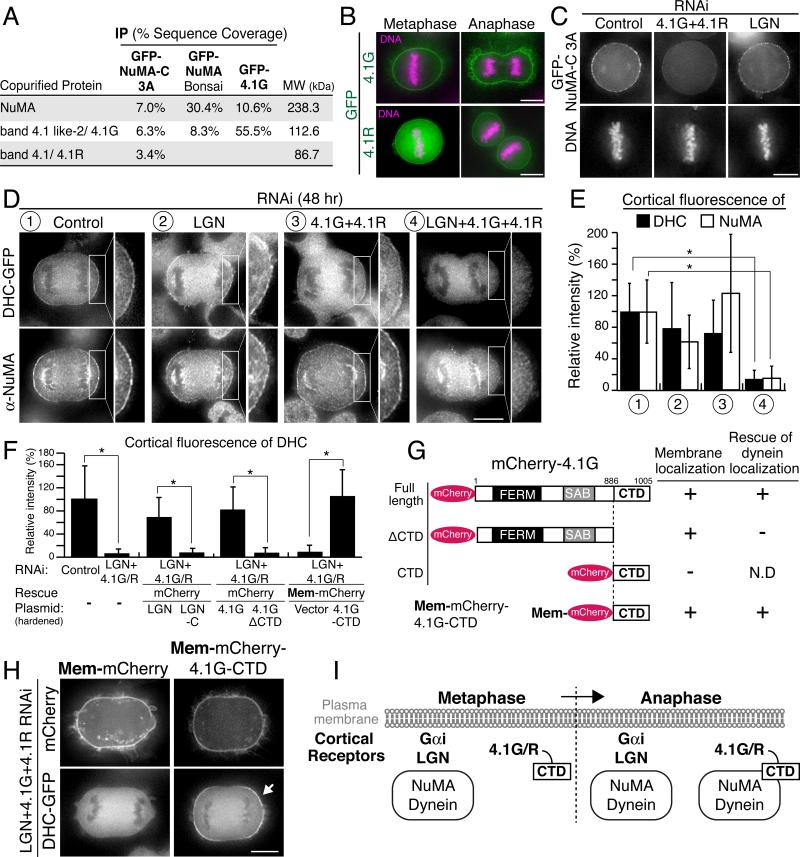
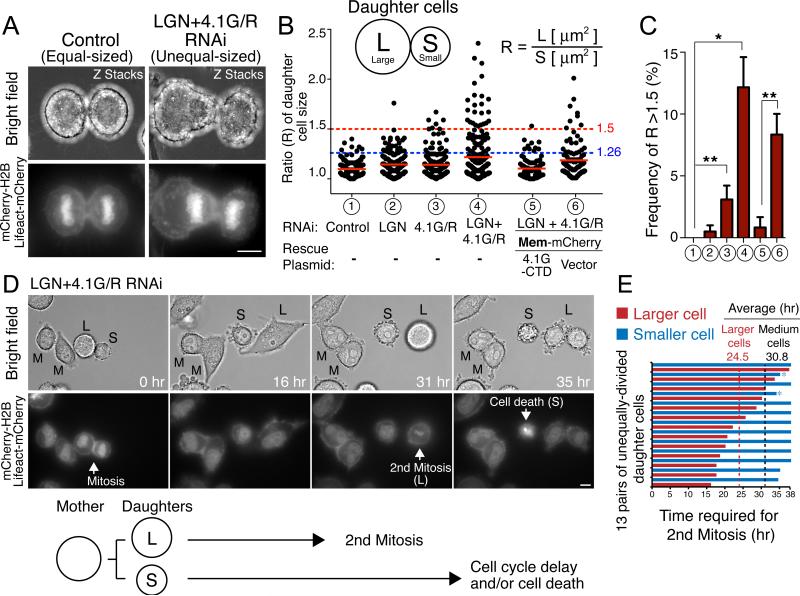
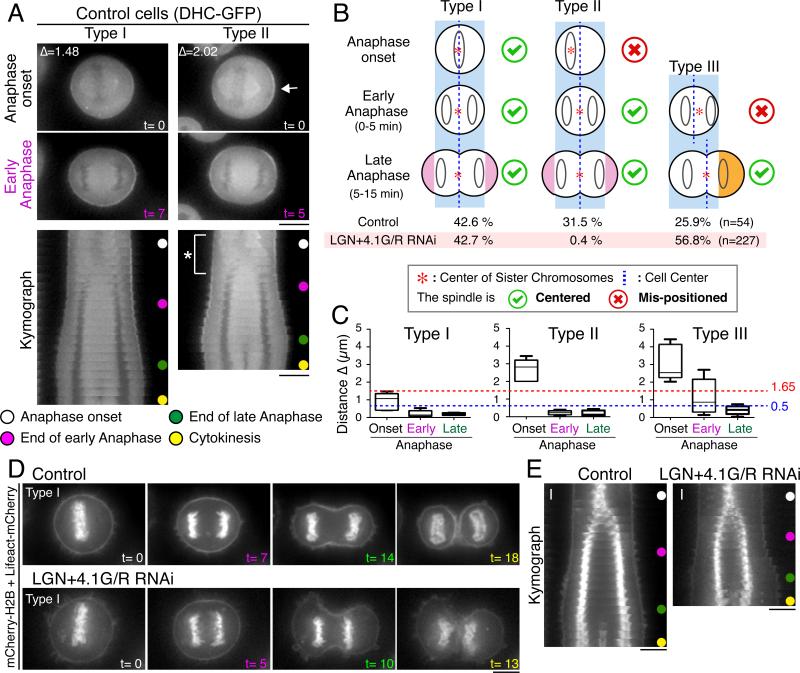
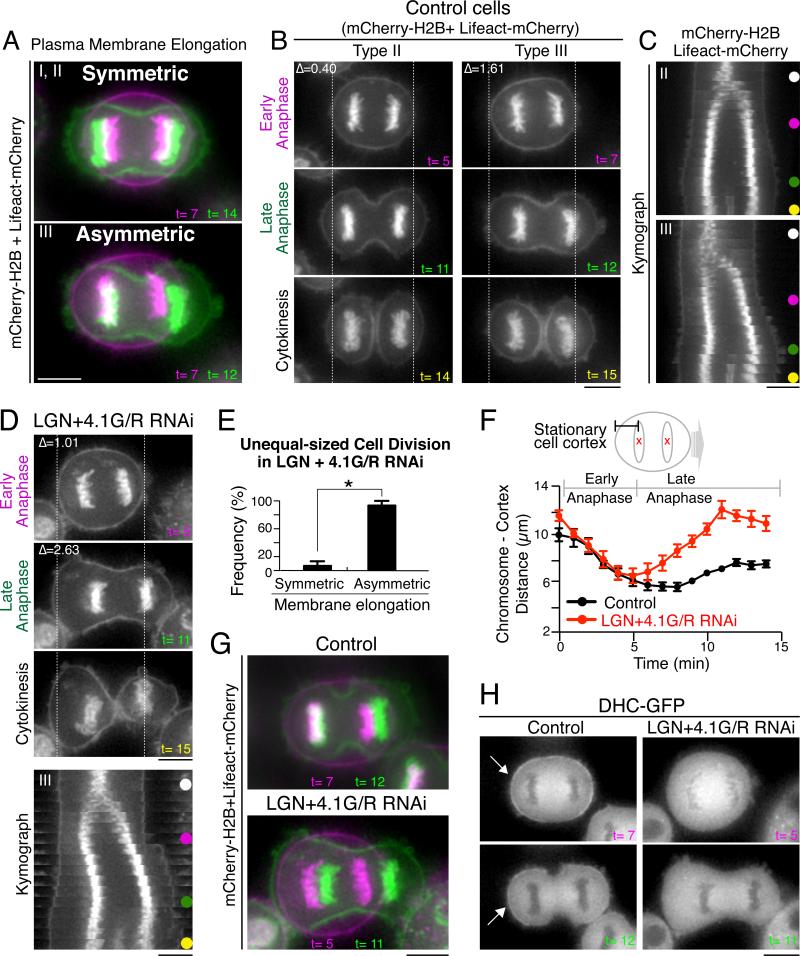
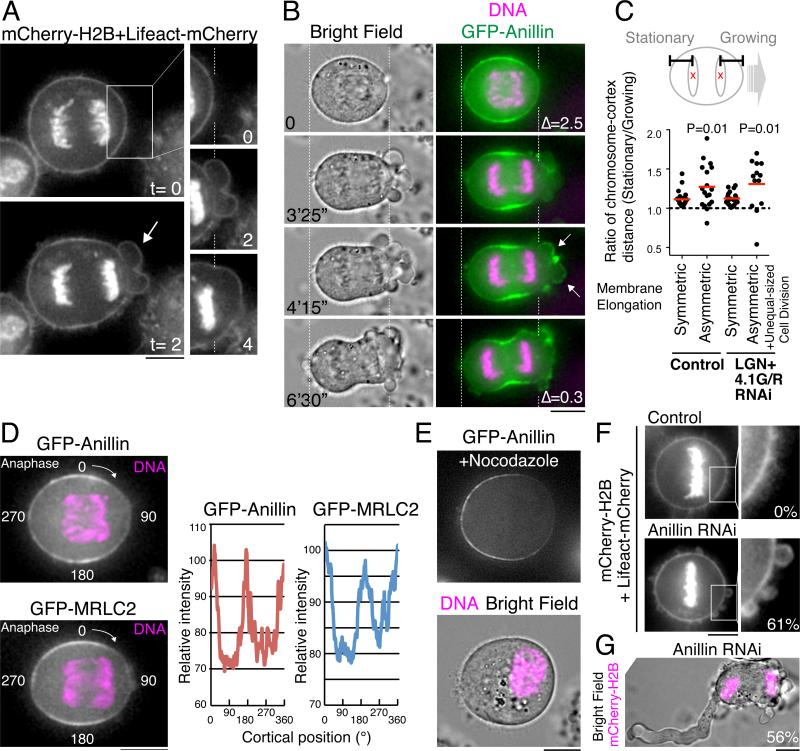
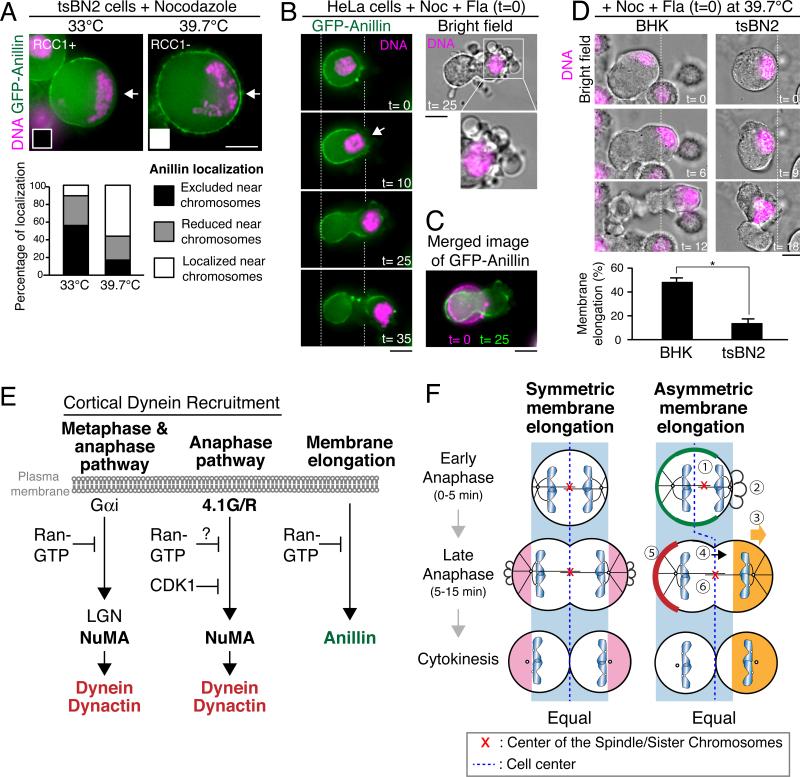
Mitotic spindle position defines the cell-cleavage site during cytokinesis. However, the mechanisms that control spindle positioning to generate equal-sized daughter cells remain poorly understood. Here, we demonstrate that two mechanisms act coordinately to center the spindle during anaphase in symmetrically dividing human cells. First, the spindle is positioned directly by the microtubule-based motor dynein, which we demonstrate is targeted to the cell cortex by two distinct pathways: a Gαi/LGN/NuMA-dependent pathway and a 4.1G/R and NuMA-dependent, anaphase-specific pathway. Second, we find that asymmetric plasma membrane elongation occurs in response to spindle mispositioning to alter the cellular boundaries relative to the spindle. Asymmetric membrane elongation is promoted by chromosome-derived Ran-GTP signals that locally reduce Anillin at the growing cell cortex. In asymmetrically elongating cells, dynein-dependent spindle anchoring at the stationary cell cortex ensures proper spindle positioning. Our results reveal the anaphase-specific spindle centering systems that achieve equal-sized cell division.


Figures

Figure 1
Figure 1. Dynein and NuMA are recruited to the cell cortex independently of Gαi and LGN during anaphase
(A) Fluorescent images of DHC-GFP from time-lapse movies of HeLa cells cultured on L-patterned fibronectin-coated coverslips. Control cells (top), but not LGN depleted cells (bottom), divide along the hypotenuse of the L (dashed arrows). Percentages indicate the frequency of cortical dynein localization (indicated by arrows) in controls (n=25 cells) and LGN depleted cells (n=21 cells) (B) Quantification of DHC-GFP and NuMA cortical fluorescence intensity in the indicated conditions (mean ± SD; n = 12-27 line scans from 4-9 cells). * indicates a statistically significant difference based on a student's T test (*p = 0.001, **p < 0.0001) (C, D) Immunofluorescence images of DHC-GFP and NuMA in control HeLa cells and the indicated depletions. (E) Immunofluorescence images of NuMA and Gαi-1 in metaphase (top) and anaphase cells (bottom). (F) Fluorescent images of GFP-NuMA-C (top) and a GFP-NuMA-C 3A mutant (bottom) from time-lapse movies. (G) Time-lapse images of nocodazole (Noc) arrested cells expressing GFP-NuMA-C (top) or a GFP-NuMA-C 3A mutant (bottom). Nocodazole and Flavopiridol (Fla) were added at t=0 min. Scale bars, 10 μm. See also Figure S1.
Figure 2
Figure 2. 4.1G and 4.1R are anaphase-specific cortical receptors for NuMA and dynein
(A) Data from the mass spectrometric analysis of the indicated affinity purifications listing the percentage sequence coverage. (B) Fluorescent images of HeLa cells expressing GFP-4.1G (isoform a, NP_001422) or GFP-4.1R (IMAGE clone 40001729). (C) Fluorescent images of GFP-NuMA-C 3A and DNA in control cells and the indicated RNAi-based depletions. (D) Immunofluorescence images of DHC-GFP and NuMA in control cells and the indicated depletions. (E) Quantification of DHC-GFP and NuMA cortical fluorescence intensity in the indicated conditions (mean ± SD; n = 12-36 line scans from 4-12 cells, * p < 0.0001) (F) Quantification of DHC-GFP cortical fluorescence intensity from the indicated conditions (mean ± SD; n = 27-30 line scans from 9-10 cells, * p < 0.0001) (G) Diagram showing full length 4.1G and the tested truncation fragments. The previously defined FERM, SAB and CTD domains (Diakowski et al., 2006) are indicated. Right, summary of membrane localization and rescue of cortical dynein localization by the indicated 4.1 fragments. (H) Fluorescence images showing rescue of DHC-GFP localization by membrane targeted 4.1G-CTD (arrow) in LGN and 4.1 co-depleted cells. (I) Diagram showing the cortical dynein receptors during metaphase and anaphase. Scale bars, 10 μm. See also Figure S2.
Figure 3
Figure 3. LGN and 4.1G/R co-depletion results in unequal-sized daughter cells
(A) Collapsed Z-stack images of bright field (top) and mCherry-H2B and Lifeact-mCherry (bottom) in control HeLa cells (left) and LGN+4.1G/R co-depleted cells (right). (B) Scatter plots of the relative area ratio (R) of daughter cells in the indicated depletions and rescue conditions. Red lines indicate means. (C) Quantification of the data from (B) showing the frequency of cells with R>1.5 in the indicated depletions ± SD. * indicates statistical difference from the control with either 99.9% (*) or 95%(**) confidence interval based on a z-test. (D) Top, time-lapse images of bright field (top) and mCherry-H2B and Lifeact-mCherry (bottom) in synchronized LGN and 4.1G/R co-depleted cells. L, M, and S indicate larger, medium and smaller cells, respectively. Bottom, diagram showing the phenotypes for larger and smaller daughter cells. (E) Graph showing the cell cycle duration required for the 2nd mitotic entry in larger (red) and smaller (blue) daughter cells. * indicates smaller cells showing apoptotic-like cell death. Dashed lines indicate the average duration in larger cells (red, n=13) and medium-sized cells (black, n=26). Scale bars, 10 μm. See also Figure S3.
Figure 4
Figure 4. Dynein-dependent spindle movement drives spindle centering during early anaphase
(A) Top, time-lapse images showing DHC-GFP in a Type I (left) and Type II (right) cell. Bottom, kymographs showing the movements of dynein at 1 min intervals. Arrow indicates cortical dynein. * indicates spindle movement during early anaphase. (B) Diagram summarizing the 3 types of cell behavior for their anaphase spindle centering processes. Cells were classified based on the position of chromosomes at anaphase onset and the type of membrane elongation. The frequency of each class in control and LGN and 4.1G/R co-depleted cells is indicated. (C) Box plots of Δ (the distance between the cell center and the center of the sister chromatids) in control cells at anaphase onset, and the end of early and late anaphase. The red and blue dashed lines indicate Δ of 1.65, and 0.5, respectively (see Fig. S4A for details). n≥5 cells for each condition. (D) Time-lapse images of equally dividing Type I cells in control (top; Movie S1) and LGN and 4.1G/R co-depleted cells (bottom; Movie S2). (E) Kymographs generated from the image sequences in (D) showing chromosome movements and the cell cortex at 1 min intervals. Scale bars, 10 μm. See also Figure S4.
Figure 5
Figure 5. Asymmetric plasma membrane elongation and cortical dynein coordinately center the spindle during late anaphase
(A) Merged fluorescent images of symmetrically or asymmetrically elongating cells at the end of early anaphase (magenta) and late anaphase (green) (B) Time-lapse images in Type II and Type III cells (Movie S4, S5). Dashed lines indicate cellular boundaries at early anaphase. (C) Kymographs resulting from image sequences in (B) showing the movements of the chromosomes and the cell cortex at 1 min intervals. (D) Time-lapse images (top) and corresponding kymographs (bottom; 1 min intervals) showing mCherry-H2B and Lifeact-mCherry in unequally dividing Type III cells co-depleted for LGN and 4.1G/R (Movie S6). Dashed lines indicate cellular boundaries at early anaphase. (E) Quantification of membrane elongation in unequally dividing (R>1.5) cells caused by LGN and 4.1G/R co-depletion (n=16). (F) Graph showing sister chromatid distance from the stationary cell cortex for control (black, n=5) and unequally dividing LGN and 4.1G/R co-depleted cells (red, n=5). All sequences were time-aligned with respect to anaphase onset (t=0). Error bars represent the S.E.M. (G) Merged images of cells at the end of early anaphase (magenta) and anaphase B (green) in asymmetrically elongating control (top) and LGN and 4.1G/R co-depleted cells (bottom). (H) Images showing DHC-GFP in asymmetrically elongating control (left) and LGN and 4.1G/R co-depleted cells corresponding to (G). Arrows indicate dynein localization to the stationary cell cortex. Scale bars, 10 μm. See also Figure S5.
Figure 6
Figure 6. Membrane blebbing drives asymmetric membrane elongation
(A) Time-lapse images showing asymmetric membrane blebbing in LGN and 4.1 co-depleted cells. An arrow indicates membrane blebs. (B) Time-lapse images of bright field (left), DNA (magenta), and GFP-Anillin (green) in a control cell. Arrows indicate Anillin localization on retracting membrane blebs (Movie S4). (C) Scatter plots of the relative ratio of the distance between chromosomes and the stationary or growing cell cortex in symmetrically and asymmetrically elongating control cells (n= 23 and 18, respectively) and LGN and 4.1 co-depleted cells (n= 20 and 13, respectively). Red lines indicate means. P-values indicate statistical significance based on a Student's t-test. (D) Images of an anaphase cell just prior to asymmetric membrane elongation showing DNA (magenta) and GFP-Anillin (top) or GFP-MRLC2 (bottom). Right, line scan showing the relative fluorescence intensity of cortical GFP-Anillin and GFP-MRLC2 around the cell cortex. (E) Images of a Nocodazole-arrested cell showing GFP-Anillin (top), and bright field and DNA (magenta) (bottom). (F) Images of mCherry-H2B and Lifeact-mCherry showing membrane blebbing at metaphase in control (top, n=20) and Anillin depleted (bottom, n=20) cells. Percentages indicate the frequency of blebbing cells in each condition. (G) Images showing formation of large membrane blebs in Anillin depleted anaphase cells (56%, n=16). Scale bars, 10 μm. See also Figure S6.
Figure 7
Figure 7. The chromosome-derived Ran-GTP signals locally reduce cortical Anillin to drive membrane elongation
(A) Top, fluorescence images of tsBN2 (RCC1ts) cells stably expressing GFP-Anillin. Cells were arrested with nocodazole and then either maintained at the permissive temperature (33°C; n=51) or shifted to the restrictive temperature (39.7°C; n=56). Cells with their chromosomes mass near the cell cortex were observed (arrows). Bottom, histogram showing the quantification of the localization data. (B) Time-lapse images of GFP-Anillin (green), DNA (magenta) and bright field in Nodocazole and Flavopiridol treated cells (Movie S8). Cortical GFP-Anillin is locally reduced in the vicinity of the chromosomes (arrow). (C) Merged images from (B) at t=0 (magenta) and t=25 min (green). (D) Top, time-lapse images of Nocodazole- and Flavopiridol-treated BHK (left) and tsBN2 cells at 39.7°C. Dashed lines indicate boundary of cells at t=0. Bottom, graphs showing the frequency of the cells with membrane elongation near the chromosome mass. * indicates statistical difference with 99.9% confidence interval based on a z-test. (E) Diagram showing pathways for cortical dynein recruitment and membrane elongation. (F) Model showing anaphase spindle centering mechanisms. Left, when spindle centering occurs during early anaphase using dynein-dependent forces, cells symmetrically elongate the polar membrane. Right, when the spindle is mis-positioned at the end of early anaphase, the proximity of the chromosomes to the cell cortex [1] induces asymmetric anillin localization (green) [2] to expand the cellular boundary [3]. Although cortical expansion centers the spindle, it also causes cytosolic flow [4] toward the growing cell cortex. Dynein (red) localizes to the stationary cell cortex to anchor the spindle [5] and prevent displacement. These coordinated actions lead to spindle elongation [6] and spindle centering during late anaphase. See also Figure S7.

Comment in

Similar articles

Cited by

References

    1. Bennett V, Baines AJ. Spectrin and ankyrin-based pathways: metazoan inventions for integrating cells into tissues. Physiological reviews. 2001;81:1353–1392. - PubMed
    1. Burgess DR, Chang F. Site selection for the cleavage furrow at cytokinesis. Trends Cell Biol. 2005;15:156–162. - PubMed
    1. Charras G, Paluch E. Blebs lead the way: how to migrate without lamellipodia. Nat Rev Mol Cell Biol. 2008;9:730–736. - PubMed
    1. Charras GT, Hu CK, Coughlin M, Mitchison TJ. Reassembly of contractile actin cortex in cell blebs. J Cell Biol. 2006;175:477–490. - PMC - PubMed
    1. Collins ES, Balchand SK, Faraci JL, Wadsworth P, Lee WL. Cell cycle-regulated cortical dynein/dynactin promotes symmetric cell division by differential pole motion in anaphase. Mol Biol Cell. 2012;23:3380–3390. - PMC - PubMed

Publication types

MeSH terms