. 2013 Jul 18;154(2):430-41.
doi: 10.1016/j.cell.2013.06.016.

The NAD(+)/Sirtuin Pathway Modulates Longevity through Activation of Mitochondrial UPR and FOXO Signaling

Affiliations

The NAD(+)/Sirtuin Pathway Modulates Longevity through Activation of Mitochondrial UPR and FOXO Signaling

Laurent Mouchiroud et al. Cell. .

Abstract

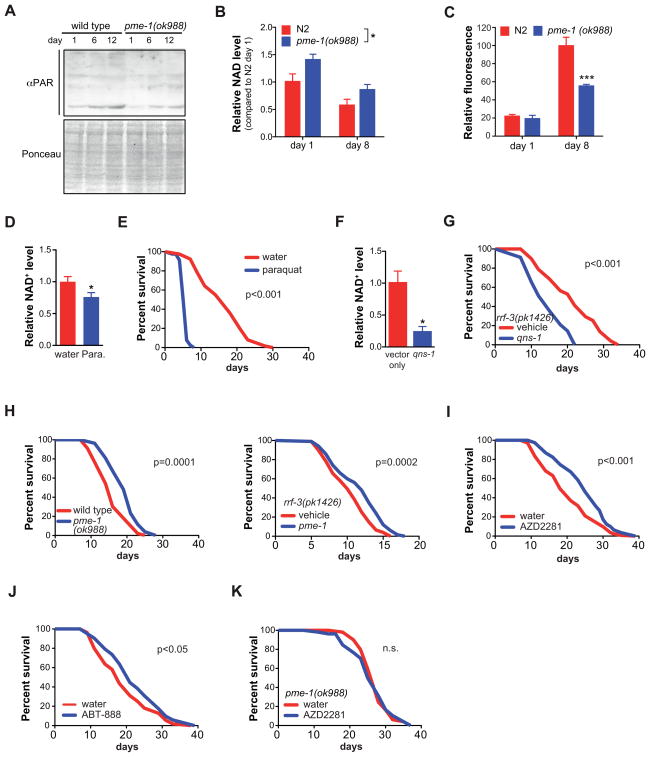
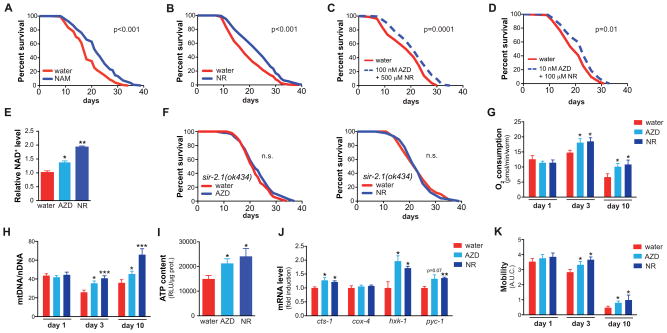
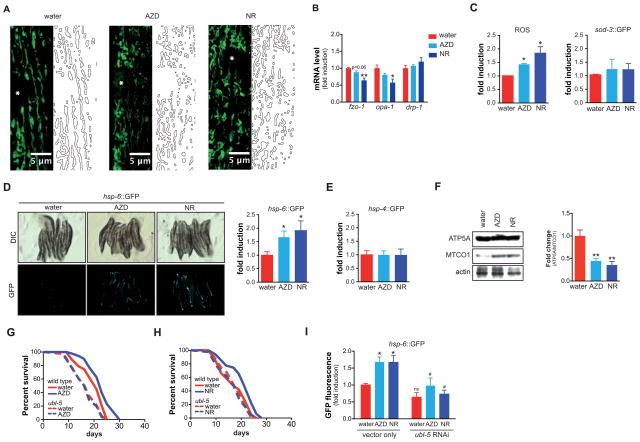
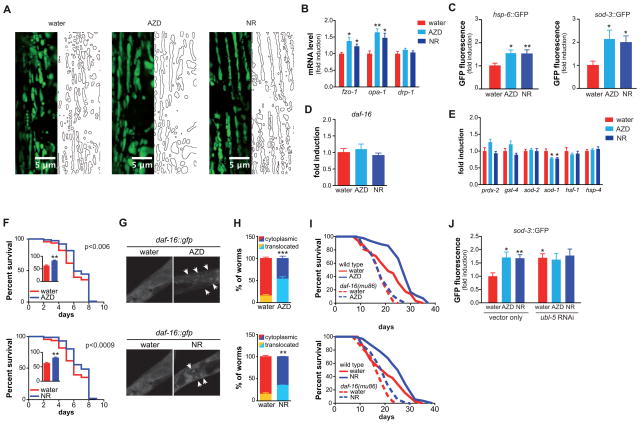
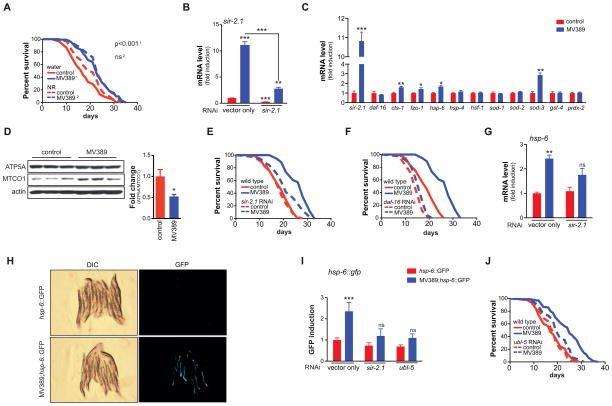
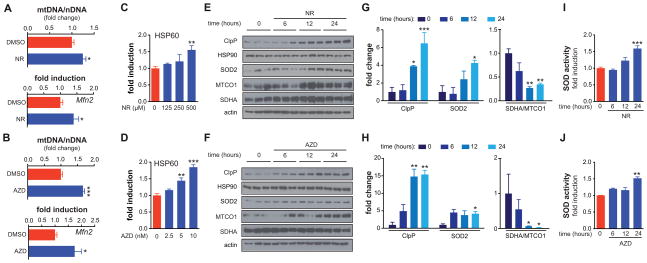
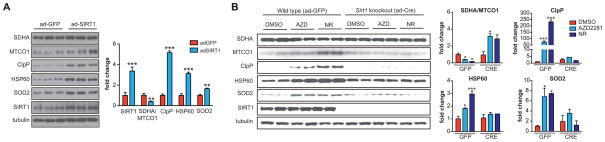
NAD(+) is an important cofactor regulating metabolic homeostasis and a rate-limiting substrate for sirtuin deacylases. We show that NAD(+) levels are reduced in aged mice and Caenorhabditis elegans and that decreasing NAD(+) levels results in a further reduction in worm lifespan. Conversely, genetic or pharmacological restoration of NAD(+) prevents age-associated metabolic decline and promotes longevity in worms. These effects are dependent upon the protein deacetylase sir-2.1 and involve the induction of mitonuclear protein imbalance as well as activation of stress signaling via the mitochondrial unfolded protein response (UPR(mt)) and the nuclear translocation and activation of FOXO transcription factor DAF-16. Our data suggest that augmenting mitochondrial stress signaling through the modulation of NAD(+) levels may be a target to improve mitochondrial function and prevent or treat age-associated decline.


Figures

Figure 1
Figure 1. NAD+ is causally involved in aging
(A) Aged C. elegans displayed higher total protein PARylation levels, which were largely attenuated in pme-1 mutants. Ponceau staining is used as a loading control. (B) Aging decreased worm NAD+ levels, in both wildtype and in pme-1 mutant worms, with a higher level of NAD+ in the pme-1 mutant during aging. Two-way ANOVA indicated significant difference with age (p<0.008) and genotype (p=0.02). (C) pme-1 mutant worms accumulated less of the aging pigment lipofuscin compared to wild type worms. (D–E) Supplementation of N2 wild type worms with 4 mM paraquat depletes NAD+ levels (D) and shortens lifespan (E). (F–G) RNAi against qns-1, encoding NAD+ synthase, depletes NAD+ levels (F) and shortens lifespan in worms (G) (H) pme-1(ok988) mutant worms show a 29% mean lifespan extension (left panel) while pme-1 RNAi in the rrf-3(pk1426) strain extends lifespan by 20% (right panel). (I–J) PARP inhibition by either AZD2281 (100 nM) or ABT-888 (100 nM) extended worm lifespan respectively by 22.9% (I) and 15% (J). (K) The lifespan extension of AZD2281 is pme-1-dependent. Bar graphs are expressed as mean±SEM, * p≤0.05; ** p≤0.01; *** p≤0.001. For lifespan curves, p-values are shown in the graph (n.s. = not significant). See also Figure S1 and S2A–B. See Table S1 and S2 for additional detail on the lifespan experiments.
Figure 2
Figure 2. PARP inhibitors and NAD+ precursors increase mitochondrial function
(A–B) Supplementation of the NAD+ precursor NR (500 μM; A) or NAM (200 μM; B) in wild type N2 worms increases lifespan. (C) Combined treatment using optimal concentrations of AZD2281 (100 nM) and NR (500 μM) extends lifespan (+16%/p=0.02), but not further than the individual compounds (+22%/p=0.0004 and +16%/p=0.01, respectively). Mean lifespans: vehicle: 16.1±0.6 days; 100 nM AZD2281: 19.7±0.8 days; 500 μM NR: 18.7±0.8 days; 100 nM AZD2281+500 μM NR: 18.6±0.7 days. (D) A combination of sub-optimal doses of AZD2281 (10 nM) and NR (100 μM) extended lifespan (11%/p=0.01), while the individual compounds at these concentrations had no effect on lifespan (+7%/ns and +5%/ns, respectively). Mean lifespans: vehicle: 20.1±0.6 days; 10 nM AZD2281: 21.5±0.7 days; 100 μM NR: 21.1±0.7 days; 10 nM AZD2281+100 μM NR: 22.3±0.7 days. (E) AZD2281 and NR supplementation increased NAD+ levels in C. elegans. (F) PARP inhibition by AZD2281 (100 nM) and NR supplementation (500 μM) do not extend lifespan in the sir-2.1(ok434) mutant (n.s = not significant). (G) Oxygen consumption was increased in day 3 and day 10 adult worms after AZD2281 (AZD; 100 nM) or NR (500 μM) treatment. (H) AZD2281 and NR increased mitochondrial biogenesis at day 3 and day 10 of adulthood, as evidenced by the increased mtDNA/nDNA ratio. (I) AZD2281 and NR increased worm ATP levels at day 3 of adulthood. (J) AZD2281 and NR increased gene expression (day 3 adults) of key metabolic genes cts-1 (TCA cycle), hxk-1 (glycolysis) and pyc-1 (gluconeogenesis), but not that of cox-4. (K) AZD2281 and NR improved worm fitness at day 3 and 10 of adulthood, as evidenced by measuring worm motility. Bar graphs are expressed as mean±SEM, * p≤0.05; ** p≤0.01. See also Figure S2C–D and S3. See Table S1 and S2 for additional detail on the lifespan experiments.
Figure 3
Figure 3. Early phase response of NAD+ boosters on mitochondrial aging pathways
(A) The effects of AZD2281 (100 nM) and NR (500 μM) on mitochondrial content and morphology in body wall muscle. At day 1 of adulthood, mitochondria of AZD2281- or NR-treated worms appear more fragmented. Stars represent nuclei, insets show higher magnification of a small section of the image, marked by dashed rectangle. (B) At day 1 of adulthood, AZD2281 and NR reduced the expression of mitochondrial fusion genes fzo-1 and opa-1, without affecting the fission gene drp-1. (C) At day 1, AZD2281 and NR cause a burst of ROS, as measured using the MitoSOX probe. This was not accompanied by an induction of the antioxidant gene sod-3 (measured using a GFP-coupled sod-3 reporter). (D–E) At day 1, AZD2281 and NR induced the mitochondrial unfolded protein response (UPRmt) (hsp-6 reporter; D), without activating the ER unfolded protein response (hsp-4 reporter; E). In panel D, representative images are shown on the left, while quantification is shown in the bar graph on the right. (F) AZD2281 and NR induced mitonuclear protein imbalance, as evidenced by the decreased ratio between nDNA-encoded ATP5A and mtDNA-encoded MTCO1. Representative Western blot shown on the left, quantification of the ratio in three independent experiments is shown on the right. (G–H) RNAi of the UPRmt regulator ubl-5 abrogated the lifespan extension induced by AZD2281 (G; at 100 nM) and NR (H; at 500 μM). (I) The UPRmt induction by AZD2281 and NR at day 1 is also ubl-5 dependent. Bar graphs are expressed as mean±SEM, * p≤0.05; ** p≤0.01. See also Figure S4. See Table S1 for additional detail on the lifespan experiments.
Figure 4
Figure 4. Late phase effects of NAD+ boosters on mitochondrial aging pathways
(A) The effects of AZD2281 (100 nM) and NR (500 μM) on mitochondrial content and morphology in body wall muscle. At day 3 of adulthood, mitochondria of AZD2281- or NR-treated worms appear more fused. Stars represent nuclei, insets show higher magnification of a small section of the image, marked by dashed rectangle. (B) At day 3 of adulthood, AZD2281 and NR increased the expression of mitochondrial fusion genes fzo-1 and opa-1, without affecting the fission gene drp-1. (C) At day 3 of AZD2281 (100 nM) or NR (500 μM) treatment, UPRmt is still activated (left panel), but now accompanied by an induction of the sod-3::GFP reporter (right panel). (D–E) AZD2281- and NR-treated worms showed no change in daf-16 expression (D) or activation of expression of other stress genes (E). (F) Supplementation of PARP inhibitor AZD2281 (100 nM) or NAD+ precursor NR (500 μM) increases mean lifespan of wild type N2 worms treated with 4 mM paraquat. p-values are shown in the graph. (G) Representative images of daf-16::GFP reporter worms treated with either vehicle or AZD2281 (top)/NR (bottom), showing nuclear accumulation of daf-16 following treatment, indicated by arrowheads. (H) Quantification of daf-16 nuclear translocation following treatment with AZD2281 (top), NR (bottom). Localization is shown as percentage of worms that shows nuclear (yellow or light blue) or cytosolic (red or dark blue) localization (I) Lifespan extension following AZD2281 or NR treatment is dependent on daf-16. (J) The induction of sod-3::GFP reporter following AZD2281 or NR treatment is dependent on the UPRmt regulator ubl-5. Bar graphs are expressed as mean±SEM, * p≤0.05; ** p≤0.01; *** p≤0.001. See also Figure S4–5. See Table S1 for additional detail on the lifespan experiments.
Figure 5
Figure 5. sir-2.1 overexpression extends lifespan through UPRmt
(A) Outcrossed sir-2.1 transgenic worms live significantly longer compared to control worms. MV389 represents the outcrossed sir-2.1 overexpressing strain. p-value is shown in the graph. (B) sir-2.1 is robustly overexpressed in sir-2.1 transgenic worms. This induction is almost completely blocked by sir-2.1 RNAi demonstrating specificity. (C) sir-2.1 overexpression induced the gene expression of cts-1 (TCA cycle), fzo-1 (mitochondrial fusion), hsp-6 (UPRmt) and sod-3 (ROS defense), but not of other stress genes or of the ROS defense regulator daf-16. (D) sir-2.1 overexpression in MV389 induced mitonuclear protein imbalance, as evidenced by the reduction in the ratio between nDNA-encoded ATP5A and mtDNA-encoded MTCO1. The Western blot depicts three independent samples for each strain, while the right panel shows a quantification of the mitonuclear protein imbalance. (E–F) (E) sir-2.1, and (F) daf-16 RNAi abrogated the lifespan extension of MV389 (G) sir-2.1 overexpression in the MV389 strain induces the UPRmt gene hsp-6, an effect that is attenuated upon sir-2.1 RNAi. (H–I) In MV389 worms that were crossed with the UPRmt (hsp-6::GFP) reporter worms, UPRmt was markedly increased compared to hsp-6::GFP control worms. Panel H shows GFP expression in sir-2.1 wild type (top) and sir-2.1 overexpressing (bottom) worms. Panel I shows the quantification of this GFP signal and that this induction was attenuated upon ubl-5 or sir-2.1 RNAi. (J) ubl-5 RNAi abrogated the lifespan extension of MV389. Bar graphs are expressed as mean±SEM, * p≤0.05; ** p≤0.01; *** p≤0.001. See Table S1 for additional detail on the lifespan experiments.
Figure 6
Figure 6. NAD+ boosters activate UPRmt in mammalian cells
(A–B) Treatment with NR (A; 1 mM) or AZD2281 (B; 1 μM) increases the ratio between mitochondrial DNA (mtDNA) and nuclear DNA (nDNA), a common marker for mitochondrial abundance in the AML12 hepatocyte cell line (upper panels). This increase reflects induced mitochondrial biogenesis. At the same time, NR and AZD2281 induce the expression of the mitochondrial fusion gene Mfn2 (lower panels). (C–D) AZD2281 and NR dose-dependently activate the transcription of a human Hsp60 promoter luciferase reporter, transfected into AML12 cells (E–H) The NAD+ precursor NR (E, G; 1 mM) and the PARP inhibitor AZD2281 (F, H; 1 μM) induce UPRmt, as evidenced by CLPP expression, in a time-dependent fashion in AML12 cells. The mitochondrial antioxidant SOD2 also increased over time. HSP90 is a cytosolic stress marker that is not affected by treatment with AZD2281 or NR. NR and AZD2281 also induced marked mitonuclear protein imbalance, as evidenced by the ratio SDHA/MTCO1 (nDNA- and mtDNA-encoded, respectively). Actin served as a loading control. Panels G and H represent quantifications of the Western blots in E and F. (I–J) At the later stages following NR (I) or AZD2281 (J) treatment, SOD activity was increased. The fact that activity trails behind protein expression may be due to post-translational modifications regulating SOD2 activity. Bar graphs are expressed as mean±SEM, * p≤0.05; ** p≤0.01; *** p≤0.001.
Figure 7
Figure 7. Activation of UPRmt is Sirt1-dependent in mammals
(A) Primary hepatocytes infected with Ad-mSirt1, to overexpress Sirt1, display marked mitonuclear protein imbalance (ratio MTCO1/SDHA), UPRmt activation (CLPP and HSP60) and antioxidant induction (SOD2), compared to hepatocytes from the same isolation infected with Ad-GFP, which served as controls. Sirt1 overexpression was confirmed; tubulin is used as a loading control. (B) Primary hepatocytes of Sirt1 floxed mice were infected with adenoviral-assisted GFP (“wild type” negative control) or Cre recombinase (Sirt1 knockout). Treatment of GFP controls with NR or AZD2281 induced mitonuclear protein imbalance, and UPRmt, while these effects were attenuated when Sirt1 was knocked out. SIRT1 blots show knockout efficiency; tubulin was probed as a loading control. Bar graphs are expressed as mean±SEM, * p≤0.05; ** p≤0.01; *** p≤0.001. See also Figure S6.

Comment in

Similar articles

Cited by

References

    1. Alam H, Williams TW, Dumas KJ, Guo C, Yoshina S, Mitani S, Hu PJ. EAK-7 controls development and life span by regulating nuclear DAF-16/FoxO activity. Cell metabolism. 2010;12:30–41. - PMC - PubMed
    1. Asher G, Reinke H, Altmeyer M, Gutierrez-Arcelus M, Hottiger MO, Schibler U. Poly(ADP-ribose) polymerase 1 participates in the phase entrainment of circadian clocks to feeding. Cell. 2010;142:943–953. - PubMed
    1. Bai P, Canto C, Brunyanszki A, Huber A, Szanto M, Cen Y, Yamamoto H, Houten SM, Kiss B, Oudart H, et al. PARP-2 Regulates SIRT1 Expression and Whole-Body Energy Expenditure. Cell Metab. 2011a;13:450–460. - PMC - PubMed
    1. Bai P, Canto C, Oudart H, Brunyanszki A, Cen Y, Thomas C, Yamamoto H, Huber A, Kiss B, Houtkooper RH, et al. PARP-1 Inhibition Increases Mitochondrial Metabolism through SIRT1 Activation. Cell Metab. 2011b;13:461–468. - PMC - PubMed
    1. Barbosa MT, Soares SM, Novak CM, Sinclair D, Levine JA, Aksoy P, Chini EN. The enzyme CD38 (a NAD glycohydrolase, EC 3.2.2.5) is necessary for the development of diet-induced obesity. Faseb J. 2007;21:3629–3639. - PubMed

Publication types

MeSH terms