. 2013 Jul 18;154(2):452-64.
doi: 10.1016/j.cell.2013.06.022.

Genome-wide generation and systematic phenotyping of knockout mice reveals new roles for many genes

Collaborators, Affiliations

Genome-wide generation and systematic phenotyping of knockout mice reveals new roles for many genes

Jacqueline K White et al. Cell. .

Abstract

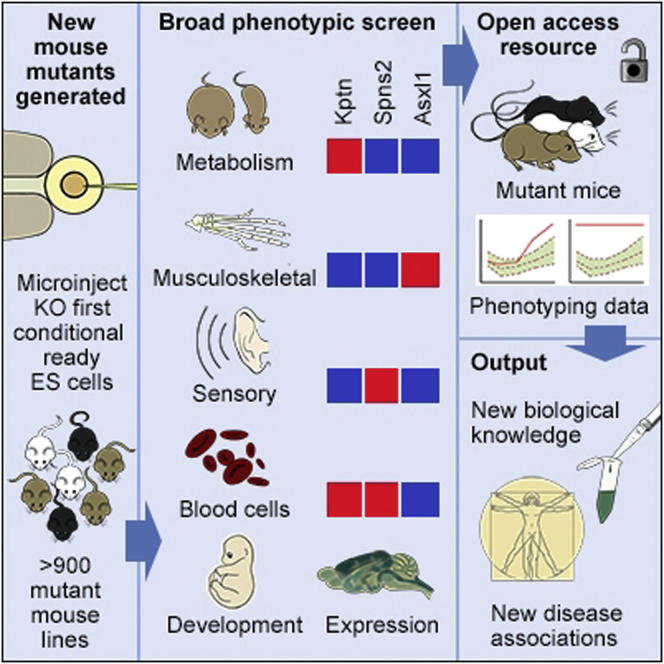
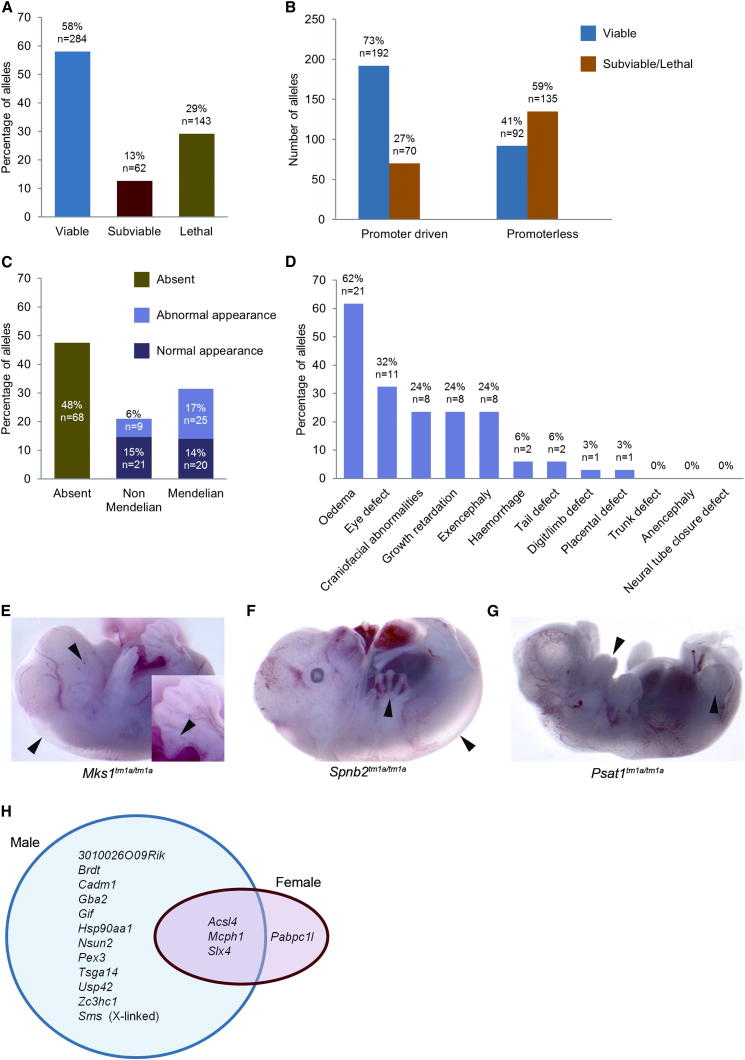
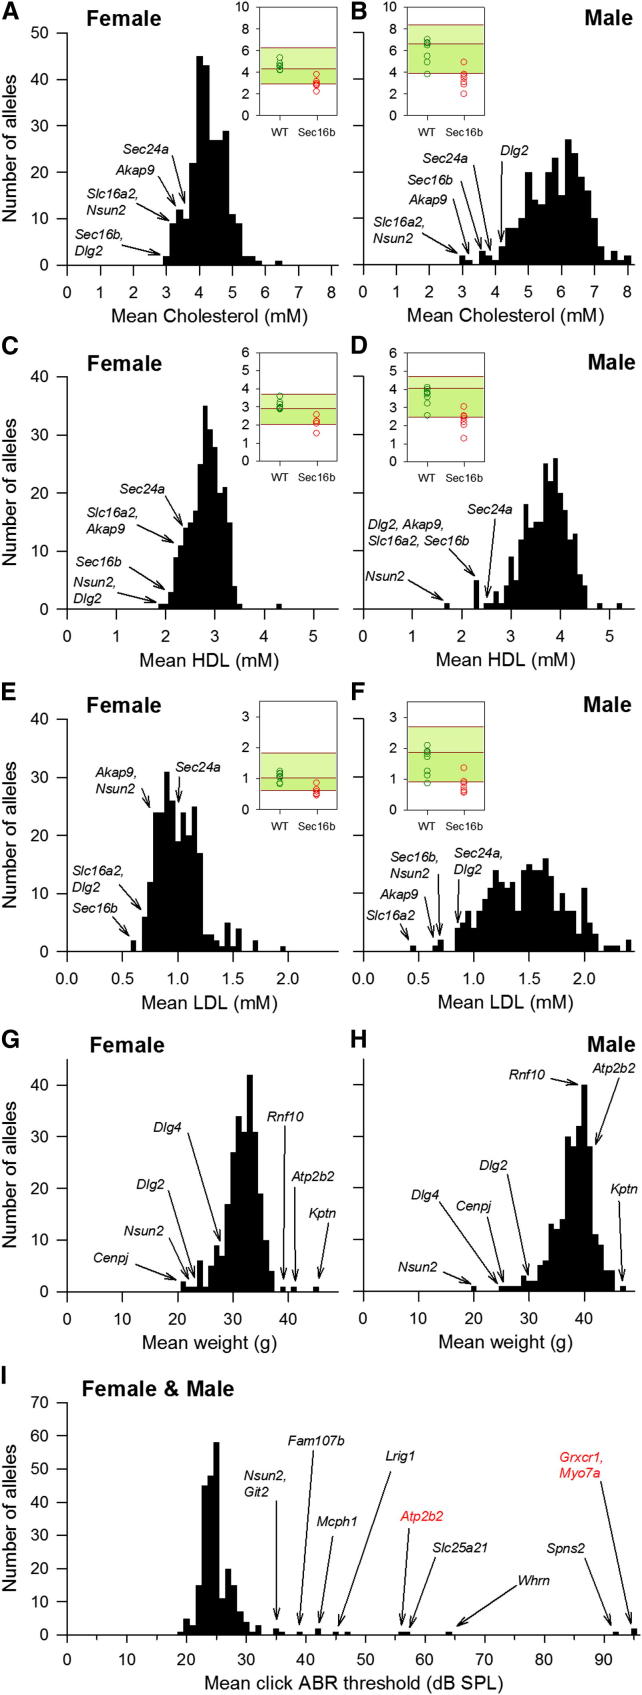
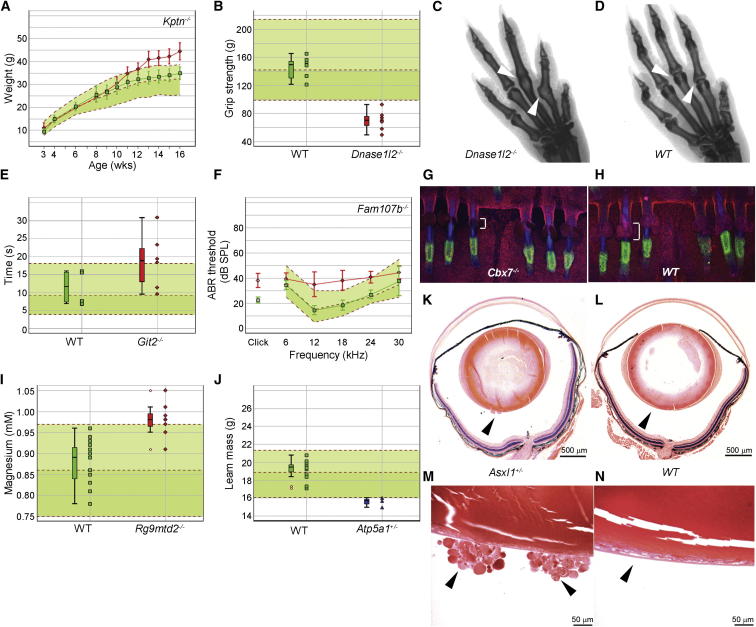
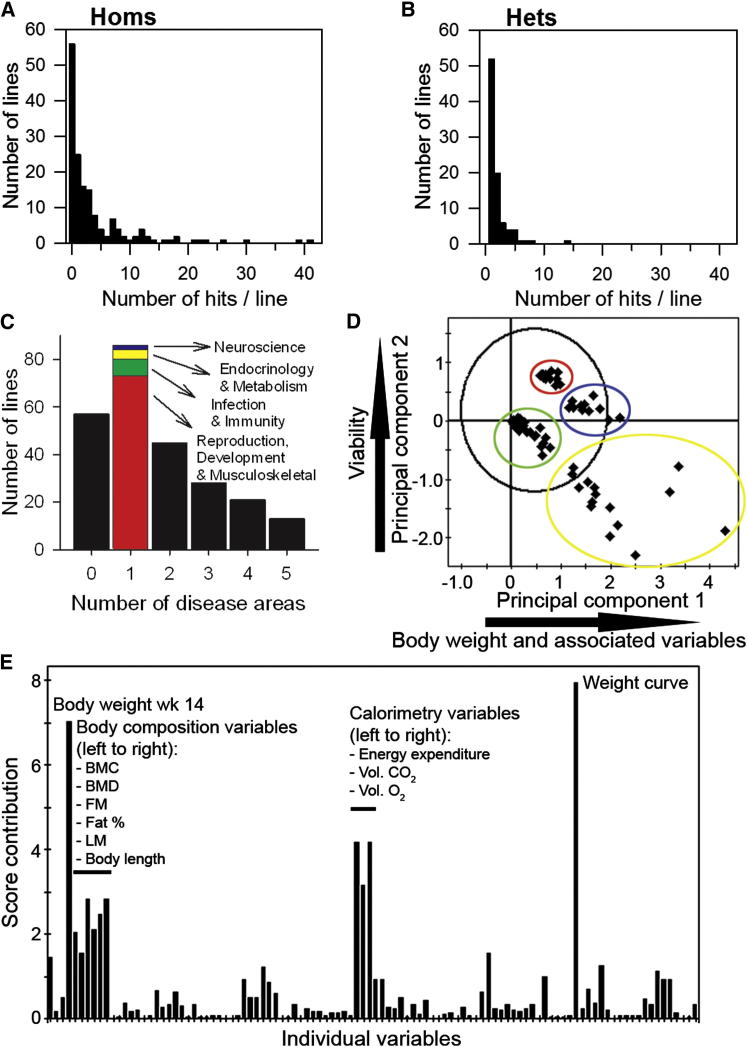
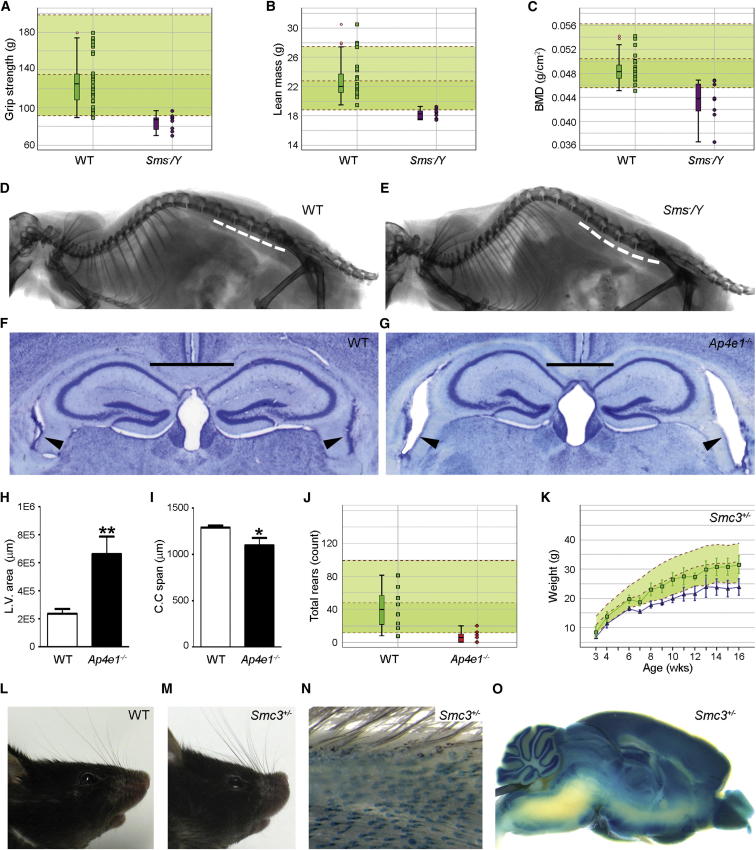
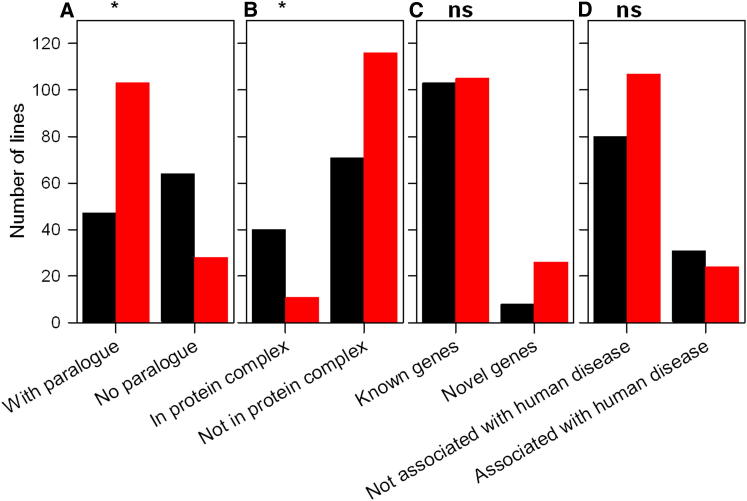
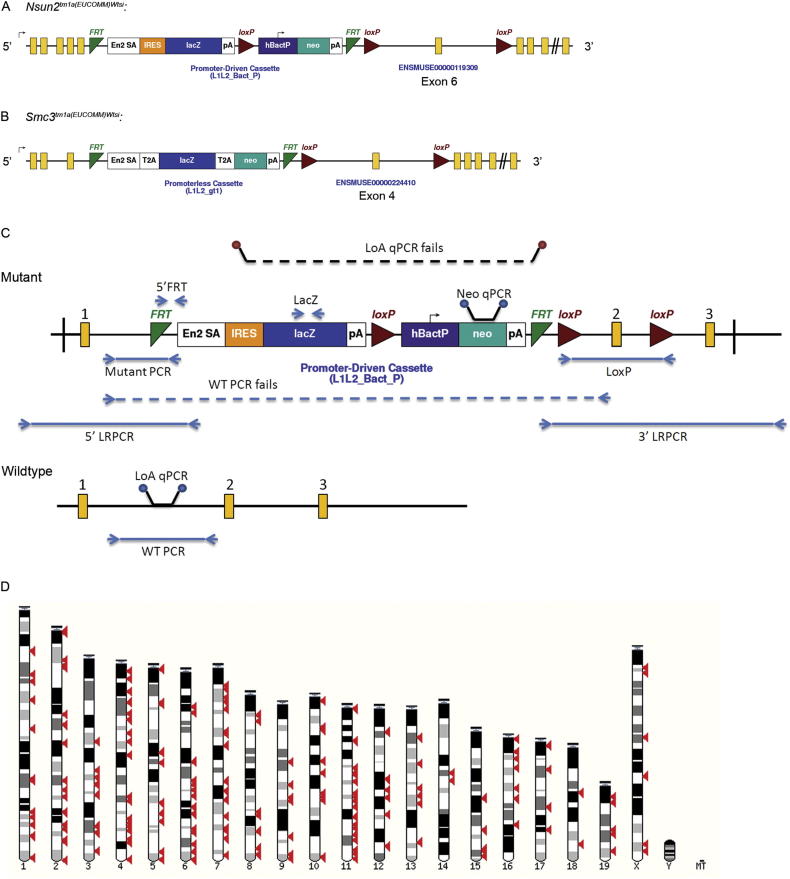
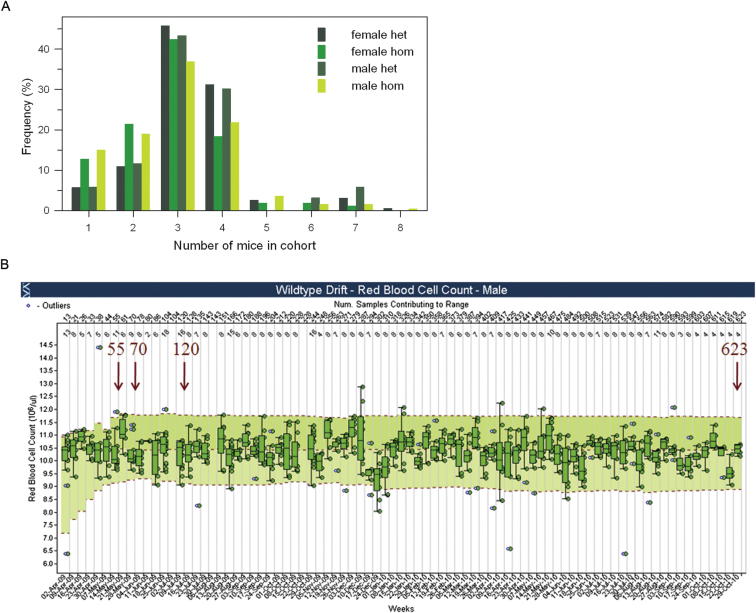
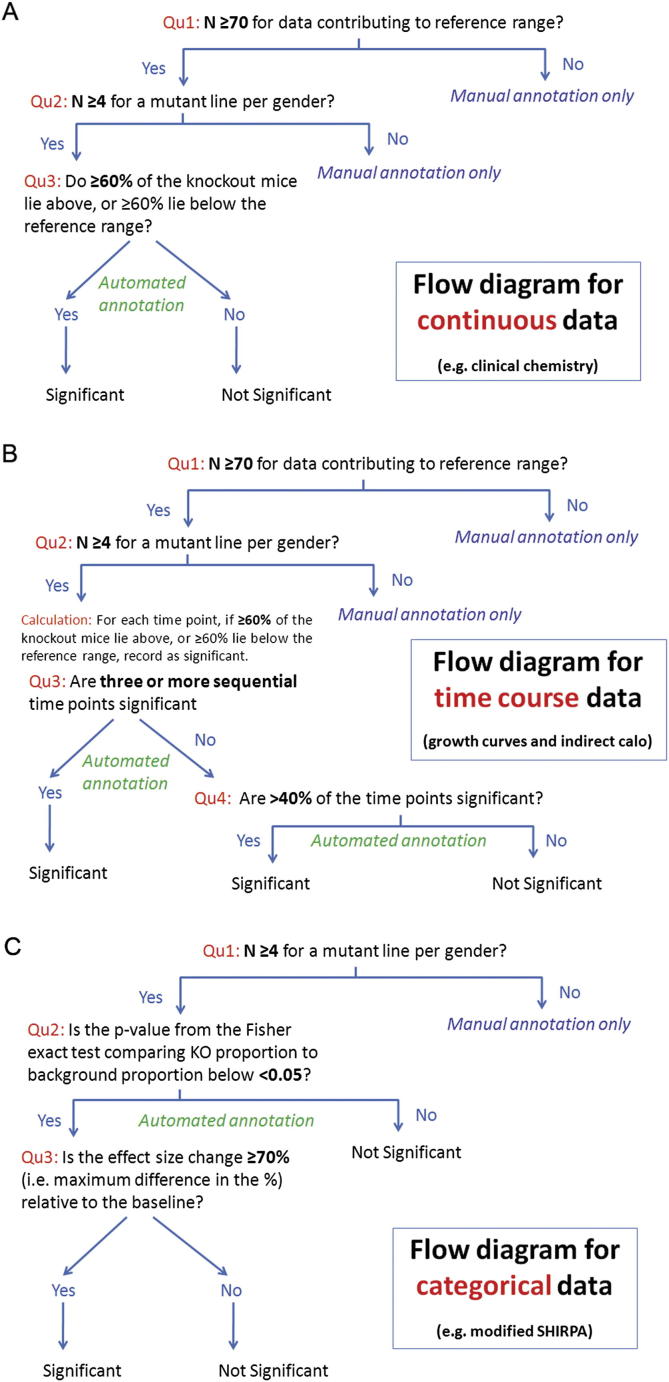
Mutations in whole organisms are powerful ways of interrogating gene function in a realistic context. We describe a program, the Sanger Institute Mouse Genetics Project, that provides a step toward the aim of knocking out all genes and screening each line for a broad range of traits. We found that hitherto unpublished genes were as likely to reveal phenotypes as known genes, suggesting that novel genes represent a rich resource for investigating the molecular basis of disease. We found many unexpected phenotypes detected only because we screened for them, emphasizing the value of screening all mutants for a wide range of traits. Haploinsufficiency and pleiotropy were both surprisingly common. Forty-two percent of genes were essential for viability, and these were less likely to have a paralog and more likely to contribute to a protein complex than other genes. Phenotypic data and more than 900 mutants are openly available for further analysis. PAPERCLIP:


Figures

None
Graphical abstract
Figure 1
Figure 1
Illustration of the Phenotyping Pipelines (A) An overview of the typical workflow from chimera to entry into phenotyping pipelines, encompassing homozygous (Hom) viability, fertility, and target gene expression profiling using the lacZ reporter. Het, heterozygous. (B) The Sanger Institute MGP clinical phenotyping pipeline showing tests performed during each week. Seven male and seven female mutant mice are processed for each allele screened. In addition, seven male and seven female WT controls per genetic background are processed every week. See also Figure S1 and Tables S1 and S2.
Figure 2
Figure 2
Homozygous Viability and Fertility Overview (A) Homozygous viability at P14 was assessed in 489 EUCOMM/KOMP targeted alleles. A minimum of 28 live progeny were required to assign viability status. Lines with 0% homozygotes were classed as lethal, >0% and ≤13% as subviable, and >13% as viable. (B) Comparison of homozygous viability data from targeted alleles carrying either a promoter-driven or promoterless neomycin selection cassette. (C) Lines classed as lethal or subviable at P14 were further assessed for viability at E14.5. Of the 205 targeted alleles eligible for this recessive lethality screen, 143 are reported here. A total of 28 embryos were required to assign viability status, and outcomes were categorized by both the number and dysmorphology of homozygous offspring. (D) A basic dysmorphology screen encompassing 12 parameters was performed on all embryos for the 75 targeted alleles classed as viable or subviable at E14.5. A total of 34 targeted alleles showed one or more abnormality, and the percentage incidence is presented. (E–G) Examples of E14.5 dysmorphology (arrowheads indicate abnormalities) are presented. Homozygous progeny were detected at a Mendelian frequency in all three examples. Sixty-seven percent (six of nine) Mks1tm1a/tm1a embryos presented with edema, polydactyly, and eye defects (E). Sixty-two percent (five of eight) Spnb2tm1a/tm1a embryos presented with edema and hemorrhage (F). Eighty-six percent (six of seven) Psat1tm1a/tm1a embryos presented with growth retardation, exencephaly, and craniofacial abnormalities (G). (H) Fertility was assessed in homozygous viable lines (307 mouse lines assessed from a total of 331 eligible lines). At least four independent 6-week-old mice of each sex were mated for a minimum of 6 weeks, and if progeny were born, the line was classed as fertile, regardless of if the progeny survived to weaning. Of note is the strong skew toward male (blue circle) fertility issues (15 of 16 genes) compared to 4 of 15 genes that displayed female (red circle) fertility issues. See also Table S3.
Figure 3
Figure 3
Data Distributions for Selected Parameters (A–F) Distribution of mean total cholesterol (A and B), mean HDL cholesterol (C and D), and mean LDL cholesterol (E and F) at 16 weeks of age in both sexes for 250 unique alleles. Outliers are identified by gene name. The insets in (A)–(F) present the data for one outlier, Sec16btm1a/tm1a (red circles represent individual mice), compared to the WT controls processed during the same week (green circles), and a cumulative baseline of all WT mice of that age, sex, and genetic background (>260 WT mice) is presented as the median and 95% confidence interval. (G and H) Distribution of mean body weight at 16 weeks in (G) female and (H) male mutant lines of mice. Outliers are identified by gene name. (I) Distribution of mean click ABR threshold at 14 weeks (typically n = 4, independent of sex). Outliers are identified by gene name including positive controls highlighted in red.
Figure 4
Figure 4
Examples of Novel Phenotypes from a Wide Range of Assays with Particular Focus on Novel Genes (A) Elevated body weight gain of Kptntm1a/tm1a females (n = 7) fed a high-fat diet from 4 weeks of age. Mean ± SD body weight is plotted against age for Kptn tm1a/tm1a females (red line) and local WT controls run during the same weeks (n = 16; green line). The median and 95% reference range (2.5% and 97.5%; dotted lines) for all WT mice of the same genetic background and sex (n = 956 females) are displayed on the pale green background. (B) Reduced grip strength in Dnase1l2tm1a/tm1a males (n = 7) (red symbols) compared with controls (n = 8) (green symbols) and the reference range (n = 289). Each mouse is represented as a single symbol on the graph. Median, 25th and 75th percentile (box), and the lowest and highest data point still within 1.5× the interquartile range (IQR) (whiskers) are shown. (C and D) Ankylosis of the metacarpophalangeal joints (arrowheads) shown by X-ray in Dnase1l2tm1a/tm1a mice (C) (six of seven males; five of seven females) compared with WT controls (D) correlates with reduced grip strength (B). (E) Increased latency to respond to heat stimulus in Git2Gt(XG510)Byg/ Gt(XG510)Byg females (n = 6) (red symbols) compared with controls (n = 4) (green symbols) and the reference range (n = 115), with box and whisker plots on the left (see Figure 4B legend). (F) Mild hearing impairment at the middle range of frequencies in Fam107btm1a/tm1a mutants (n = 8) (red line shows mean ± SD) compared with controls (n = 10) and the reference range (n = 440). (G) Smaller sebaceous glands (indicated by bracket) in Cbx7tm1a/tm1a mutant tail skin hairs compared with WT (H). (I) Increased plasma magnesium levels in Rg9mtd2tm1a/tm1a males (n = 8) (red symbols) compared with local controls (n = 15) (green symbols) and the reference range (n = 241), with box and whisker plots on the left (see Figure 4B legend). (J) Decreased lean mass in Atp5a1tm1a/+ females (n = 3) (blue symbols) compared with local controls (n = 15) (green symbols) and the reference range (n = 757), with box and whisker plots on the left (see Figure 4B legend). (K and L) Histopathology showed opacities in the vitreous of eyes from Asx11tm1a/+ mice (K) (arrowheads; scale bar, 500 μm) compared with empty vitreous in WT (L). (M and N) Higher magnification revealed round opacities extending from the lens into the vitreous (arrowheads; scale bar, 50 μm) in Asx11tm1a/+ mice (M) compared with a normal lens contained within the lens capsule in WT mice (N). See also Table S5.
Figure 5
Figure 5
Characteristics of Phenotypic Hits Detected (A) Distribution of the number of phenotypic hits in each line screened as homozygotes showing the peak at no hits but a long tail of lines with multiple hits up to 41. (B) Distribution of hits in lines screened as heterozygotes; all lines had at least one hit (for viability) with a spread up to 14 hits. (C) Distribution of lines with hits in different disease areas showing a peak of lines with just one area affected (colors indicate which areas) but some lines with multiple disease areas involved, indicating a high degree of pleiotropy. (D) Principal component analysis score scatterplot showing the deviation of each gene from the first two principal components to visualize the clustering in genes within the multidimensional space. The black ovoid represents the Hotelling’s T2 95% confidence limits. Colored ovoids mark four different clusters of mutant lines. The two main principal components (or latent variables) in the model are significant in explaining 19.2% and 11.7% of the variation, respectively, and are predictive. (E) Principal component analysis contribution plot indicating the contribution of the variables to the separation between the red and green clusters compared to the blue and yellow clusters in (D). Major phenotypic contributions are labeled. Key to variables is presented in Table S7.
Figure 6
Figure 6
Correlated Disease Characteristics in Knockouts of Three Known Human Disease Genes (A–E) Male hemizygotes for the Sms mutation showed similar features to X-linked Snyder-Robinson syndrome. (A) Reduced grip strength in Sms/Y mice (n = 8) (purple symbols) compared with WT controls (n = 30) (green symbols) and the reference range (n = 793). Each mouse is represented as a single symbol on the graph, with box and whisker plots on the left (see Figure 4B legend). (B and C) Decreased lean mass (B) and bone mineral density (C) in Sms/Y mice (n = 8) (purple symbols) compared with controls (n = 27) (green symbols) and the reference range (n = 753), with box and whisker plots on the left (see Figure 4B legend). (D and E) Lumbar lordosis shown by X-ray (seven of eight males) in Sms/Y (E) compared with WT (D). (F–J) Ap4e1tm1a/tm1a mice displayed similarities to spastic quadriplegic cerebral palsy 4. (F–I) Increased lateral ventricle area (arrowheads in F and G) and decreased corpus callosum span (solid lines in F and G) in Ap4e1tm1a/tm1a mice (G) compared with WT mice (F) with measurements plotted (mean ± SD) in (H) and (I), respectively (p < 0.05, ∗∗ p < 0.01; n = 3 mutant males and 34 WT males). Error bars in (H) and (I) are SD. (J) Decreased rearing in Ap4e1tm1a/tm1a females (n = 7) (red symbols) compared with WT controls (n = 8) (green symbols) and the reference range (n = 180), with box and whisker plots on the left (see Figure 4B legend). (K–O) Surviving Smc3tm1a/+ mice showed similar features to Cornelia de Lange syndrome 3. (K) Decreased body weight in Smc3tm1a/+ females (n = 7) fed on high-fat diet. Mean ± SD body weight is plotted against age for Smc3tm1a/+ females (blue line), WT mice (n = 24; green line), and the reference range (n = 948). (L and M) Distinct craniofacial abnormalities in Smc3tm1a/+ mice including upturned snout (M) (three of seven males, one of seven females), which was not observed in WTs (L) (n = 850 male and 859 female). (N and O) The lacZ reporter gene revealed a distinct Smc3 expression pattern including (N) hair follicles and (O) key brain substructures, noteworthy because of the hirsutism and neurodevelopmental delay aspects of Cornelia de Lange syndrome 3. See also Table S6.
Figure 7
Figure 7
Features Associated with Essential Genes Essential genes (black bars) are compared with genes that are not essential for viability (red bars). The asterisk () indicates significant difference. ns, no significant difference in proportion of essential genes between the two categories. Statistics are presented in Table S3. (A) Genes with no paralog show a significantly larger proportion of essential lines than genes with at least one paralog. (B) Genes predicted to contribute to protein complexes showed a significantly larger proportion of essential lines than genes not predicted to contribute to a complex. (C) Novel genes showed no significant difference in proportion of essential genes or number of hits than known genes. (D) Genes known to underlie human disease were no more likely to be essential than genes not yet associated with human disease.
Figure S1
Figure S1
Allele Design, Genotyping, and Chromosomal Distribution of Genes Selected, Related to Figure 1 (A and B) Examples of the allele designs used. Illustration of the two main alleles used, A, Nsun2tm1a contains a promotor-driven targeting vector, and B, Smc3tm1a contains a promotorless targeting vector [gene build Mouse NCBIM37, (Ensembl 66: Feb 2012)]. The promotorless allele design is biased toward genes that are expressed in ES cells. The alleles are expected to be null alleles, but assessment of the degree of knockdown and the extent of off-target effects on nearby genes has not been carried out systematically. (C) Genotyping and quality control of mice. ES cells: Long-range (LR) PCR, using one primer in the cassette and another outside of the homology arms of the allele design, was used to confirm the targeting on either the 3′ or 5′ side of the vector prior to micro-injection. Mice: To determine the genotype and confirm gene identity, three short-range PCR assays were used: mutant allele-specific, wild-type allele-specific and to detect the lacZ gene. Targeting was confirmed by either LRPCR, loss of the wild-type specific short-range PCR product in homozygotes or a qPCR assay confirming loss of the wild-type allele. Presence of the 3′ LoxP site was detected by either qPCR or short-range PCR assays. Further details of the QC protocols are available from: http://www.knockoutmouse.org/kb/25/. Initially mice were genotyped using a combination of the three short-range PCR assays, but to facilitate high-throughput, we later switched to a qPCR neo cassette counting-based system. Initial genotyping was carried out using ear punches from ∼14 day old mice, so that mice of the desired genotypes for screening could be identified and weaned together. Genotyping was repeated at the far-end of the pipeline after culling, and data were only accepted from mice for which the second genotype was concordant with the 14 day genotype. (D) Genomic distribution of genes studied. An illustration of the mouse karyotype showing the location of genes targeted (red arrowheads) across all chromosomes except Y.
Figure S2
Figure S2
Batch Size and Baseline Variation over Time, Related to Experimental Procedures (A) Batch size of mutant mice. Frequency distribution of cohort size of mice of the same genotype issued to the phenotyping pipeline at a time. For each mutant allele, typically 3 mice of a defined sex and zygosity were issued to the Clinical Phenotyping Pipeline at one time. However, the number ranged from 1-8 mice issued in a single batch or cohort. (B) Baseline variation over time. Example of baseline week to week variation seen in the control data. Example shown is red blood cell count presented weekly from 02/04/09 to 29/10/10 for male mice for the strain group B6Brd;B6Dnk;B6N-Tyrc-Brd. Each boxplot represents data collected from control mice in one week. The size of this effect is significant as shown by some of the box plots not overlapping each other, indicating a Cohen’s d > 3. The pale green area indicates the 95% reference range calculated from the 2.5 and 97.5 percentile values as the data accumulate. Red arrows show the cumulative total of animals contributing to the reference range from 55 mice in May 2009 up to 623 mice in October 2010. The reference range becomes stable after about 70 control mice.
Figure S3
Figure S3
Decision-Making Process for Calling Hits, Related to Experimental Procedures The figures show the process we used to call significant hits for three different types of data: (A) continuous, (B) time course and (C) categorical.

Similar articles

Cited by

References

    1. Abou Jamra R., Philippe O., Raas-Rothschild A., Eck S.H., Graf E., Buchert R., Borck G., Ekici A., Brockschmidt F.F., Nöthen M.M. Adaptor protein complex 4 deficiency causes severe autosomal-recessive intellectual disability, progressive spastic paraplegia, shy character, and short stature. Am. J. Hum. Genet. 2011;88:788–795. - PMC - PubMed
    1. Andreux P.A., Williams E.G., Koutnikova H., Houtkooper R.H., Champy M.F., Henry H., Schoonjans K., Williams R.W., Auwerx J. Systems genetics of metabolism: the use of the BXD murine reference panel for multiscalar integration of traits. Cell. 2012;150:1287–1299. - PMC - PubMed
    1. Andrews T.D., Whittle B., Field M.A., Balakishnan B., Zhang Y., Shao Y., Cho V., Kirk M., Singh M., Xia Y. Massively parallel sequencing of the mouse exome to accurately identify rare, induced mutations: an immediate source for thousands of new mouse models. Open Biol. 2012;2:120061. - PMC - PubMed
    1. Ayadi A., Birling M.C., Bottomley J., Bussell J., Fuchs H., Fray M., Gailus-Durner V., Greenaway S., Houghton R., Karp N. Mouse large-scale phenotyping initiatives: overview of the European Mouse Disease Clinic (EUMODIC) and of the Wellcome Trust Sanger Institute Mouse Genetics Project. Mamm. Genome. 2012;23:600–610. - PMC - PubMed
    1. Bearer E.L., Chen A.F., Chen A.H., Li Z., Mark H.F., Smith R.J.H., Jackson C.L. 2E4/Kaptin (KPTN)— a candidate gene for the hearing loss locus, DFNA4. Ann. Hum. Genet. 2000;64:189–196. - PMC - PubMed

Supplemental References

    1. Berriz G.F., Beaver J.E., Cenik C., Tasan M., Roth F.P. Next generation software for functional trend analysis. Bioinformatics. 2009;25:3043–3044. - PMC - PubMed
    1. Boyle E.I., Weng S., Gollub J., Jin H., Botstein D., Cherry J.M., Sherlock G. GO::TermFinder—open source software for accessing Gene Ontology information and finding significantly enriched Gene Ontology terms associated with a list of genes. Bioinformatics. 2004;20:3710–3715. - PMC - PubMed
    1. Erdfelder E., Faul F., Buchner A. GPOWER: a general power analysis program. Behav. Res. Methods Instrum. Comput. 1996;28:1–11.
    1. Flicek P., Amode M.R., Barrell D., Beal K., Brent S., Chen Y., Clapham P., Coates G., Fairley S., Fitzgerald S. Ensembl 2011. Nucleic Acids Res. 2011;39(Database issue):D800–D806. - PMC - PubMed
    1. Käll L., Krogh A., Sonnhammer E.L. A combined transmembrane topology and signal peptide prediction method. J. Mol. Biol. 2004;338:1027–1036. - PubMed

Publication types