

Large uptake of titania and iron oxide nanoparticles in the nucleus of lung epithelial cells as measured by Raman imaging and multivariate classification
- PMID: 23870252
- PMCID: PMC3714881
- DOI: 10.1016/j.bpj.2013.06.017
Large uptake of titania and iron oxide nanoparticles in the nucleus of lung epithelial cells as measured by Raman imaging and multivariate classification
Abstract
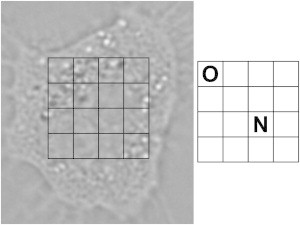
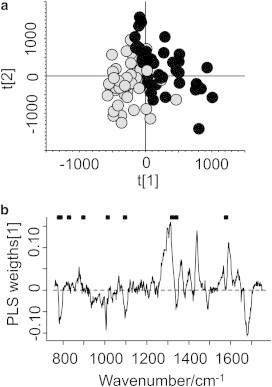
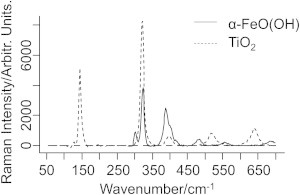
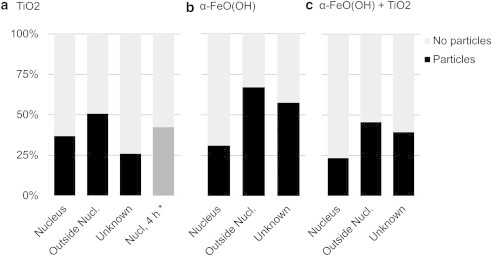
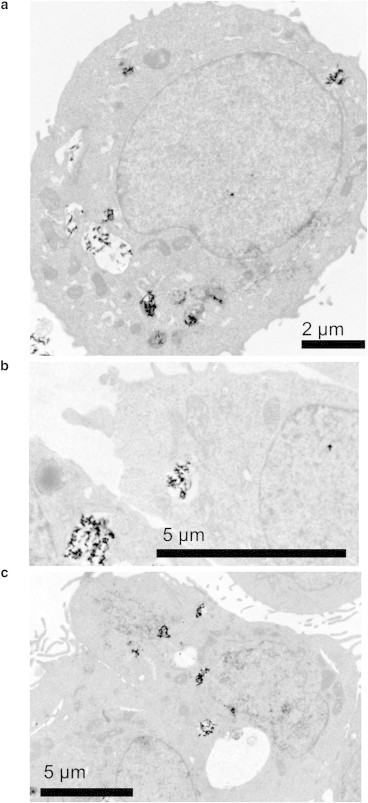
It is a challenging task to characterize the biodistribution of nanoparticles in cells and tissue on a subcellular level. Conventional methods to study the interaction of nanoparticles with living cells rely on labeling techniques that either selectively stain the particles or selectively tag them with tracer molecules. In this work, Raman imaging, a label-free technique that requires no extensive sample preparation, was combined with multivariate classification to quantify the spatial distribution of oxide nanoparticles inside living lung epithelial cells (A549). Cells were exposed to TiO2 (titania) and/or α-FeO(OH) (goethite) nanoparticles at various incubation times (4 or 48 h). Using multivariate classification of hyperspectral Raman data with partial least-squares discriminant analysis, we show that a surprisingly large fraction of spectra, classified as belonging to the cell nucleus, show Raman bands associated with nanoparticles. Up to 40% of spectra from the cell nucleus show Raman bands associated with nanoparticles. Complementary transmission electron microscopy data for thin cell sections qualitatively support the conclusions.
Copyright © 2013 Biophysical Society. Published by Elsevier Inc. All rights reserved.
Figures


References
-
- Committee for Review of the Federal Strategy to Address Environmental, Health, and Safety Research Needs for Engineered Nanoscale Materials, Committee on Toxicology, National Research Council . National Academies Press; Washington, DC: 2009. Review of Federal Strategy for Nanotechnology-Related Environmental, Health, and Safety Research. - PubMed
-
- 2009. Risk Assessment of Products of Nanotechnologies. Scientific Committee on Emerging and Newly Identified Health Risks. http://ec.europa.eu/health/ph_risk/committees/04_scenihr/docs/scenihr_o_....
-
- Zhu M.-T., Feng W.-Y., Chai Z.F. Particokinetics and extrapulmonary translocation of intratracheally instilled ferric oxide nanoparticles in rats and the potential health risk assessment. Toxicol. Sci. 2009;107:342–351. - PubMed
-
- Hussain S., Vanoirbeek J.A.J., Hoet P.H.M. Interactions of nanomaterials with the immune system. Wiley Interdiscip. Rev. Nanomed. Nanobiotechnol. 2012;4:169–183. - PubMed
Publication types
MeSH terms
Substances
LinkOut - more resources
Full Text Sources
Other Literature Sources
Molecular Biology Databases
