. 2013 Jul 16;105(2):502-11.
doi: 10.1016/j.bpj.2013.05.049.

Platelet transport rates and binding kinetics at high shear over a thrombus

Affiliations

Platelet transport rates and binding kinetics at high shear over a thrombus

David L Bark Jr et al. Biophys J. .

Abstract

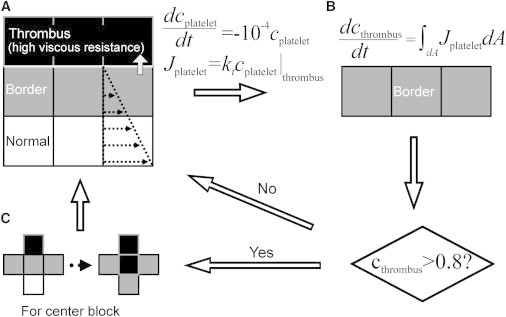
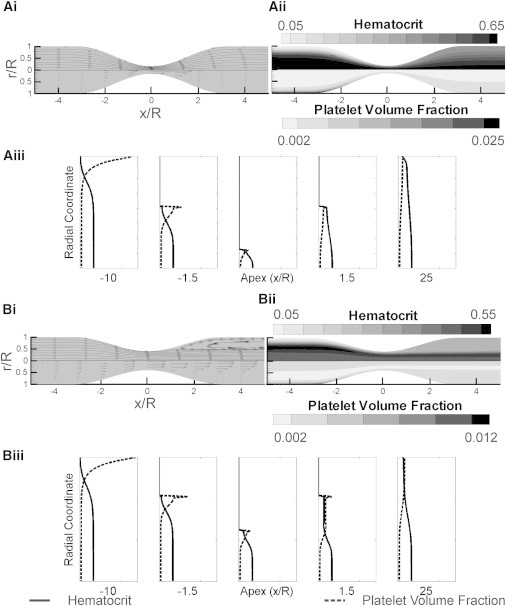
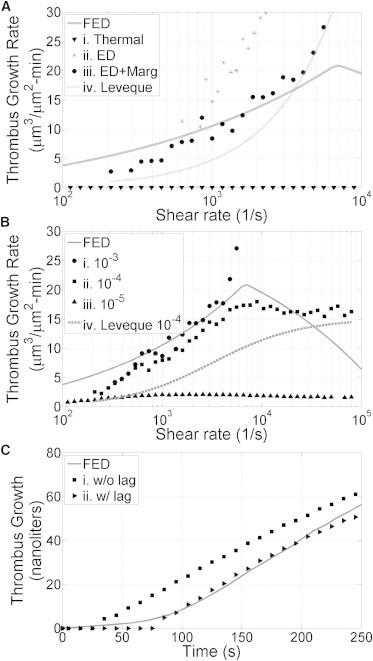
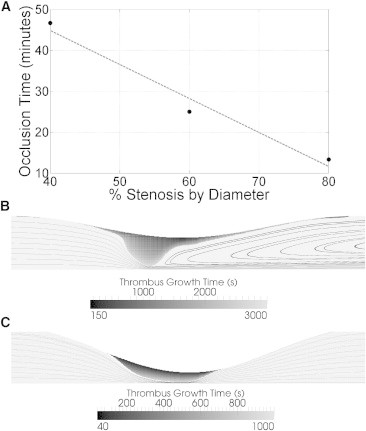
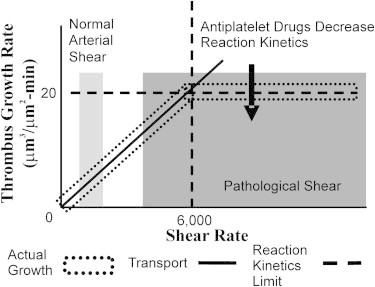
Thrombus formation over a ruptured atherosclerotic plaque cap can occlude an artery with fatal consequences. We describe a computational model of platelet transport and binding to interpret rate-limiting steps seen in experimental thrombus formation over a collagen-coated stenosis. The model is used to compute shear rates in stenoses with growing boundaries. In the model, moving erythrocytes influence platelet transport based on shear-dependent enhanced diffusivity and a nonuniform platelet distribution. Adhesion is modeled as platelet-platelet binding kinetics. The results indicate that observed thrombus growth rates are limited by platelet transport to the wall for shear rates up to 6000 s(-1). Above 7000 s(-1), the thrombus growth rate is likely limited by binding kinetics (10(-4) m/s). Thrombus growth computed from these rate-limiting steps match the thrombus location and occlusion times for experimental conditions if a lag time for platelet activation is included. Using fitted parameters, the model is then used to predict thrombus size and shape at a higher Reynolds number flow consistent with coronary artery disease.


Figures

Figure 1
Figure 1
Schematic of the algorithm used to model thrombus growth. (A) Three different regions exist, including normal, thrombus border, and thrombus. The flow field is determined in all computational cells. Thrombus acts as a solid region, impenetrable to flow and RBC’s. Species transport is computed for platelets with a sink term in the thrombus and a flux term acting as a boundary condition between a thrombus border and thrombus to simulate deposition of platelets. (B) The rate of change of the thrombus volume fraction in the thrombus border is determined by integrating the flux of platelets out of the thrombus border. After the volume fraction of a thrombus border is >0.8 platelets, the cell is converted to thrombus. (C) All computational cells adjacent to a new thrombus are converted to a thrombus border.
Figure 2
Figure 2
(A) Flow computed from an 84% stenosis by diameter with a Re inlet of 1 to match conditions of an in vitro experiment. (i) Streamlines (top) and velocity vectors (bottom) illustrate steady laminar flow. (ii) RBC (top) and platelet (bottom) volume fraction radial profiles vary slightly along the axis of the vessel. Downstream of the stenosis, the RBCs and platelets disperse more evenly across the vessel, minimizing platelet margination. (iii) Plots of the radial concentration profiles at different axial locations. Margination is clear upstream of the stenosis, but the near-wall platelets are reduced near the apex of the stenosis. Concentration profiles remain disturbed downstream of the stenosis apex. (B) Coronary flow conditions computed from a 60% stenosis by diameter with a Re inlet based on Eq. 11. (i) A recirculation region occurs downstream of the stenosis, as illustrated by streamlines (top) and velocity vectors (bottom). Fluid velocities near the central axis remain high downstream of the stenosis. (ii) Hematocrit (top) and platelet (bottom) concentration contours. The recirculation region has a more uniformly distributed platelet volume fraction over a wider radial distance. Conversely, RBCs congregate in the center stream downstream of the apex with few in the recirculation region. (iii) Radial volume fractions of platelets and RBCs 2 mm downstream of the stenosis apex have a similar profile to the apex, due to the relative rate of the flow compared to the diffusion rate.
Figure 3
Figure 3
Plots consist of an average accumulation of platelets in the model over a 4-min time span. The experimental curve corresponds to the equation: J(<6790s1)=1.7γ˙0.303.0,J(>6790s1)=341.1γ˙0.28μm3/μm2min. (A) Platelet flux to the wall versus shear rates for different model transport conditions compared to experimental thrombus growth rates for an 84% stenosis with a flow rate of 0.25 mL/min and a kinetic binding rate of 10−3 m/s, which effectively acts as infinite sink for shear rates <6000 s−1. (i) Platelet flux from thermal motion. (ii) Platelet flux from enhanced diffusivity (ED) only. (iii) Platelet flux with ED and RBC skewing. (iv) Platelet flux from the Leveque approximation. (B) Modeled thrombus growth rates relative to shear under the conditions of panel A, but with different kinetic binding rates: (i) kt = 10−3 m/s, (ii) kt = 10−4 m/s, and (iii) kt = 10−5 m/s. (iv) The Leveque model is also plotted with a kinetic binding rate, kt = 10−4 m/s, for comparison. (C) Modeled thrombus volume versus time for two conditions compared to an average of experimental thrombus growth with a flow rate based of 0.25ml/min and an initial 84% stenosis. (i) kt = 10−4 m/s. (ii) kt = 10−4 m/s in addition to a lag time for platelet activation under shear as described by Eq. 12. Note that the lag time is added based on the average lag time as a function of shear rate given in Bark et al. (38).
Figure 4
Figure 4
Occlusion time for a given stenosis under average flow conditions of a coronary artery, with the full model. (A) The occlusion time decreases as the stenosis severity increases. (Dashed line) Guide to the eye. (B) Moderate stenosis (40%) creates a focal thrombus at the throat with a large separation zone downstream of the thrombus after 47 min. (C) Severe stenosis (80%) creates a thrombus with a broader base in the throat after 13 min. No separation zone was present in this stenosis, either initially or near occlusion.
Figure 5
Figure 5
Depiction of the general relationship between thrombus growth that is limited by transport versus growth limited by kinetic binding over a range of pathologic shear rates. (Dark shaded box) Normal human mean arterial shear rates between 50 s−1 in the ascending aorta to 500 s−1 in the coronary arteries. (Light shaded box) Pathological arterial shear rates in stenoses >40%. Drugs that reduce the kinetic binding rate (e.g., competitive inhibitors) will lower the line of kinetic rate-limited binding, but may not affect transport-limited binding.

References

    1. Yutani C., Imakita M., Ikeda Y. Coronary atherosclerosis and interventions: pathological sequences and restenosis. Pathol. Int. 1999;49:273–290. - PubMed
    1. Viles-Gonzalez J.F., Fuster V., Badimon J.J. Atherothrombosis: a widespread disease with unpredictable and life-threatening consequences. Eur. Heart J. 2004;25:1197–1207. - PubMed
    1. Davies M.J., Thomas A. Thrombosis and acute coronary-artery lesions in sudden cardiac ischemic death. N. Engl. J. Med. 1984;310:1137–1140. - PubMed
    1. Chandler A.B., Chapman I., Simon T.L. Coronary thrombosis in myocardial infarction. Report of a workshop on the role of coronary thrombosis in the pathogenesis of acute myocardial infarction. Am. J. Cardiol. 1974;34:823–833. - PubMed
    1. Markou C.P., Hanson S.R., Ku D.N. The role of high wall shear rate on thrombus formation in stenoses. Adv. Bioeng. 1993;26:555–558.

Publication types