. 2013 Jul 17;14(1):104-15.
doi: 10.1016/j.chom.2013.06.005.

A microscale human liver platform that supports the hepatic stages of Plasmodium falciparum and vivax

Affiliations

A microscale human liver platform that supports the hepatic stages of Plasmodium falciparum and vivax

Sandra March et al. Cell Host Microbe. .

Abstract

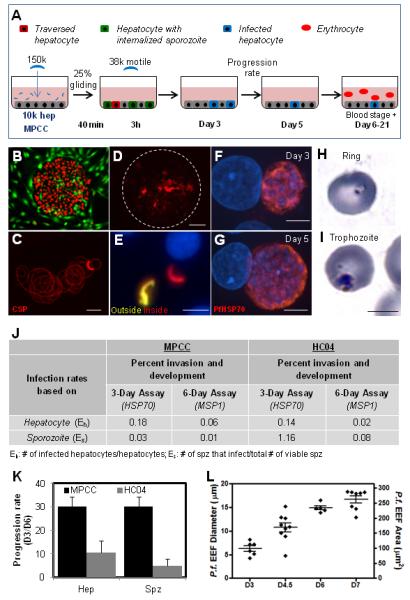
The Plasmodium liver stage is an attractive target for the development of antimalarial drugs and vaccines, as it provides an opportunity to interrupt the life cycle of the parasite at a critical early stage. However, targeting the liver stage has been difficult. Undoubtedly, a major barrier has been the lack of robust, reliable, and reproducible in vitro liver-stage cultures. Here, we establish the liver stages for both Plasmodium falciparum and Plasmodium vivax in a microscale human liver platform composed of cryopreserved, micropatterned human primary hepatocytes surrounded by supportive stromal cells. Using this system, we have successfully recapitulated the full liver stage of P. falciparum, including the release of infected merozoites and infection of overlaid erythrocytes, as well as the establishment of small forms in late liver stages of P. vivax. Finally, we validate the potential of this platform as a tool for medium-throughput antimalarial drug screening and vaccine development.


Figures

Figure 1
Figure 1. Functional characterization of cryopreserved human hepatocytes in micropatterned cocultures and cryopreserved Plasmodium falciparum sporozoites
(A) Morphology of primary human hepatocytes in micropatterned cocultures (left; hepatocytes, red and fibroblasts, green). Representative coculture of hepatocytes with (middle) and without fibroblasts (right) 18 days post-seeding. (B) Albumin secretion, urea synthesis and CYP450 activity in MPCC cultures of different donors. Red dashed lines indicate average levels readout in 6-day hepatocyte monocultures (stdev: 0.9, 5.4 and 0.06, respectively) (C) P. falciparum, P. yoelii and P. berghei infection across donors. (D) Representative CD81 immunofluorescence staining at day 4 post-seeding (left); heat map indicates relative CD81 expression per donor, as measured by IF (right; n.d, not detected) (E) P. falciparum infection in hepatocyte monocultures, micropattern (MP) or randomly distributed (Random), relative to infection in MPCCs. 10K hepatocytes were plated in each case (F) Levels of infection by three sporozoite batches in a single hepatocyte donor. See also Figure S1. Error bars represent standard deviation (stdev). See also Figure S1.
Figure 2
Figure 2. Liver stage recapitulation in primary human hepatocyte MPCCs
(A) Schematic of P. falciparum infection assay. (B) Typical morphology of primary human hepatocytes in MPCC (hepatocytes, red; fibroblasts, green). (C) Representative image of P. falciparum sporozoites gliding. CSP immunostaining used to visualize trails. Quantification based on the average fraction of sporozoites that perform at least one circle. (D) Cell traversal ability of P. falciparum sporozoites as visualized by dextran-positive staining of primary human hepatocytes. (E) Representative double immunofluorescence stain (anti-PfCSP, both before and after cell permeablization) of P. falciparum infected MPCCs. Extracellular and intracellular sporozoites are labeled yellow and red, respectively. Nuclei visible with blue DAPI stain. (F, G) Representative images of P. falciparum in human primary hepatocytes at day 3 and 5 post-infection. Parasites are identified by anti-PfHSP70 staining (red). (H,I) Infection of human RBCs by merozoites released from infected liver stage culture. Representative images of Giemsa-stained RBCs in the ring stage (H), and the trophozoite stage (I). (J) Infection rates using MPCC primary human hepatocytes or HC04 hepatoma cells, calculated based on the plated number of sporozoites or hepatocytes. (K) Progression rate from day 3 to day 6 in MPCC and HC04 calculated as: Infection rate day 6/infection rate day 3 × 100 (based on hepatocytes and sporozoites) (L) Schizont size distribution at day 3, 4.5, 6 and 7. Scale bar: 5μm (F-I), 10μm (C,E), 100μm (D). Error bars represent standard error of the mean (SEM).
Figure 3
Figure 3. Comparison of live attenuated versus wild-type parasite for candidate vaccine evaluation
(A) Number of infected hepatocytes observed after wild-type (non-attenuated) and attenuated cryopreserved sporozoites infection (B) Size distribution of wild-type and attenuated parasites in MPCC after five days of culture. (C) Representative images of parasites at day 5 post infection. Wild-type parasites are identified by anti-MSP-1 and anti-EBA-175 staining. Attenuated parasites are identified by anti-LSA-1 staining. Nuclei are visualized with DAPI (blue). Scale bar: 10μm. Error bars represent standard error of the mean (SEM).
Figure 4
Figure 4. Utility of medium-throughput human hepatocyte platform to identify lead compounds
(A) Primaquine treatment of MPCC or HC04 infected with fresh or cryopreserved sporozoites. (B) IC50 of primaquine in MPCC vs HC04 (p = 0.0002 by 1way ANOVA, ***p < 0.001 by Tukey multiple comparison test). (C) Primaquine metabolism by HC04, MPCC, and patterned monocultures of primary human hepatocytes (Hep MP), quantified by LC/MS/MS. (D) Relative expression of 3 putative metabolism genes implicated in primaquine metabolism (E) Heat map displays of LMA-Luminex analysis for 83 human-specific drug metabolism genes. Columns represent triplicate loadings of RNA extracted from HEPG2, HC04, MPCC and Hep MP. Gene expression relative to average of control gene transferrin, and heat maps are row-normalized. See also Figure S2. Error bars represent standard error of the mean (SEM). See also Figure S2.
Figure 5
Figure 5. Adapting the format to drug screening
(A) Inter-experimental variability measured by the coefficient of variation (CV) and infection rate using fresh and cryopreserved sporozoites from three different batches. (B) Inter-experimental variability measured by the coefficient of variation (CV) and infection rate using cryopreserved sporozoites from the same batch. (C) Heat map indicating levels of infection (green, highest EEF numbers; red, lowest EEF numbers) observed in 7 representative control or primaquine treated wells. Comparison yields positive Z factor. (D) P. falciparum infection with primaquine or atovaquone in 2 independent experiments performed on different days. (E) P. falciparum infection in MPCCs following two doses of fresh sporozoites determined by manual counts (M) or by image analysis automation (A). See also Figure S3. Error bars represent standard error of the mean (SEM). See also Figure S3.
Figure 6
Figure 6. Infection with Plasmodium vivax
(A) Representative image of PvCSP-stained P. vivax (chesson) sporozoites gliding. (B) Representative images of PvCSP+ parasites over time. Scale bar: 10μm. (C) Size distribution of P. vivax parasites in MPCC over time. Red: all observed parasites bigger than 5μm; black: 20 representative small forms smaller than 5μm. See also Figure S4.

Comment in

References

    1. Albuquerque SS, Carret C, Grosso AR, Tarun AS, Peng X, Kappe SH, Prudencio M, Mota MM. Host cell transcriptional profiling during malaria liver stage infection reveals a coordinated and sequential set of biological events. BMC Genomics. 2009;10:270. - PMC - PubMed
    1. Alonso PL, Ballou R, Brown G, Chitnis C, Loucq C, Moorthy V, Saul A, Wirth D. A research agenda for malaria eradication: vaccines. PLoS Med. 2011a;8:e1000398. - PMC - PubMed
    1. Alonso PL, Djimde A, Kremsner P, Magill A, Milman J, Najera J, Plowe CV, Rabinovich R, Wells T, Yeung S. A research agenda for malaria eradication: drugs. PLoS Med. 2011b;8:e1000402. - PMC - PubMed
    1. Annoura T, Ploemen IH, van Schaijk BC, Sajid M, Vos MW, van Gemert GJ, Chevalley-Maurel S, Franke-Fayard BM, Hermsen CC, Gego A, et al. Assessing the adequacy of attenuation of genetically modified malaria parasite vaccine candidates. Vaccine. 2012;30:2662–2670. - PubMed
    1. Bhatia SN, Balis UJ, Yarmush ML, Toner M. Effect of cell-cell interactions in preservation of cellular phenotype: cocultivation of hepatocytes and nonparenchymal cells. FASEB J. 1999;13:1883–1900. - PubMed

Publication types