. 2013 Jul 25;39(1):97-110.
doi: 10.1016/j.immuni.2013.06.012. Epub 2013 Jul 18.

Antagonistic regulation by the transcription factors C/EBPα and MITF specifies basophil and mast cell fates

Affiliations

Antagonistic regulation by the transcription factors C/EBPα and MITF specifies basophil and mast cell fates

Xiaopeng Qi et al. Immunity. .

Abstract

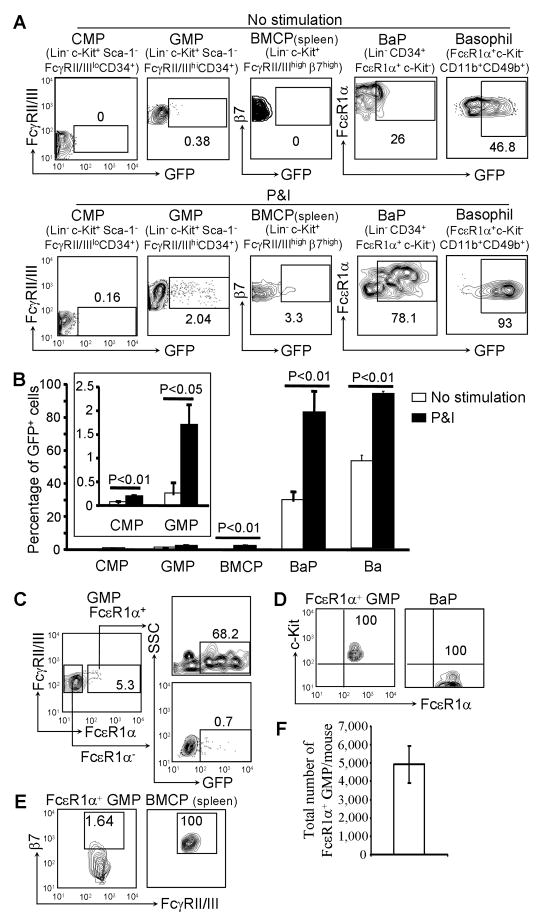
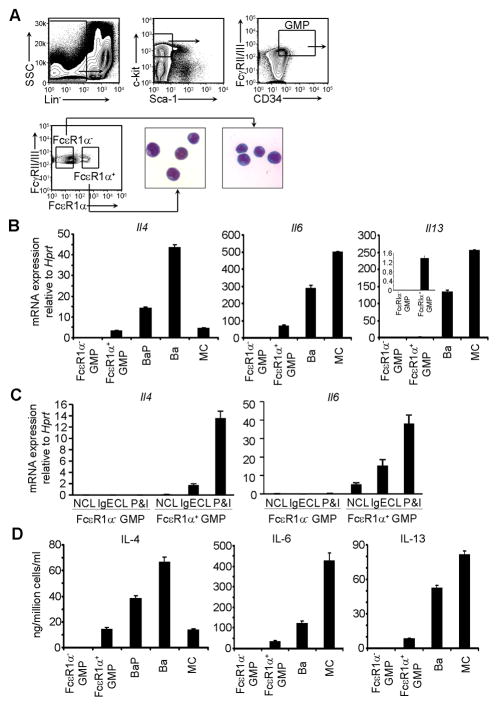
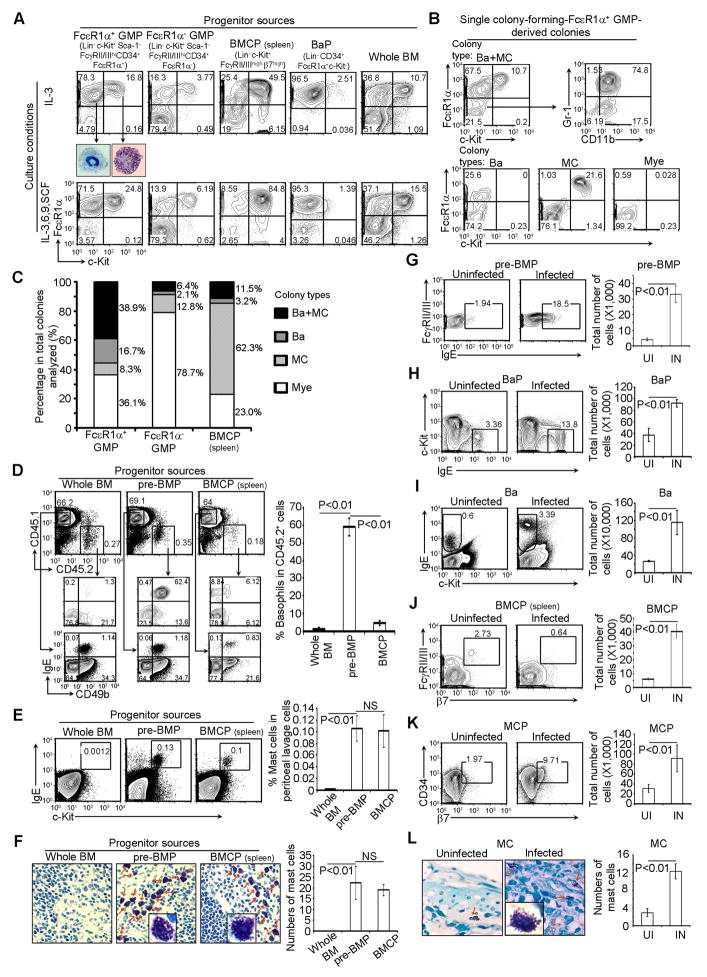
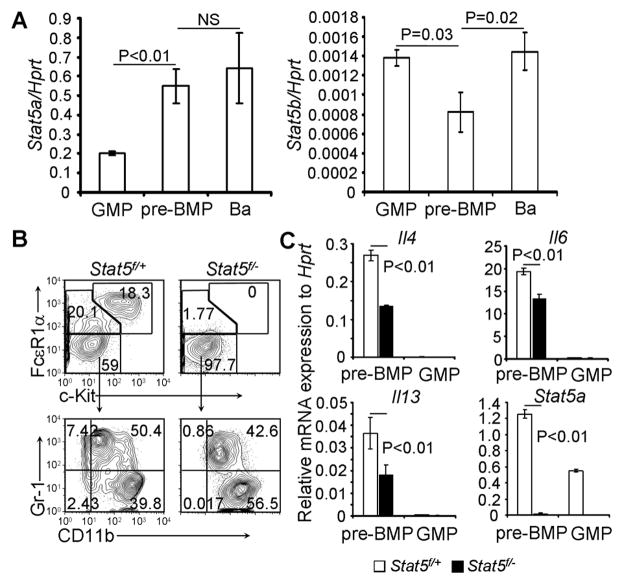
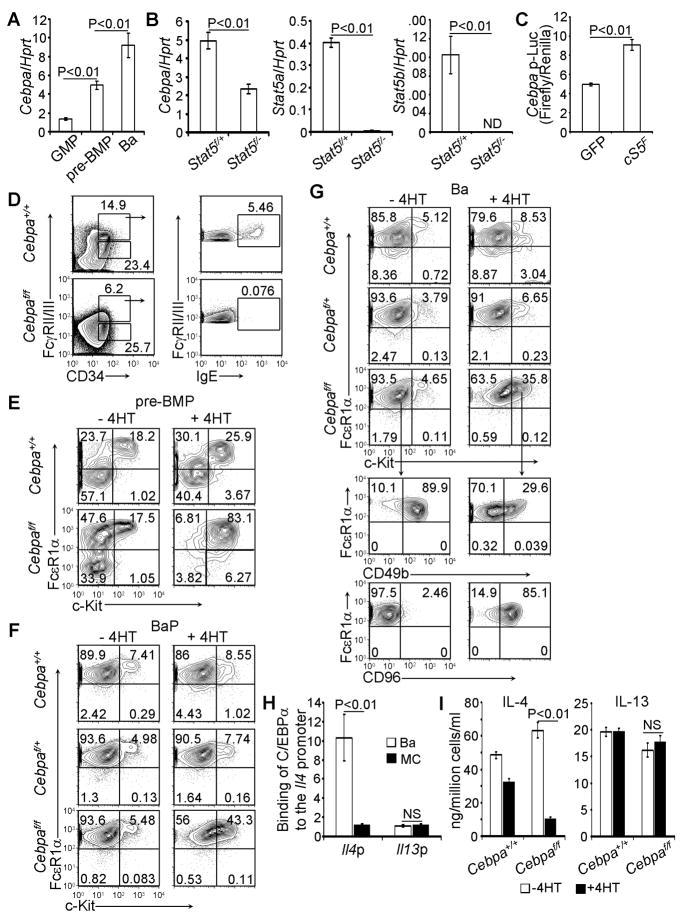
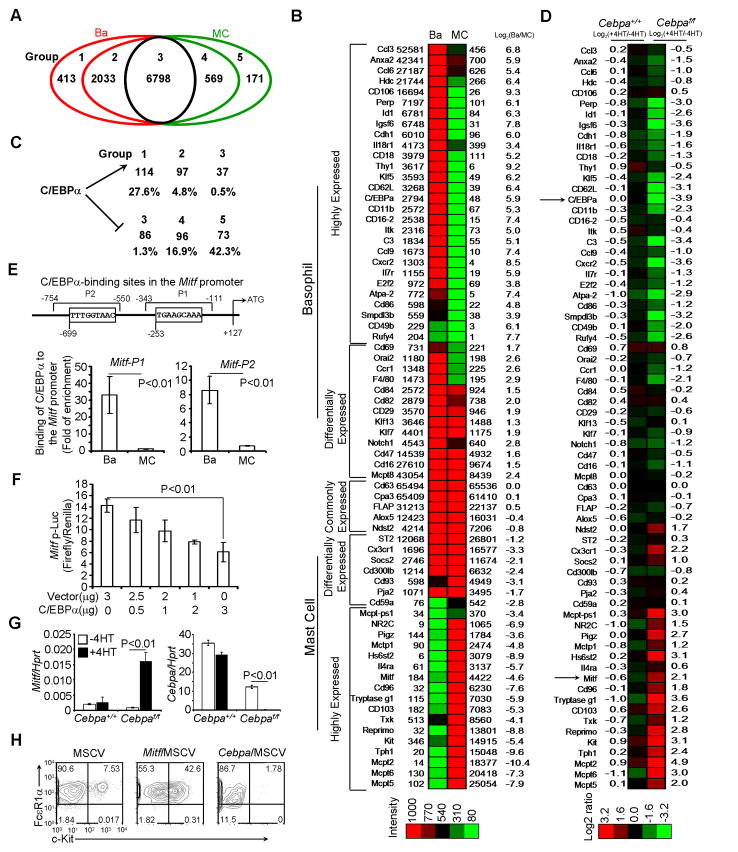
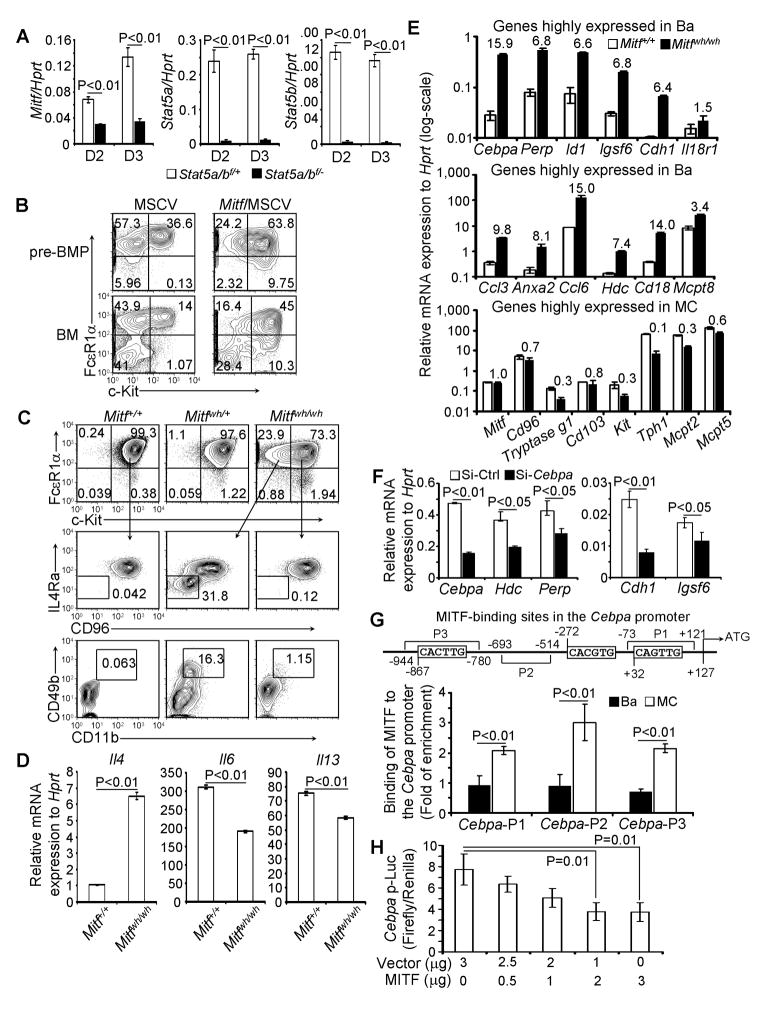
It remains unclear whether basophils and mast cells are derived from a common progenitor. Furthermore, how basophil versus mast cell fate is specified has not been investigated. Here, we have identified a population of granulocyte-macrophage progenitors (GMPs) that were highly enriched in the capacity to differentiate into basophils and mast cells while retaining a limited capacity to differentiate into myeloid cells. We have designated these progenitor cells "pre-basophil and mast cell progenitors" (pre-BMPs). STAT5 signaling was required for the differentiation of pre-BMPs into both basophils and mast cells and was critical for inducing two downstream molecules: C/EBPα and MITF. We have identified C/EBPα as the critical basophil transcription factor for specifying basophil cell fate and MITF as the crucial transcription factor for specifying mast cell fate. C/EBPα and MITF silenced each other's transcription in a directly antagonistic fashion. Our study reveals how basophil and mast cell fate is specified.


Figures

Figure 1
Figure 1. A Subset of GMPs Begins to Acquire the Capacity to Express the Il4 Reporter Gene
(A) FACS analysis of GFP expression in progenitors of the bone marrow or the spleen prepared from Il4G4/+ mice. The numbers inside the FACS plots indicate the percentage within the gated populations. (B) The percentages of GFP+ cells within the gated populations (mean ± SD, n=3). (C) FACS sorted GMPs from the bone marrow of Il4G4/+ mice were stimulated with P&I for 6 hours and stained with APC-labeled anti-FcεR1α antibody. (D) c-Kit expression comparison between FcεR1α+GMPs and BaPs. (E) β7 expression comparison between FcεR1α+ GMPs and BMCPs in the spleen. (F) Total number of FcεR1α+ GMPs in two tibias and two femur bones per mouse (mean ± SD, n=6). Data are representative of three independent experiments with similar results. Also see Figure S1.
Figure 2
Figure 2. FcεR1α+ GMPs Possess the Ability to Express IL-4, IL-6, and IL-13
(A) The gates for sorting FcεR1α and FcεR1α+ GMPs. The sorted FcεR1α and FcεR1α+ GMPs were stained with May-Grunwald Giemsa. (B) The sorted cells were stimulated with P&I for 4 hours. mRNA expression was measured by qPCR (mean ± SD, triplicates). Ba=basophils; MC=BMMC. (C) The sorted FcεR1α and FcεR1α+ GMPs were not cross-linked (NCL) with IgE, cross-linked with IgE (IgECL) or stimulated with P&I for 4 hours. (D) The sorted cells were stimulated with P&I overnight. IL-4, IL-6, and IL-13 proteins were measured by ELISA (mean ± SD, triplicates). Data represent two independent experiments with similar results.
Figure 3
Figure 3. pre-BMP Populations Contain Highly Enriched Common Basophil-Mast Cells Progenitors
(A) FcεR1α+ GMPs, FcεR1α GMPs, and BaPs FACS-sorted from BM cells, BMCPs FACS-sorted from the spleen, and whole BM cells were cultured under the indicated conditions for 5 days. Basophils and mast cells sorted from FcεR1α+ GMPs cultured in IL-3 were stained by May-Grunwald Giemsa (40x). (B) Single colony-forming-FcεR1α+ GMP-derived colonies were analyzed by FACS. (C) Colony composition. Each type of colony was calculated as the percentage of total colonies analyzed. (D) FACS analysis of CD45.2+ basophils in the BM of pre-BMP-reconstituted CD45.1 recipient mice (mean ± SD, n = 3). (E) FACS analysis of mast cells from the peritoneal cavity of reconstituted Kitw–sh/w–sh mice (mean ± SD, n = 3). (F) Toluidine blue staining of spleen sections from reconstituted Kitw–sh/w–sh mice (40x, insert, 100x). Mast cells are indicated by red arrows. The right panel shows the average number of mast cells in five different fields (40x) randomly selected from the sections of spleens (mean ± SD, n = 3). (G-K) FACS analysis of pre-BMPs, BaPs, basophils, and MCPs in the bone marrow or BMCPs in the spleen (J) of mice uninfected (UI) or infected (IN) withS. mansoni for 7 weeks (left), and the total number of cells in two femur bones per mouse or in the spleen (right). Data represent the mean ± SD (n=5). (L) Mast cells in the large intestine of uninfected or infected mice were stained with toluidine blue (left, 40x, insert, 100x) and shows the average number of mast cells in five different fields randomly selected from the sections of large intestine (mean ± SD, n=3). Data represent three independent experiments with similar results. Also see Figure S2.
Figure 4
Figure 4. STAT5 Is Imperative for the Differentiation of pre-BMPs into Both Basophils and Mast Cells
(A) Stat5a/b mRNA expression in GMPs (FcεR1α GMPs), pre-BMPs and basophils was measured by qPCR (mean ± SD, triplicates). Data represent two independent experiments. (B) YFP+ pre-BMPs were FACS sorted from bone marrow cells of poly IC-treated mice and cultured in methylcellulose containing medium in the presence of IL-3 for 9 days. (C) YFP+ pre-BMPs were FACS sorted from poly I-C-treated mice and stimulated with P&I for 4 hours. mRNA was measured by qPCR (mean ± SD, triplicates). Data represent two (B) or three (C) independent experiments with similar results. Also see Figure S3.
Figure 5
Figure 5. C/EBPα Is Required for the Differentiation of pre-BMPs into Basophils and Is Necessary for Maintaining Basophil Identity
(A) Cebpa mRNA expression (mean ± SD, triplicates). (B) Cebpa and Stat5a/b mRNA expression in YFP+pre-BMPs of poly I-C-treated mice as indicated (mean ± SD, triplicates). (C) Constitutively active Stat5 (cS5F) activated Cebpa promoter luciferase activity (mean ± SD, triplicates). (D) pre-BMPs in the bone marrow of the tamoxifen-treated mice were analyzed by FACS two weeks later after the treatment. YFP+ cells are shown. (E-G) pre-BMPs, BaPs, and basophils were FACS sorted from the untreated mice (Cebpaf/f= Cebpaf/f/RosaYFP/creER mice) and cultured in methylcellulose containing medium with or without the addition of 4HT for 9 days or complete medium in the presence of IL-3 with or without the addition of 4HT for 5 days (G). YFP+ cells are shown for 4HT-treated groups. (H) ChIP analysis of C/EBPα binding to the Il4 promoter in basophils (Ba) and mast cells (MC). (I) MACS sorted basophils were treated with or without 4HT for 5 days. ELISA analysis of IL-4 and IL-13 is shown (mean ± SD, triplicates). Data represent two (E, H, I) or three (A-D, F-G) independent experiments. Also see Figure S4.
Figure 6
Figure 6. C/EBPα Promotes Basophil Molecular Programming and Simultaneously Represses Mast Cell Molecular Programming
(A) Genome-wide gene expression profiling was performed on basophils and mast cells using microarray. Five groups of genes are shown in the Venn diagram. (B) The representative genes in each of five groups are shown in the heat map. (C) Numbers and percentages of genes in each group that were C/EBPα–dependent (indicated by arrow) or C/EBPα–repressed (indicated by bar). (D) The representative genes that were C/EBPα dependent (the log2 +4HT/−4HT ratio < −1) or C/EBPα repressed (the log2 +4HT/−4HT ratio > 1). (E) C/EBPα-binding sites and ChIP analysis of C/EBPα binding to the Mitf promoter (mean ± SD, triplicates). (F) C/EBPα suppressed Mitf promoter luciferase activity (mean ± SD, triplicates). (G) Re-expression of Mitf mRNA in Cebpaf/f or Cebpa+/+basophils treated with or without 4HT for 5 days (mean ± SD, triplicates). The right panel indicates a complete deletion of the Cebpa gene by 4HT treatment. (H) Purified BaPs were infected with GFP, C/EBPα or MITF virus and analyzed 5 days after infection. GFP+ cells are shown. Data (E-H) represent two independent experiments. Also see Figure S5 and Table S1.
Figure 7
Figure 7. MITF Directs the Differentiation of pre-BMPs into Mast Cells and Is Required for Repressing Basophil Programming
(A) The sorted YFP+ GMPs from poly I-C treated mice were cultured for 2 or 3 days in the presence of IL-3. Mitf and Stat5a/b mRNA were measured by qPCR (mean ± SD, triplicates). (B) pre-BMPs were infected with GFP or MITF virus. Cells were analyzed 5 days after infection. GFP+ cells are shown. (C) BM cells from Mitf wh/wh and C57BL/6 mice were cultured in complete IDMEM in the presence of IL-3 for 28 days. (D) WT and Mitf wh/wh BMMCs were stimulated with P&I for 4 hours. Il4, Il6 and Il13 mRNA was measured by qPCR (mean ± SD, triplicates). (E) mRNA expression of Cebpa and a set of basophil and mast cell genes in the cultured BMMC were analyzed by qPCR (mean ± SD, triplicates). The numbers indicate fold of difference in mRNA expression between WT and Mitfwh/wh mast cells. (F) qPCR measurements of mRNA expression in Mitfwh/wh BMMC transfected with Cebpa siRNA (mean ± SD, triplicates). (G) MITF-binding sites and ChIP analysis of MITF binding to the Cebpa promoter (mean ± SD, triplicates). (H) MITF suppressed Cebpa promoter luciferase activity (mean ± SD, triplicates). Data represent two independent results. Also see Figure S6 and S7.

References

    1. Arinobu Y, Iwasaki H, Akashi K. Origin of basophils and mast cells. Allergol Int. 2009;58:21–28. - PubMed
    1. Arinobu Y, Iwasaki H, Gurish MF, Mizuno S, Shigematsu H, Ozawa H, Tenen DG, Austen KF, Akashi K. Developmental checkpoints of the basophil/mast cell lineages in adult murine hematopoiesis. Proc Natl Acad Sci U S A. 2005;102:18105–18110. - PMC - PubMed
    1. Brickshawana A, Shapiro VS, Kita H, Pease LR. Lineage Sca1+c-Kit CD25+ Cells Are IL-33–Responsive Type 2 Innate Cells in the Mouse Bone Marrow. The Journal of Immunology. 2011;187:5795–5804. - PMC - PubMed
    1. Busse WW, Morgan WJ, Gergen PJ, Mitchell HE, Gern JE, Liu AH, Gruchalla RS, Kattan M, Teach SJ, Pongracic JA, et al. Randomized trial of omalizumab (anti-IgE) for asthma in inner-city children. N Engl J Med. 2011;364:1005–1015. - PMC - PubMed
    1. Chen CC, Grimbaldeston MA, Tsai M, Weissman IL, Galli SJ. Identification of mast cell progenitors in adult mice. Proc Natl Acad Sci U S A. 2005;102:11408–11413. - PMC - PubMed

Publication types

MeSH terms

Substances

Associated data