. 2013 Aug 7;79(3):504-15.
doi: 10.1016/j.neuron.2013.06.019. Epub 2013 Jul 18.

TMC1 and TMC2 are components of the mechanotransduction channel in hair cells of the mammalian inner ear

Affiliations

TMC1 and TMC2 are components of the mechanotransduction channel in hair cells of the mammalian inner ear

Bifeng Pan et al. Neuron. .

Abstract

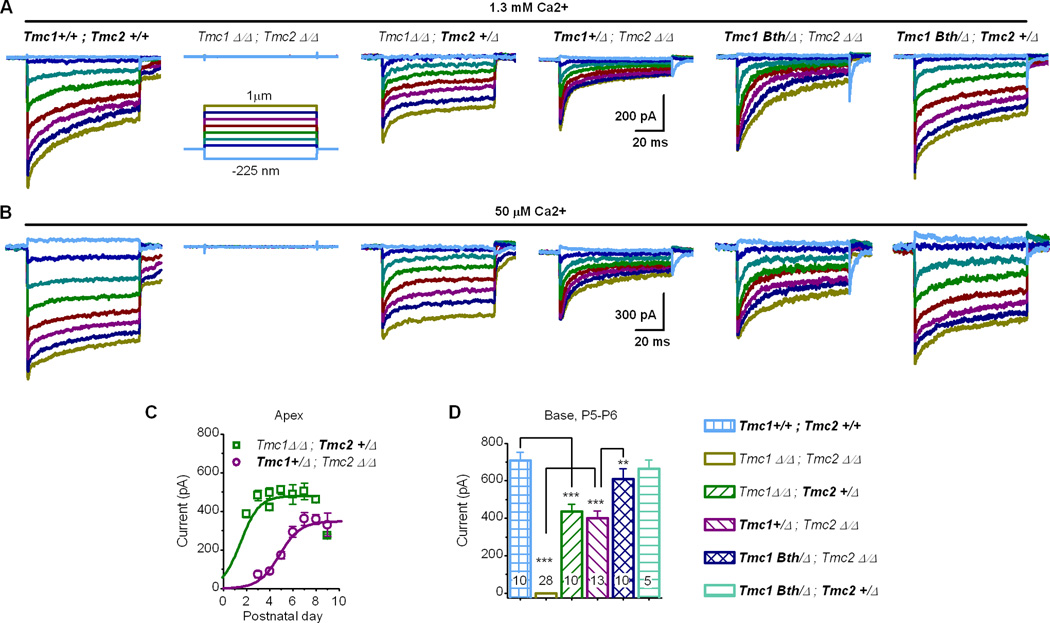
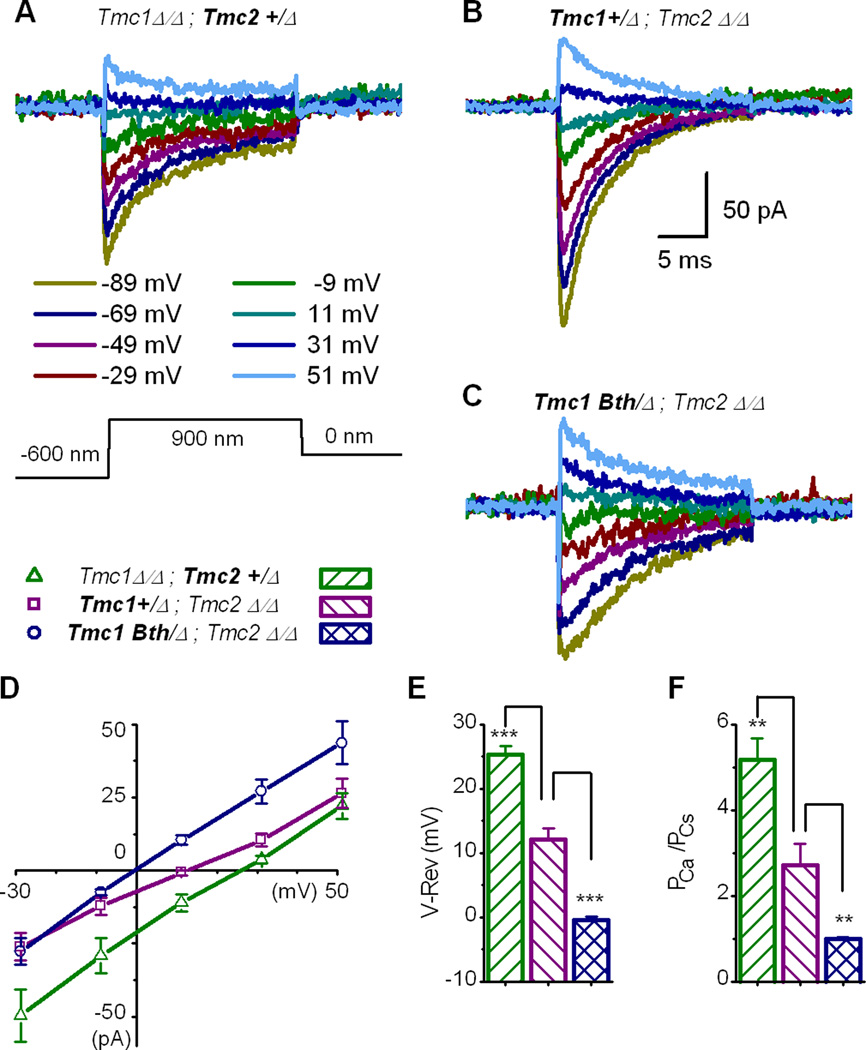
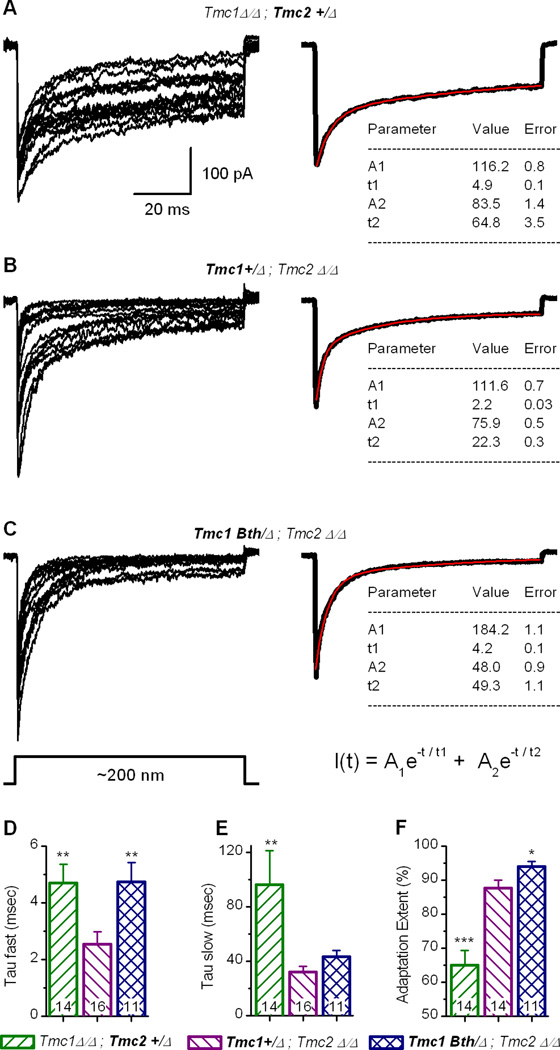
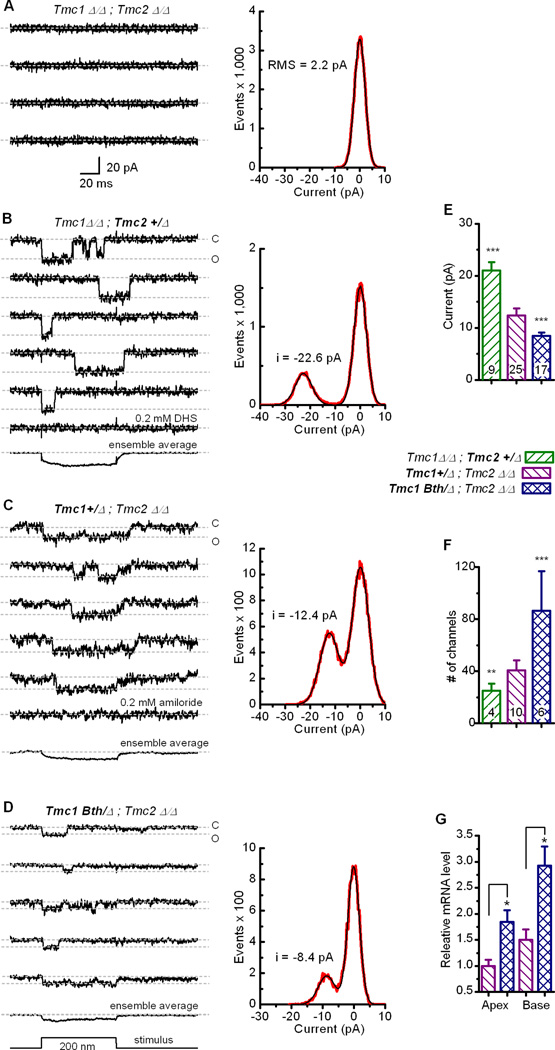
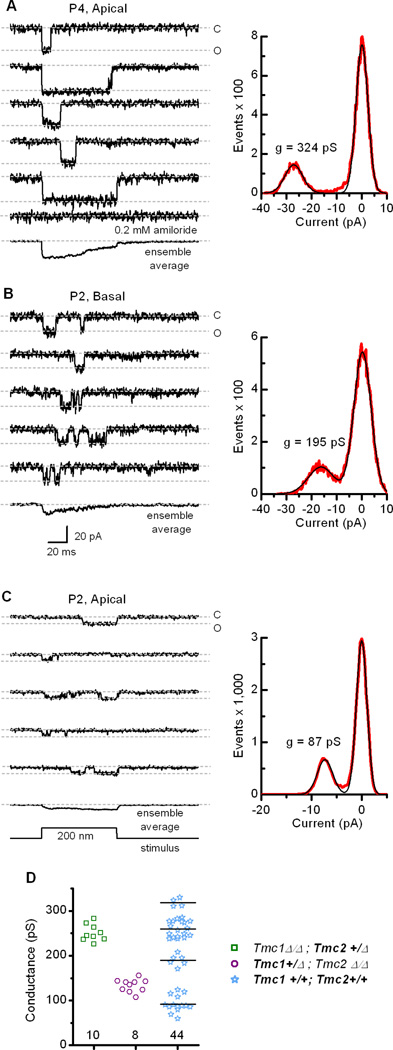
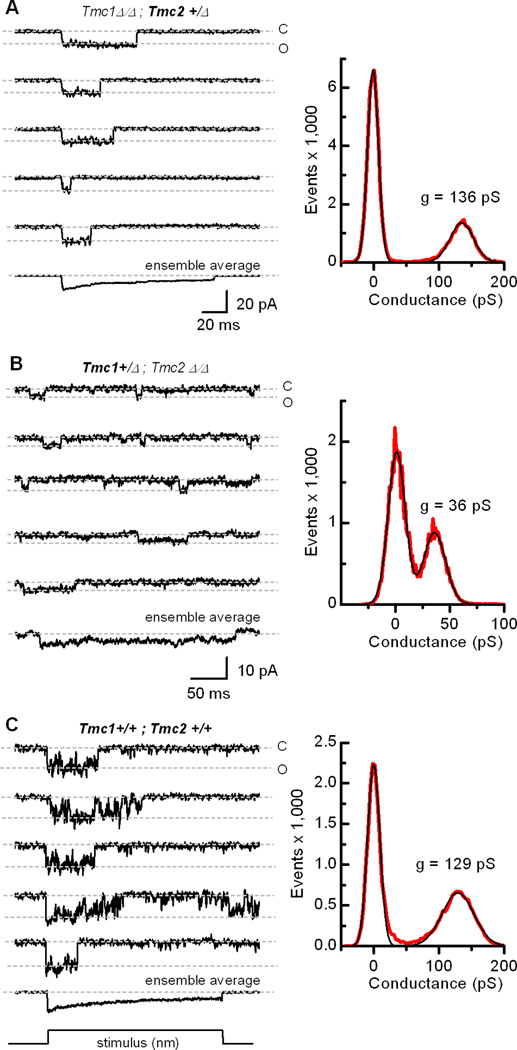
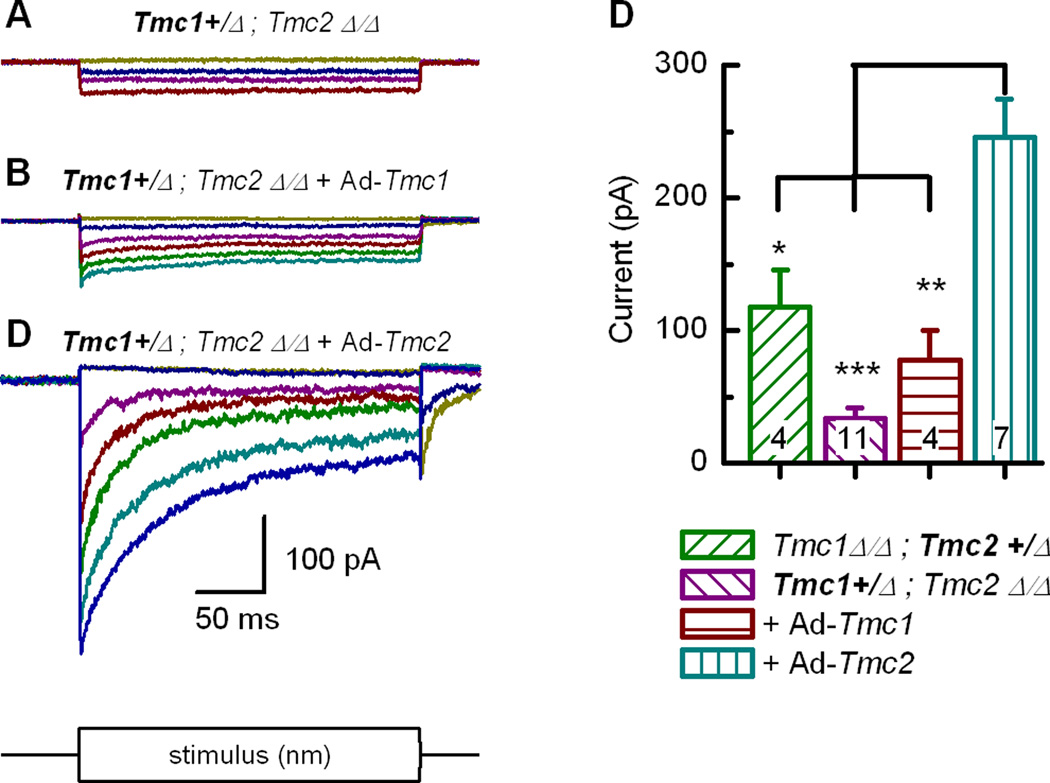
Sensory transduction in auditory and vestibular hair cells requires expression of transmembrane channel-like (Tmc) 1 and 2 genes, but the function of these genes is unknown. To investigate the hypothesis that TMC1 and TMC2 proteins are components of the mechanosensitive ion channels that convert mechanical information into electrical signals, we recorded whole-cell and single-channel currents from mouse hair cells that expressed Tmc1, Tmc2, or mutant Tmc1. Cells that expressed Tmc2 had high calcium permeability and large single-channel currents, while cells with mutant Tmc1 had reduced calcium permeability and reduced single-channel currents. Cells that expressed Tmc1 and Tmc2 had a broad range of single-channel currents, suggesting multiple heteromeric assemblies of TMC subunits. The data demonstrate TMC1 and TMC2 are components of hair cell transduction channels and contribute to permeation properties. Gradients in TMC channel composition may also contribute to variation in sensory transduction along the tonotopic axis of the mammalian cochlea.


Conflict of interest statement

COMPETING FINANCIAL INTERESTS

We disclose the following potential conflicts: Drs. Kurima and Griffith hold U.S. Patents: 7,166,433 (Transductin-2 and Applications to Hereditary Deafness; abandoned in 2009), 7,192,705 (Transductin-1 and Applications to Hereditary Deafness) and 7,659,115 (Nucleic Acid Encoding Human Transductin-1 Polypeptide). These patents have never been licensed and generate no income or royalties. There are no other conflicts.

Figures

Figure 1
Figure 1
Mechanotransduction currents recorded from cochlear inner hair cells. (A) Representative families of currents recorded at −84 mV from cells of the genotypes indicated above. Cells were from the apical end of P5-P6 cochleas bathed in 1.3 mM Ca2+. The scale bar and stimulus protocol apply to all current families. (B) Data from the same cells shown in panel A bathed in 50 µM Ca2+, a concentration similar to that of endogenous endolymph. (C) Maximal transduction current amplitudes (± 1 s.e.) plotted as a function of postnatal age for apical inner hair cells from Tmc1Δ/Δ;Tmc2+/Δ (n=60, ~7/day) and Tmc1+/Δ;Tmc2Δ/Δ (n=48, ~8/day) mice. Data were recorded in 1.3 mM Ca2+ at −84 mV and were fitted with smooth curves. (D) Maximal transduction currents (+1 s.e.) recorded from basal inner hair cells (P5-P6, 1.3 mM Ca2+, −84 mV).
Figure 2
Figure 2
Whole-cell mechanotransduction current-voltage relationships measured in 100 mM calcium. (A–C) Representative families of currents recorded from inner hair cells of the genotypes indicated above at the step potentials indicated below panel A. A mechanical stimulus (protocol shown at the bottom of panel A) that evoked hair bundle deflections from −0.6 µm to 0.9 µm was superimposed on the voltage steps. The scale bar in panel B applies to panels A-C. (D) Current-voltage relations taken from the peak transduction currents shown in panel A-C for eight cells of each genotype. (E) Mean (+ 1 s.e.) reversal potentials measured from the x-intercept of individual I-V curves generated from eight cells of each genotype. (F) Mean (+ 1 s.e.) calcium permeability ratios relative to cesium calculated using the Goldman-Hodgkin-Katz equation and the reversal potentials shown in panel E.
Figure 3
Figure 3
Analysis of transducer adaptation in Tmc mutant mice recorded in 50 µM Ca2+. (A–C) Whole-cell mechanotransduction currents (left) recorded from inner hair cells of Tmc1Δ/Δ;Tmc2+/Δ(n = 14 cells), Tmc1+/Δ;Tmc2Δ/Δ(n = 16 cells) and Tmc1Bth/Δ;Tmc2Δ/Δ(n = 11 cells) mice as indicated above. The scale bar applies to all panels. Traces were selected as the 50% maximal current from families evoked by mechanical stimuli that spanned the sensitive range for each cell. Each trace was fitted with a double exponential equation (bottom right) that yielded fast (t1) and slow (t2) time constants. The extent of adaptation was calculated as the residual current at the end of the step divided by the peak current. All traces shown on the left were averaged to generate the composite traces on the right (black line) and were fitted with the double exponential equation. The fit parameters are shown below each trace. (D) Mean (+1 s.e.) fast adaptation time constants measured in 50 µM Ca2+ for the individual current traces shown in panels A-C. (E) Mean (+1 s.e.) slow adaptation time constants. (F) Mean (+1 s.e.) extent of adaptation measured as the residual current at the end of a 90-msec step divided by the peak current. Number of cells is shown at the bottom. Statistical significance relative to Tmc1+/Δ;Tmc2Δ/Δis indicated: ***P<0.001, **P<0.01, *P<0.05.
Figure 4
Figure 4
Single-channel events recorded from inner hair cells of Tmc mutant mice. (A) To evaluate the recording paradigm, the noise floor was measured at −84 mV from a P4 basal IHC excised from a Tmc1Δ/Δ;Tmc2Δ/Δ mouse. Four representative traces are shown. Dashed lines indicate the zero current level. The stimulus protocol is shown at the bottom. The scale bar applies all current traces. Each trace was used to generate an event histogram (right, red trace). The data were fitted with a Gaussian equation which had a peak at 0.07 pA and a width of 4.3 pA (black). (B) Single-channel currents recorded in 50 µM Ca2+ from a P2 Tmc1Δ/Δ;Tmc2+/Δbasal inner hair cell. Rapid current steps were frequently noted. Open and closed states are indicated at the right of the first of five representative traces. Application of 0.2 mM dihydrostreptomycin (DHS) eliminated all single-channel events (bottom). The ensemble average of 43 traces containing step transitions show the responses were linked to the mechanical stimulus. The event histogram (right, red trace) was fitted with the sum of two Gaussian curves (black trace) that had peaks at −0.02 pA and −22.6 pA with widths of 5.0 and 6.7 pA, respectively. (C) Five representative traces recorded in 50 µM Ca2+ from a basal, P4 Tmc1+/Δ;Tmc2Δ/Δ inner hair cell. 0.2-mM amiloride, an alternate transduction channel blocker (Rüsch et al., 1994), eliminated all single-channel events (bottom). An ensemble average of 50 traces is shown below. The event histogram (right) was fitted with the sum of two Gaussians with peaks of 0.1 and −12.3 pA and widths of 6.6 and 7.6 pA, respectively. (D) Representative traces recorded in 50 µM Ca2+ from a P5 basal hair cell excised from a Tmc1Bth;Tmc2Δ/Δ mouse. An ensemble average of 22 traces and the stimulus protocol are shown at the bottom. Gaussian fits to the event histogram had peaks at −0.2 and −8.6 pA with widths of 3.7 and 5.9 pA. (E) Mean (+1 s.d.) single-channel currents recorded from 51 inner hair cells from all regions of the cochlea and developmental stages between P0 and P9 (n = 19 mice). The stars (***) indicate highly significant differences relative to Tmc1+/Δ;Tmc2Δ/Δ cells: p<1e−10. (F) Whole-bundle currents recorded in 50 µM Ca2+ were divided by the mean single-channel currents shown in panel E to yield an estimate of the number of transduction channels for 20 cells. Mean (+ 1 s.d.) number of channels for each genotype is indicated, revealing significantly more functional channels in the Tmc1Bth;Tmc2Δ/Δ hair cells. ***P<0.001, **P<0.01. (G) Representative quantitative RT-PCR data for Tmc1 selected from three biological replicates each of which yielded similar results. Messenger RNA was harvested from the apical and basal portions of P5 mouse cochleas excised from Tmc1+/Δ;Tmc2Δ/Δ and Tmc1Bth;Tmc2Δ/Δ mice. Data were normalized relative to Actb and Tmc1 levels from the apical Tmc1+/Δ;Tmc2Δ/Δ sample using the ΔΔCt method. The means of three technical replicates (+1 s.d.) are shown. *P<0.05.
Figure 5
Figure 5
Single-channel events recorded from wild-type inner hair cells. (A) Five representative traces recorded from a wild-type P4 apical hair cell that illustrate a mechanotransduction channel at the upper end of the single-channel conductance range. The currents were blocked by 0.2 mM amiloride (bottom). An ensemble average of 24 traces is shown below. The event histogram (right, red trace) was fitted with two Gaussian functions (black trace) with peaks at 0 and −27.2 pA and widths of 4.8 and 7.1 pA. Single-channel conductance was calculated as current/driving force, the latter equal to the difference between the holding potential (−84 mV) and the reversal potential (0 mV in 50 µM Ca2+; from Figure S3). (B) Representative traces recorded from a wild-type basal hair cell at P2. The single-channel current amplitude was in the middle range of 44 channels examined. An ensemble average of 44 traces is shown at the bottom. The event histogram (right) was fitted with two Gaussians with peaks at 0.2 and −16.2 pA and widths of 6.9 and 10.4 pA. The scale bar at the bottom applies to all current traces. (C) Traces recorded from a wild-type apical hair cell at P2 that represent the lower end of the single-channel conductance range. An ensemble average of 35 traces is shown at the bottom. The histogram (right) was fitted with two Gaussians with peaks of 0 and −7.3 pA and widths of 2.1 and 3.1, respectively. (D) Scatter plot of single-channel conductance for Tmc1Δ/Δ;Tmc2+/ΔTmc1+/Δ;Tmc2Δ/Δ and wild-type transduction channels recorded from inner hair cells during the first postnatal week. Note the wild-type values cluster in four discrete groups. The mean for each group is indicated by the horizontal line. Number of measurements for each genotype is indicated below.
Figure 6
Figure 6
Transduction currents recorded from vestibular type II hair cells of wild-type and Tmc mutant mice. (A) Representative single-channel events recorded from a utricle type II hair cell acutely excised from a Tmc1Δ/Δ;Tmc2+/Δmouse at P7. An ensemble average of 31 traces is shown at the bottom. To estimate single-channel conductance, an event histogram (right, red trace) was generated and the current values were divided by driving force (−94 mV). The Gaussian curves (black line) had peaks at 0 and 136 pS and widths of 16.7 and 36.5 pS. The scale bar applies to all traces. (B) Single-channel events recorded from a utricle type II hair cell acutely excised from a Tmc1+/Δ;Tmc2Δ/Δmouse at P4. An ensemble average of 22 traces is shown at the bottom. Single-channel currents were divided by driving force (−94 mV) and plotted in an event histogram (right, red trace). The data were fitted with two Gaussian curves (black lines) that had peaks at 0 and 36 pS and widths of 15.7 and 20.4 pS. The scale bar applies to all traces in panel B and C. (C) Currents recorded from a wild-type utricle type II cell at P0. Ensemble average = 60 traces. Single-channel currents were divided by driving force (−84 mV) and plotted in the histogram (right, red trace). Gaussian curves (black line) had peaks at 0 and 129 pS and widths of 18.7 and 49 pS.
Figure 7
Figure 7
Whole-cell mechanotransduction currents recorded at −64 mV from control type II hair cells and cells exposed to adenoviral vectors. (A–C) Families of whole-cell currents recorded from Tmc1+/Δ;Tmc2Δ/Δvestibular hair cells under control conditions (A) or following exposure to Ad-Tmc1 and 5 days in culture (B) or exposure to Ad-Tmc2 and 4 days in culture (C). The scale bar at the bottom applies to all current families. (D) Bar graph summarizing the mean maximal whole-cell transduction currents for the conditions indicated below. Number of cells is shown for each bar. Statistical significance relative to the condition on the right is indicated according to ***P<0.001, **P<0.01, *P<0.05.

Comment in

References

    1. Amalfitano A, Hauser MA, Hu H, Serra D, Begy CR, Chamberlain JS. Production and characterization of improved adenovirus vectors with the E1, E2b, and E3 genes deleted. J. Virol. 1998;72:926–933. - PMC - PubMed
    1. Arnadóttir J, Chalfie M. Eukaryotic mechanosensitive channels. Annu. Rev. Biophys. 2010;39:111–137. - PubMed
    1. Assad JA, Corey DP. An active motor model for adaptation by vertebrate hair cells. J. Neurosci. 1992;12:3291–3309. - PMC - PubMed
    1. Beurg M, Evans MG, Hackney CM, Fettiplace R. A large-conductance calcium-selective mechanotransducer channel in mammalian cochlear hair cells. J. Neurosci. 2006;26:10992–11000. - PMC - PubMed
    1. Chatzigeorgiou M, Bang S, Hwang SW, Schafer WR. tmc-1 encodes a sodium-sensitive channel required for salt chemosensation in C elegans. Nature. 2013;494:95–99. - PMC - PubMed

Publication types

MeSH terms