. 2013 Aug 5;23(15):1489-96.
doi: 10.1016/j.cub.2013.06.032. Epub 2013 Jul 18.

Cell-to-cell heterogeneity in lipid droplets suggests a mechanism to reduce lipotoxicity

Affiliations

Cell-to-cell heterogeneity in lipid droplets suggests a mechanism to reduce lipotoxicity

Albert Herms et al. Curr Biol. .

Abstract

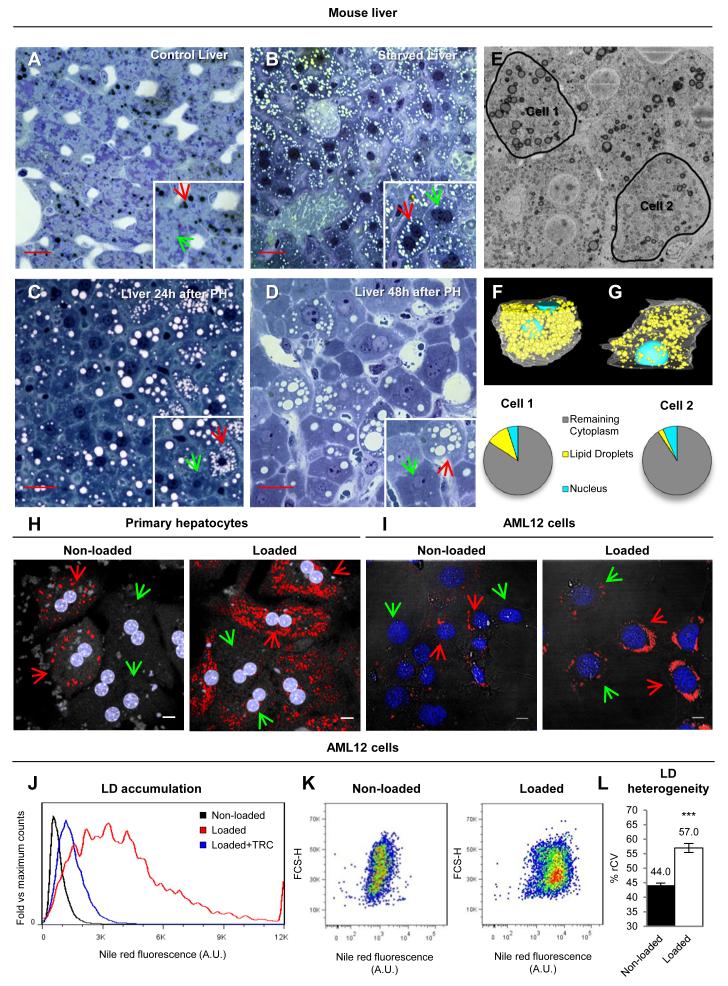
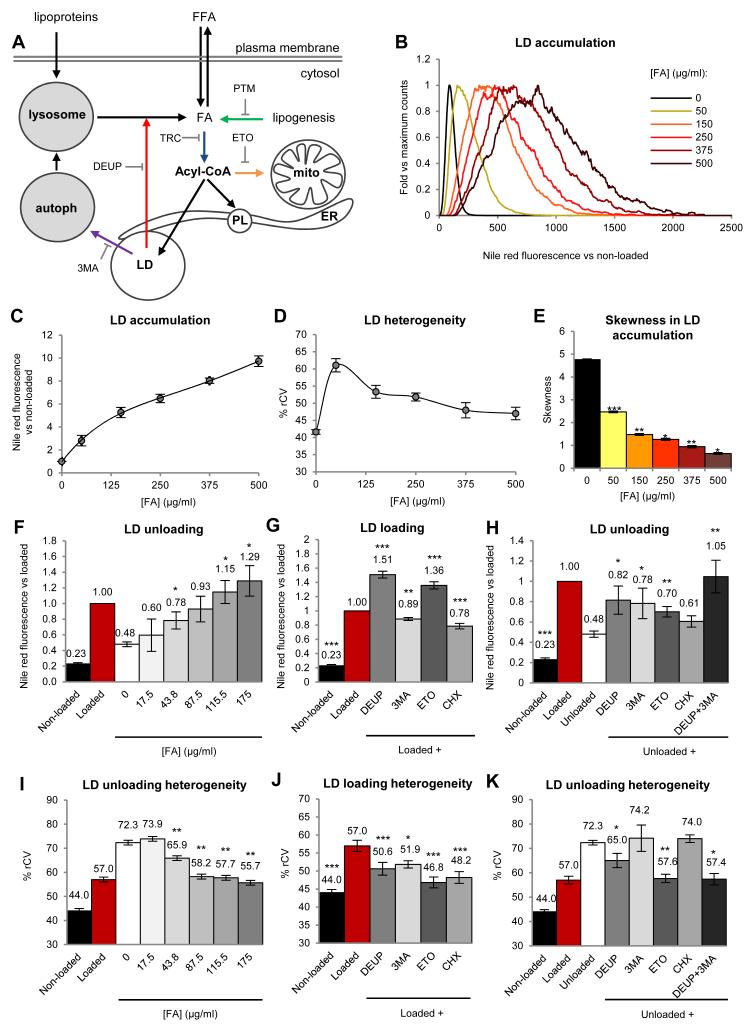
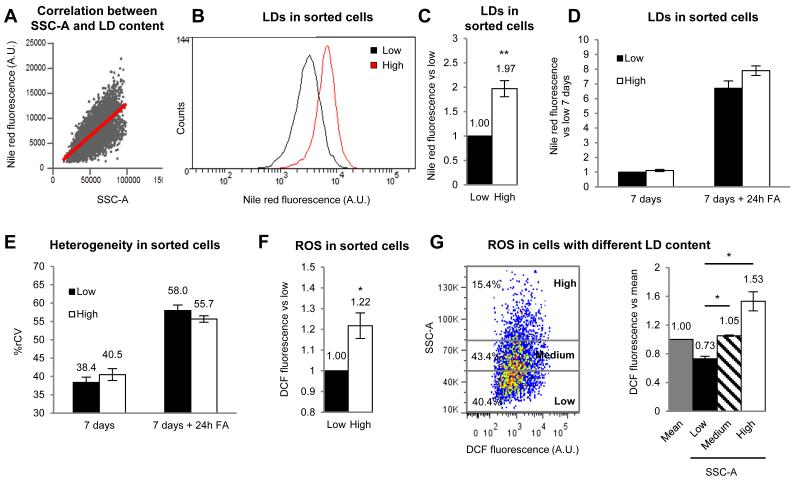
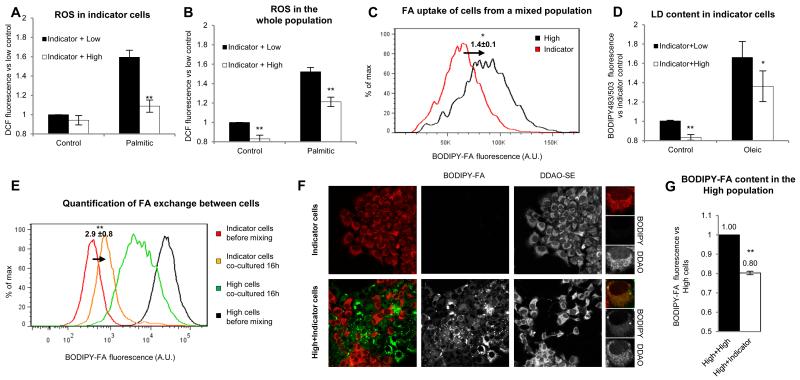
Lipid droplets (LDs) are dynamic organelles that collect, store, and supply lipids [1]. LDs have a central role in the exchange of lipids occurring between the cell and the environment and provide cells with substrates for energy metabolism, membrane synthesis, and production of lipid-derived molecules such as lipoproteins or hormones. However, lipid-derived metabolites also cause progressive lipotoxicity [2], accumulation of reactive oxygen species (ROS), endoplasmic reticulum stress, mitochondrial malfunctioning, and cell death [2]. Intracellular accumulation of LDs is a hallmark of prevalent human diseases, including obesity, steatosis, diabetes, myopathies, and arteriosclerosis [3]. Indeed, nonalcoholic fatty liver disease is the most common cause of abnormal hepatic function among adults [4, 5]. Lipotoxicity gradually promotes cellular ballooning and disarray, megamitochondria, accumulation of Mallory's hyaline in hepatocytes, and inflammation, fibrosis, and cirrhosis in the liver. Here, using confocal microscopy, serial-block-face scanning electron microscopy, and flow cytometry, we show that LD accumulation is heterogeneous within a cell population and follows a positive skewed distribution. Lipid availability and fluctuations in biochemical networks controlling lipolysis, fatty acid oxidation, and protein synthesis contribute to cell-to-cell heterogeneity. Critically, this reversible variability generates a subpopulation of cells that effectively collect and store lipids. This high-lipid subpopulation accumulates more LDs and more ROS and reduces the risk of lipotoxicity to the population without impairing overall lipid homeostasis, since high-lipid cells can supply stored lipids to the other cells. In conclusion, we demonstrate fat storage compartmentalization within a cell population and propose that this is a protective social organization to reduce lipotoxicity.


Figures

Figure 1
Figure 1. Hepatic LD heterogeneity
(A to D) Control (A), starved (B), and 24h (C) and 48h after partial hepatectomy (D) mice liver sections stained with methylene blue. LDs are the black (A) or white (B to D) rounded organelles. Red and green arrows indicate cells with high- or low-lipid content. Scale bars=50μm. (E to G) 3View microscopy of control mice liver. Representatives stack showing the two selected cells (black lines, E) and segmentation analysis of Cell 1 (F) or 2 (G). Translucent white lines = plasma membrane, light blue = nuclei, yellow = lipid droplets. (H and I) Primary hepatocytes (H) and AML12 cells (I) in standard media (left) or loaded for 24h with FAs (50 μg/ml for hepatocytes and 175μg/ml for AML12, right), stained with Nile red (LDs, red) and Hoechst (nucleus, blue). Red and green arrows indicate cells with high- or low-lipid content. Scale bars=10μm. (J to L). Representative histogram (linear scale, J) of Nile Red fluorescence of control cells (Non-loaded, black), cells loaded with FA (Loaded, red) or cells with FA and 10μM Triacsin C (Loaded+TRC, blue). (K) Representative dot plots (logarithmic scale) of Nile Red fluorescence versus forward scatter (FCS-H) in non-loaded (left) and loaded cells (right). (L) %rCV of Nile Red fluorescence of Non-loaded and Loaded cells. Data represent mean ± SEM in at least 10 independent experiments.
Figure 2
Figure 2. Causes of LD heterogeneity
(A) Biochemical networks (black) and interfering drugs (colour arrows) related to LD metabolism (PL, phospholipid; Mito, mitochondria; ER, endoplasmic reticulum; autoph, autophagosome). (B-E) Quantification of LD content and heterogeneity of AML12 cells treated 24h with the indicated doses of FAs. Representative histograms (linear scale, B), average LD accumulation compared to non-loaded cells (C), %rCV (D), and skewness coefficient (E) of the distributions. (F and I) FA loaded cells were incubated for additional 16h in a FA-free medium containing the indicated concentrations of FAs. LD accumulation (F) compared to loaded cells (red bar) and the %rCV (I) was calculated. Statistical significance was calculated versus unloaded control cells (white bars). (G and J) LD accumulation (G) and %rCV (J) of non-loaded cells and cells loaded with FA in the presence of 500μM DEUP, 10mM 3MA, 100μM etomoxir (ETO) or 10μg/ml cycloheximide (CHX). Statistical significance was calculated versus loaded cells (red bars). (H and K) LD accumulation (H) and %rCV (K) of non-loaded cells, loaded cells, and cells additionally unloaded 16h in a FA-free medium and the drugs detailed in G. Statistical significance was calculated versus unloaded cells (white bars). Data represent mean ± SEM in at least 3 independent experiments.
Figure 3
Figure 3. Cell sorting of high and low-lipid cells
(A) Correlation between Nile Red fluorescence and SSC-A in AML12 cells. (B and C) Representative histogram (B) and mean LD content (C) of high- and low-lipid cells sorted by SSC-A and stained with Nile Red. (D and E) LD accumulation (D) and %rCV (E) of cells sorted as in B and maintained 7 days in normal medium and additionally treated for 24h with 175μg/ml FA. (F) ROS in sorted cells measured as DCF fluorescence compared to low-lipid cells. (G) Representative dot plot of the SSC-A (LDs) versus DCF fluorescence (ROS) in the whole population of cells. Cells are classified (arbitrary cut-off) in low- (40.4% of the population), medium- (43.4%) or high-lipid cells (15.4%). Mean DCF fluorescence in each type of cells compared to mean of the population. Statistical significance was calculated versus low cells (black bars). Data represent the mean ± SEM of at least 4 independent experiments.
Figure 4
Figure 4. High-lipid cells are population advantage
(A-D) Non-loaded AML12 cells were stained with Cell Trace DDAO-SE (Indicator cells) and mixed for 16 h with non-loaded cells (Low, black bars) or cells loaded 24h with 500μg/ml of FA to generate high-lipid cells (High, white bars). ROS levels (as in 3F) in the indicator subpopulation (A) and the whole population (B) in cells treated 16h after mixing with control medium or supplemented with 50μg/ml of palmitic acid. Statistical significance was calculated versus the indicator mixed with the low population (black bars). (C) Representative histogram and mean FA uptake of indicator (red line) and high-lipid cells (black line) co-cultured 16h in control medium. Statistical significance was calculated versus indicator cells. (D) Analysis of LD content in indicator cells co-cultured with low-lipid (black bars) or high-lipid cells (white bars) incubated for 16h in control medium or in medium supplemented with 50μg/ml FA (oleic). Statistical significance was calculated versus the indicator mixed with the low population. (E-G) Indicator cells were co-cultured for 16h with high-lipid cells with a BODIPY-FA accumulated in LDs (High, see supplemental and Fig.S4). (E) Histogram of BODIPY-FA content analysed in high-lipid cells and indicator cells before mixing (black and red lines respectively) and after mixing (green and orange lines respectively). The mean fold increase ±SEM of BODIPY-FA in indicator cells is indicated. Statistical significance was calculated versus indicator cells before mixing (red line). (F) The BODIPY-FA in the indicator cells, before and after mixing as in E, was analysed by microscopy. (G) BODIPY-FA fluorescence in high-lipid cells (loaded as in E) was measured after 16h with indicator (white bar) or high-lipid cells (black bar). Statistical significance was calculated versus the high-lipid population. Data represent the mean ± SEM of at least 4 independent experiments.

Comment in

References

    1. Walther TC, Farese RV., Jr. Lipid droplets and cellular lipid metabolism. Annu Rev Biochem. 2012;81:687–714. - PMC - PubMed
    1. Brookheart RT, Michel CI, Schaffer JE. As a matter of fat. Cell Metab. 2009;10:9–12. - PMC - PubMed
    1. Greenberg AS, Coleman RA, Kraemer FB, McManaman JL, Obin MS, Puri V, Yan QW, Miyoshi H, Mashek DG. The role of lipid droplets in metabolic disease in rodents and humans. J Clin Invest. 2011;121:2102–2110. - PMC - PubMed
    1. Angulo P. Nonalcoholic fatty liver disease. N Engl J Med. 2002;346:1221–1231. - PubMed
    1. Cusi K. Role of obesity and lipotoxicity in the development of nonalcoholic steatohepatitis: pathophysiology and clinical implications. Gastroenterology. 2012;142:711–725. e716. - PubMed

Publication types