. 2013 Aug 12;24(2):229-41.
doi: 10.1016/j.ccr.2013.06.004. Epub 2013 Jul 18.

A core human primary tumor angiogenesis signature identifies the endothelial orphan receptor ELTD1 as a key regulator of angiogenesis

Affiliations

A core human primary tumor angiogenesis signature identifies the endothelial orphan receptor ELTD1 as a key regulator of angiogenesis

Massimo Masiero et al. Cancer Cell. .

Abstract

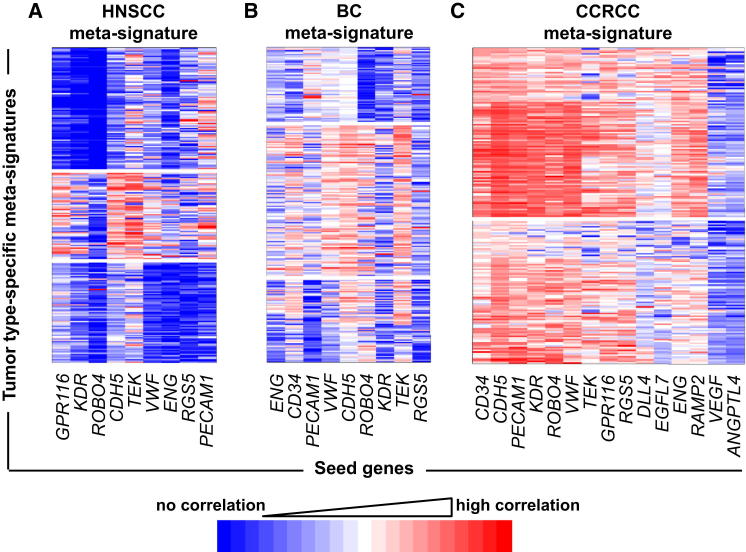
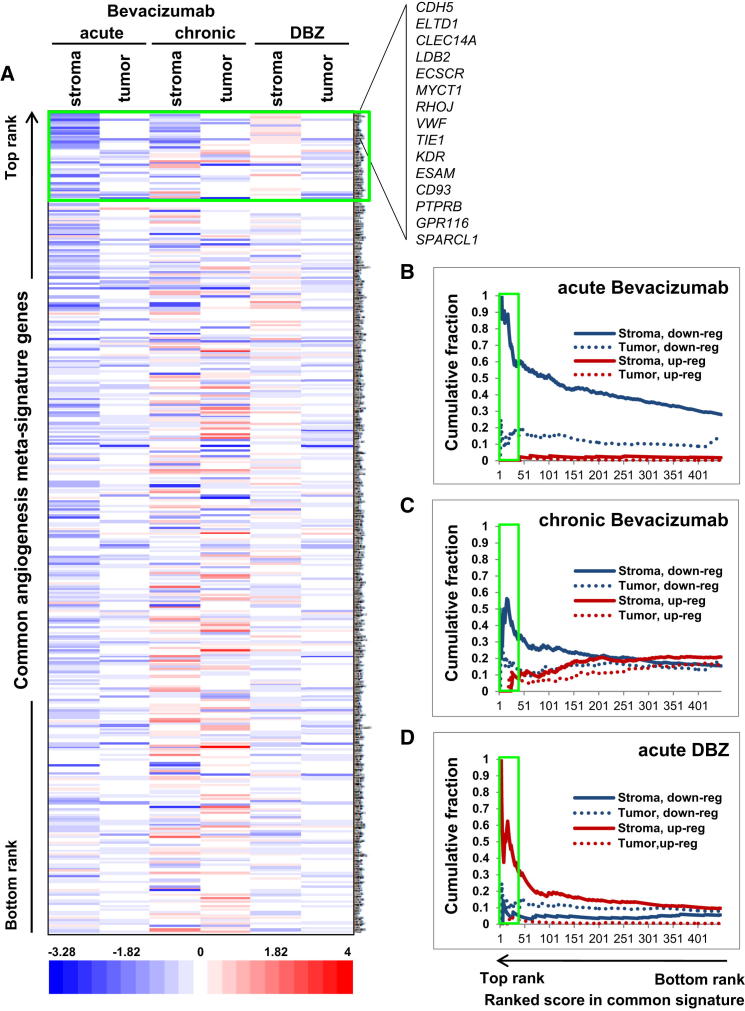
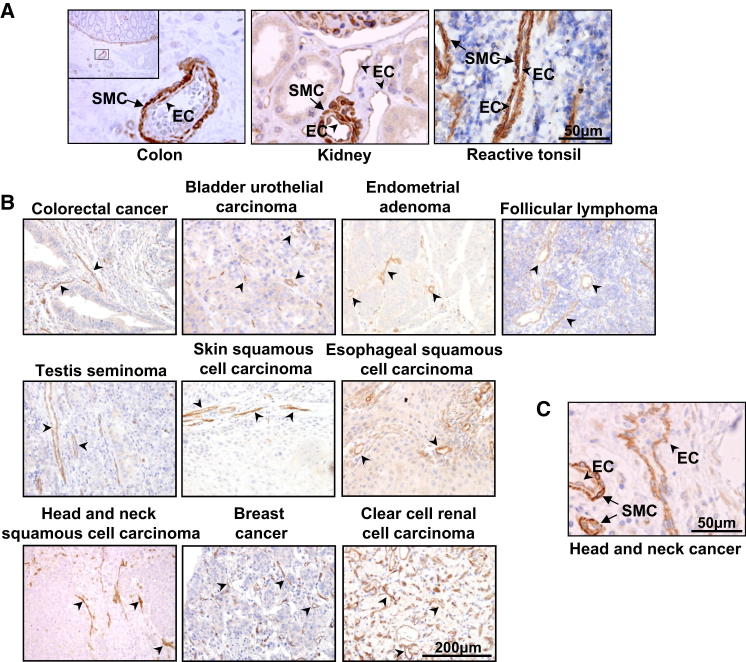
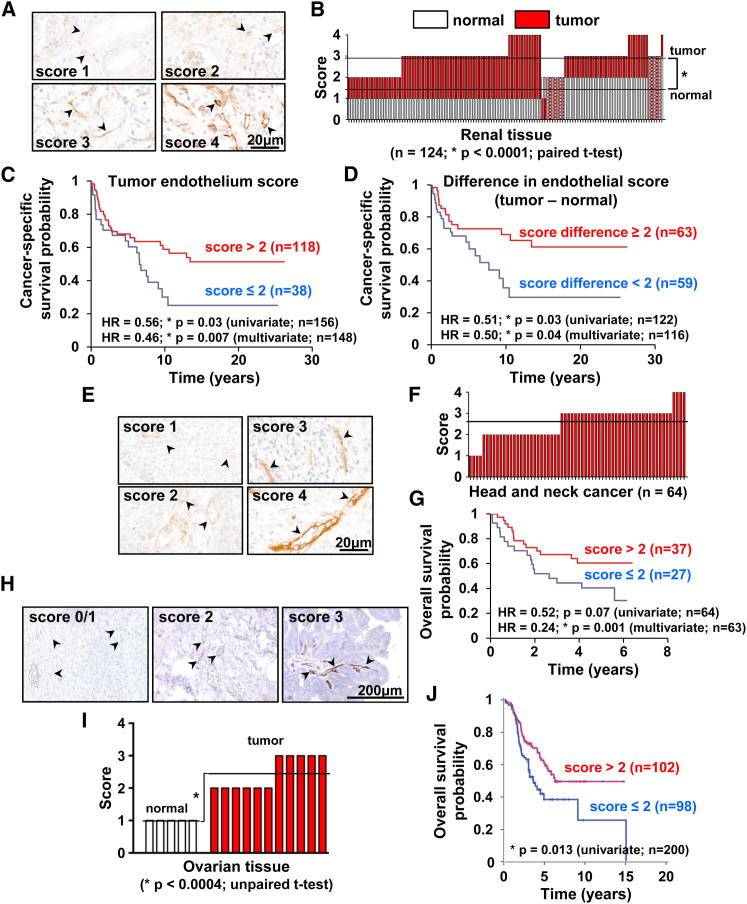
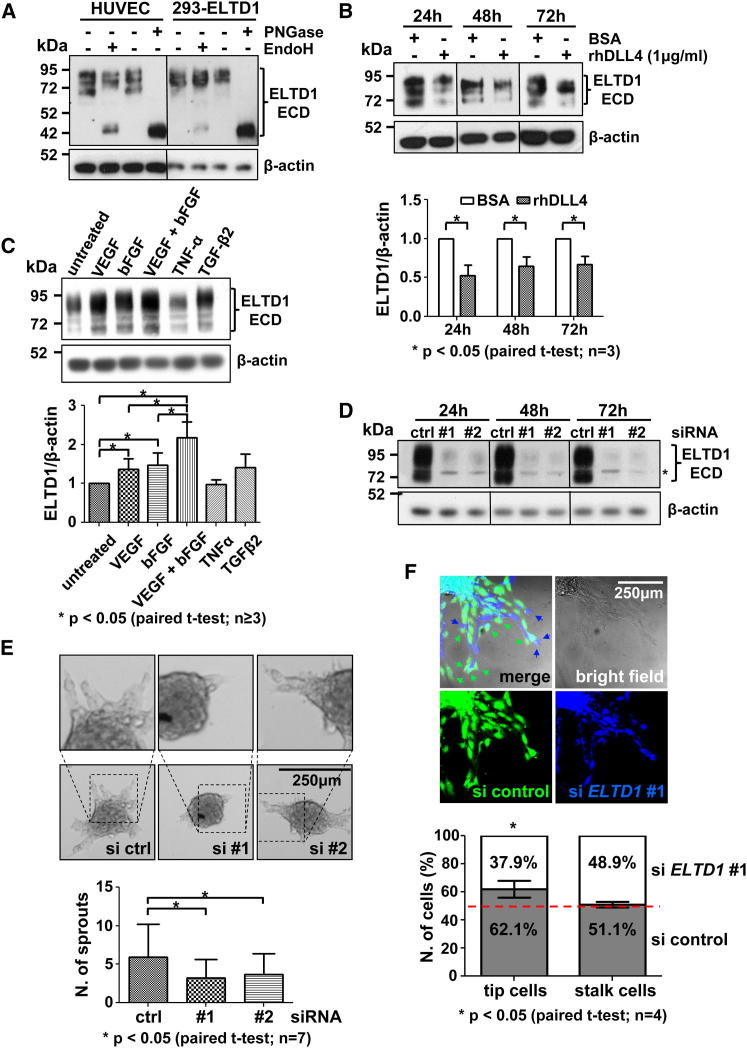
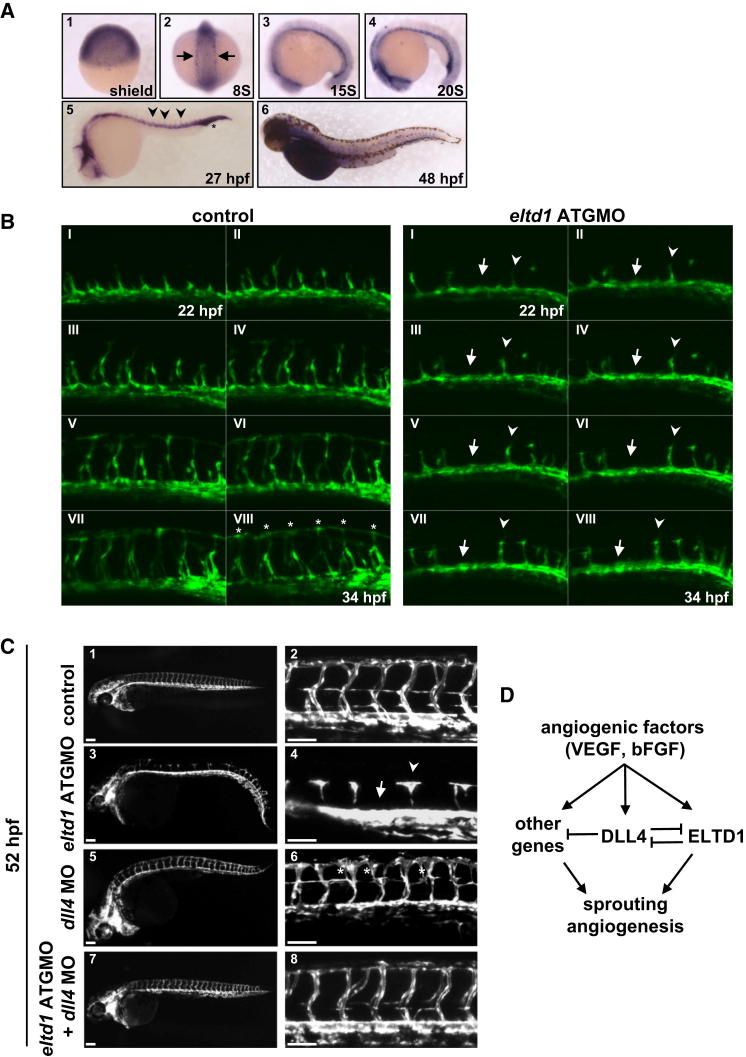
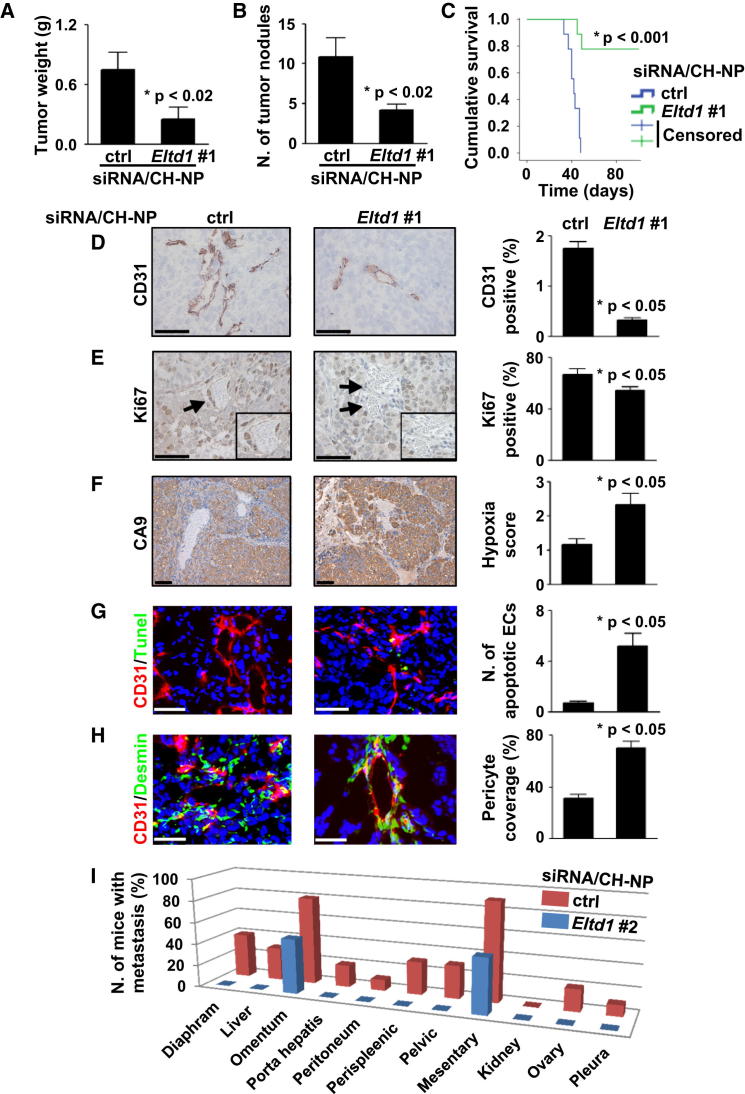
Limited clinical benefits derived from anti-VEGF therapy have driven the identification of new targets involved in tumor angiogenesis. Here, we report an integrative meta-analysis to define the transcriptional program underlying angiogenesis in human cancer. This approach identified ELTD1, an orphan G-protein-coupled receptor whose expression is induced by VEGF/bFGF and repressed by DLL4 signaling. Extensive analysis of multiple cancer types demonstrates significant upregulation of ELTD1 in tumor-associated endothelial cells, with a higher expression correlating with favorable prognosis. Importantly, ELTD1 silencing impairs endothelial sprouting and vessel formation in vitro and in vivo, drastically reducing tumor growth and greatly improving survival. Collectively, these results provide insight into the regulation of tumor angiogenesis and highlight ELTD1 as key player in blood vessel formation.


Figures

Figure 1
Figure 1
Derivation of Angiogenesis Metasignatures in Primary Human HNSCC, BC, and CCRCC Angiogenic profiles of 121 HNSCC (A), 959 BC (B), and 170 CCRCC samples (C). The x axis represents seeds from highly overlapping clusters (see Figure S1), and the y axis shows genes whose expression clusters with the seeds; coloring indicates strength of membership (see color scale). Clustering on correlating expression (membership; y axis) revealed the existence of three distinct gene clusters associated with different patient groups in HNSCC (A) and BC (B) and two clusters with a more compact profile in CCRCC (C). See also Table S1.
Figure 2
Figure 2
Modulation of the Common Overexpressed Angiogenesis Signature by Anti-VEGF and Anti-Notch Treatment In Vivo U87 xenografts comparing untreated tumors to bevacizumab- (acute and chronic) or DBZ-treated ones are shown. All overexpressed genes in the extended common signature are shown (the top 15 are listed). Green boxes indicate the core signature. (A) Expression fold changes between treatments (x axis) and control are shown (see color scale). Genes (y axis) are ranked from highest to lowest common score. (B–D) Cumulative plots show the fraction of downregulated and upregulated genes for each treatment, for both stroma and xenograft (tumor) expression. High values indicate a high fraction of downregulated or upregulated genes in the common signature after treatment. Genes are shown ranked from left to right. Plots are cumulative (that is, the fraction is calculated down to a given rank). See also Figure S2 and Table S4.
Figure 3
Figure 3
ELTD1 Vascular Expression in Primary Human Tissues (A) Pictures of normal tissues showing ELTD1 expression in ECs (arrowheads) and pericytes/SMCs (arrows). (B) IHC analysis of different primary human tumors invariably shows vascular/EC expression (arrowheads). (C) High-magnification picture showing ELTD1 expression by both ECs (arrowheads) and SMCs/pericytes (arrows) in a tumor sample. See also Figure S3.
Figure 4
Figure 4
Endothelial ELTD1 Expression in Cancer and Normal Matched Tissues and Its Prognostic Value (A) Representative IHC pictures of ELTD1 scoring in renal tissue (scores 1 and 2 are from normal kidney while 3 and 4 are from renal cancer). (B) ELTD1 expression in renal cancer and normal matched kidney. Each column represents a patient with red and white bars showing the score in tumor-associated and normal ECs, respectively. Horizontal lines represent score averages. (C and D) Significant correlation between cancer-specific survival and both tumor-associated EC ELTD1 expression (C) and the differential EC score (tumor minus normal) (D). (E) Representative IHC pictures of ELTD1 score categories in head and neck cancer. (F) Summary of ELTD1 expression. Each column represents a patient and the horizontal line represents the average. (G) Significant correlation between tumor-associated EC ELTD1 expression and overall survival. HR, hazard ratio. (H) Representative IHC pictures of ELTD1 score categories in human ovarian tissue (scores 0 and 1 are from normal ovary while scores 2 and 3 are from ovarian cancer). (I) Summary of EC ELTD1 expression in normal and neoplastic ovarian tissue shows upregulation in tumor samples. (J) Significant correlation between tumor-associated EC ELTD1 levels and overall survival. Arrowheads indicate blood vessels. See also Figure S4 and Tables S5–S7.
Figure 5
Figure 5
ELTD1 Expression, Regulation, and Function in Primary Human Endothelial Cells In Vitro (A) HUVEC- and ELTD1-overexpressing 293 cell lysates were treated with deglycosylating enzymes before western blotting (WB) analysis. Untreated samples show multiple bands that are lost after treatment with contemporary appearance of a lower MW band corresponding to the deglycosylated ECD. (B) WB analysis of DLL4-stimulated HUVECs shows ELTD1 downregulation at different time points (bars represent average ±SD of band densitometric analysis). (C) Similar analysis on HUVECs treated with different cytokines for 24 hr (bars represent average ±SD of band densitometric analysis). (D) WB validation of ELTD1 silencing with two different siRNAs. Nonspecific band appearing with long exposure. (E) HUVEC sprouting is reduced by ELTD1 silencing (bars represent mean ±SD). Representative spheroids are shown. (F) In vitro cell fate assay. Sprouting analysis from spheroids composed of a 1:1 ratio between prelabeled control and siELTD1 cells. ELTD1 silencing impairs the ability to take the tip cell position (arrows) without affecting stalk cell formation (graph shows the number of tip and stalk cells as the average percentage ±SD). See also Figure S5.
Figure 6
Figure 6
Eltd1 Expression and Function during Vascular Development in Zebrafish (A) Eltd1 in situ hybridization at different developmental stages shows expression in ECs and blood precursor cells (arrow) and developing vessels: DA, PCV, ISV (arrowheads), and vascular plexus (asterisk). (B) Time-lapse confocal microscopy of Tg(kdrl:GFP) uninjected and eltd1 morphants every 90 min. In eltd1 morphants, the formation of ISV sprouts is blocked (arrows) or severely reduced (arrowheads), never reaching the dorsal position observed in WT siblings (asterisks). (C) Lateral views of uninjected control (C1 and C2) and different morphants (C3–C8) 52hpf Tg(kdrl:GFP) embryos. Trunk vessels imaging revealed a failure to form ISV in eltd1 morphants (C3 and C4, arrow and arrowhead), which is rescued in eltd1+dll4 double morphants (C7 and C8). The dll4 morphant arterial hyperbranching phenotype (C5 and C6, asterisks) is also rescued in the eltd1+dll4 double morphants (C7 and C8). Scale bars: 100 μm. (D) Working hypothesis. See also Figure S6 and Movies S1 and S2.
Figure 7
Figure 7
Effects of Eltd1 Silencing on Tumor Growth and Angiogenesis in an Orthotopic Ovarian Cancer Model (A and B) Eltd1 siRNA/CH-NP treatment reduces tumor weight (A) and nodule number (B) in a SKOV3ip1 orthotopic mouse model. (C) Reduced tumor growth was associated with a strong improvement in mice survival. (D–H) Analysis of tumor tissue sections shows that Eltd1 silencing reduces MVD (D; CD31 IHC) and tumor tissue proliferation (E; Ki67 IHC) but also increases hypoxic areas (F; CA9 IHC), EC apoptosis (G; CD31/TUNEL immunofluorescence [IF]), and vascular pericyte coverage (H; CD31/desmin IF). Representative pictures are shown. Arrows indicate blood vessels within insets. Scale bars: 50 μm. (I) Drastic reduction in metastatic spread upon Eltd1 silencing was also observed. All graph bars represent average ±SEM (unpaired t test). See also Figure S7.

References

    1. Bais, C., Singh, M., Kaminker, J., and Brauer, M. May 2011. Biological markers for monitoring patient response to vegf antagonists. U.S. Patent 20,110,117,083.
    1. Baldewijns M.M., van Vlodrop I.J., Vermeulen P.B., Soetekouw P.M., van Engeland M., de Bruïne A.P. VHL and HIF signalling in renal cell carcinogenesis. J. Pathol. 2010;221:125–138. - PubMed
    1. Bjarnadóttir T.K., Fredriksson R., Höglund P.J., Gloriam D.E., Lagerström M.C., Schiöth H.B. The human and mouse repertoire of the adhesion family of G-protein-coupled receptors. Genomics. 2004;84:23–33. - PubMed
    1. Bubendorf L., Nocito A., Moch H., Sauter G. Tissue microarray (TMA) technology: miniaturized pathology archives for high-throughput in situ studies. J. Pathol. 2001;195:72–79. - PubMed
    1. Buffa F.M., Harris A.L., West C.M., Miller C.J. Large meta-analysis of multiple cancers reveals a common, compact and highly prognostic hypoxia metagene. Br. J. Cancer. 2010;102:428–435. - PMC - PubMed

Publication types

Substances

Associated data