. 2013 Aug 8;93(2):224-35.
doi: 10.1016/j.ajhg.2013.06.010. Epub 2013 Jul 18.

Imprinted chromatin around DIRAS3 regulates alternative splicing of GNG12-AS1, a long noncoding RNA

Affiliations

Imprinted chromatin around DIRAS3 regulates alternative splicing of GNG12-AS1, a long noncoding RNA

Malwina Niemczyk et al. Am J Hum Genet. .

Abstract

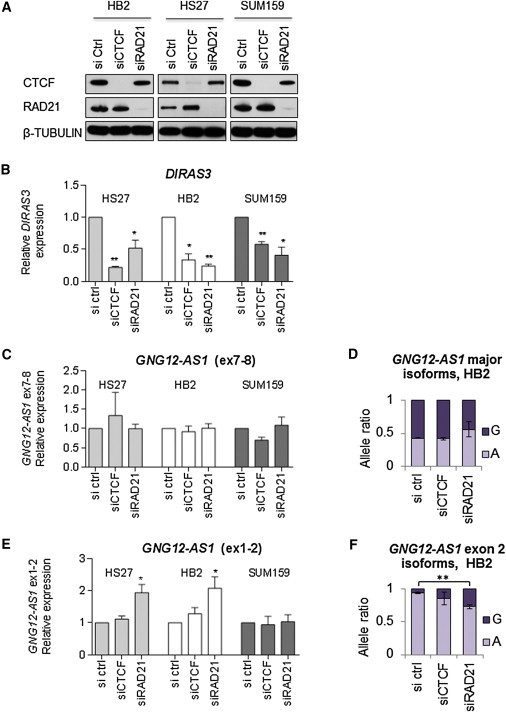
Imprinted gene clusters are regulated by long noncoding RNAs (lncRNAs), CCCTC binding factor (CTCF)-mediated boundaries, and DNA methylation. DIRAS3 (also known as ARH1 or NOEY1) is an imprinted gene encoding a protein belonging to the RAS superfamily of GTPases and is located within an intron of a lncRNA called GNG12-AS1. In this study, we investigated whether GNG12-AS1 is imprinted and coregulated with DIRAS3. We report that GNG12-AS1 is coexpressed with DIRAS3 in several tissues and coordinately downregulated with DIRAS3 in breast cancers. GNG12-AS1 has several splice variants, all of which initiate from a single transcription start site. In placenta tissue and normal cell lines, GNG12-AS1 is biallelically expressed but some isoforms are allele-specifically spliced. Cohesin plays a role in allele-specific splicing of GNG12-AS1. In breast cancer cell lines with loss of DIRAS3 imprinting, DIRAS3 and GNG12-AS1 are silenced in cis and the remaining GNG12-AS1 transcripts are predominantly monoallelic. The GNG12-AS1 locus, which includes DIRAS3, provides an example of imprinted cotranscriptional splicing and a potential model system for studying the long-range effects of CTCF-cohesin binding on splicing and transcriptional interference.


Figures

Figure 1
Figure 1
Organization of DIRAS3 and the GNG12-AS1 Locus (A) The organization of the entire GNG12-AS1 locus (chr1: 68,297,971–68,668,670 [UCSC genome browser hg19) shows CTCF binding sites (designated a–k), CpG islands, and the positions of SNPs for DIRAS3 and GNG12-AS1. The known exons of GNG12-AS1 are enlarged for clarity and marked 1–9. (B) Enlarged view of DIRAS3 and its surrounding region. Exon 2 of GNG12-AS1 is 11 kb downstream of DIRAS3, and exon 3 is 21 kb upstream. Differentially methylated DIRAS3-associated regions DMR1, DMR2, and DMR3 are shown. DMR1 corresponds to the DIRAS3 promoter, DMR2 corresponds to the transcription start site (TSS), and DMR3 corresponds to exon 2 of DIRAS3. Binding site CTCF-f corresponds to DIRAS3 DMR1, and binding site CTCF-e corresponds to DIRAS3 DMR3. (C) Schematic representation of imprinted DIRAS3. DIRAS3-associated DMRs are shown as lollipops (black represents methylated, and white represents unmethylated). CTCF binds only to the unmethylated DMR1. The arrow on the paternal allele indicates expression and direction of DIRAS3. Abbreviations are as follows: M, maternal allele; and P, paternal allele.
Figure 2
Figure 2
DIRAS3 and GNG12-AS1 Are Coexpressed in Several Tissues and Reduced in Breast Cancer (A) DIRAS3 expression in a panel of tissues and in cell lines. The dotted line marks the background DIRAS3 expression in cell lines with loss of imprinting. (B) GNG12-AS1 expression in tissues and cell lines. Expression levels were normalized to GAPDH. Error bars represent the SDs from at least three biological experiments. Because of the wide expression range, the y axis is split. (C) Nuclear localization of GNG12-AS1 in HB2 cells. U1 RNA is a control nuclear RNA, and RPS18 is a control cytoplasmic RNA. Values represent the median of three replicate experiments ± SD. (D) Coordinate reduction of DIRAS3 and GNG12-AS1 in normal breast (n = 72) and tumor breast (n = 36). ∗∗∗∗p < 0.0001.
Figure 3
Figure 3
GNG12-AS1 Is a RNAPII Transcript with an H3K36me3 Signature Characteristic of a Transcribed Locus (A) A schematic representation of the GNG12-AS1 locus shows the relative location of GNG12-AS1 exons (above the line) and the locations of primers used for ChIP analysis (bars below the line). (B) RNAPII enrichment occurred throughout the GNG12-AS1 locus in HB2 and SUM159 cells. Note the significant reduction of RNAPII enrichment at DIRAS3 for SUM159 cells. In the left panel, representative chromatograms for SNP analysis indicate biallelic enrichment in HB2 cells and monoallelic enrichment in SUM159 cells. (C) Enrichment of H3K36me3 in HB2 and SUM159 cells and representative chromatograms indicating allelic enrichment for SNP analysis. Error bars represent the SEM from three independent biological experiments for HB2 cells and three independent experiments for SUM159 cells.
Figure 4
Figure 4
GNG12-AS1 Transcripts Containing Exon 2 Are Monoallelic (A) GNG12-AS1 splice variants containing exon 2 in HB2 cells. The majority of these transcripts are expressed from allele A, as determined by cloning of PCR products and PSQ. These transcripts also contain exon 3. Rare transcripts with exon 2 but without exon 3 are produced only from allele G. (B and C) Allele-specific expression, analyzed by PSQ, of GNG12-AS1 major isoforms in cell lines and placenta (B) and allele-specific expression, analyzed by PSQ, of GNG12-AS1 isoforms containing exon 2 in the same cell lines and placenta (C). Error bars indicate the means ± SDs of three or more replicates. In (B) and (C), two different SNPs were assessed, and the results are therefore presented as alleles 1 and 2. The same SNPs were used in the assay of transcripts 1–9 (major biallelic transcripts) and transcripts 2–9 (monoallelic transcripts containing exon 2). (D) Maternal expression of GNG12-AS1 transcripts with exon 2 in two representative placenta triads (parents and placenta) indicates expression from the maternal allele. (E) Proportion of transcript variants in normal and cancer cell lines, as determined by qPCR. Relative abundance of the transcripts was normalized to GAPDH and related to expression of exons 7 and 8. n ≥ 3 independent replicate experiments.
Figure 5
Figure 5
Demethylation of DMRs Restores Imprinted DIRAS3 Expression in Breast Cancer Cell Line SUM159 and Reduces GNG12-AS1 Expression (A) Methylation of DIRAS3 DMRs in control (nontreated) and 5-aza-treated SUM159 cells. (B) Relative expression of DIRAS3, GNG12, WLS, and GNG12-AS1 in control and 5-aza-treated cells. Expression levels were normalized to GAPDH. Because of the large expression differences, the y axis is split. (C) Allelic expression of DIRAS3 in SUM159 cells in control and 5-aza-treated cells. (D) Allelic expression of GNG12-AS1 major isoforms in SUM159 cells upon 5-aza treatment. (E) Allelic expression of GNG12-AS1 transcripts containing exon 2 in SUM159 cells. Error bars represent the SDs from at least four independent biological replicates. The statistical significance of the individual bars is compared to their respective control bars; p < 0.05, ∗∗p < 0.01, ∗∗∗p < 0.001.
Figure 6
Figure 6
CTCF and Cohesin Binding at the DIRAS3 DMRs Regulates DIRAS3 Expression Cohesin is required for exon 2 skipping near the active DIRAS3 allele. (A) Immunoblots showing the efficiency of CTCF and RAD21 knockdown by siRNA in HB2, HS27, and SUM159 cell lines. (B) DIRAS3 expression levels decreased upon CTCF and cohesin (Rad21) knockdown in all cell lines. (C) Overall GNG12-AS1 expression levels did not change upon CTCF and cohesin (Rad21) knockdown. (D) Allelic expression of the GNG12-AS1 major isoforms did not change after siRNA-mediated CTCF and cohesin depletion in HB2 cells. (E) Expression of GNG12-AS1 isoforms with exon 2 increased in normal cell lines upon cohesin depletion, but not with CTCF depletion. Cancer cells were unaffected. (F) Allelic expression of GNG12-AS1 exon 2 isoforms in CTCF and cohesin-siRNA-treated HB2 cells. A significant change in allele ratio was found after cohesin depletion. At least three technical replicates were performed for each biological experiment. Error bars represent the SDs from at least three independent biological experiments. The statistical significance of the individual bars is compared to their respective control bars; p < 0.05, ∗∗p < 0.01, ∗∗∗p < 0.001.
Figure 7
Figure 7
GNG12-AS1 Expression and Splicing Model in Normal and Cancer Cells (A) In normal cells, GNG12-AS1 was expressed from both maternal (“M”) and paternal (“P”) alleles, and inclusion of exon 2 occurred on the maternal allele. (B) In cancer cell lines, GNG12-AS1 expression was inhibited on the paternal allele, and the lncRNA was predominantly expressed from the maternal allele. The expression of transcripts with exon 2 remained monoallelic from the maternal allele.

References

    1. Yu Y., Xu F., Peng H., Fang X., Zhao S., Li Y., Cuevas B., Kuo W.L., Gray J.W., Siciliano M. NOEY2 (ARHI), an imprinted putative tumor suppressor gene in ovarian and breast carcinomas. Proc. Natl. Acad. Sci. USA. 1999;96:214–219. - PMC - PubMed
    1. Wang L., Hoque A., Luo R.Z., Yuan J., Lu Z., Nishimoto A., Liu J., Sahin A.A., Lippman S.M., Bast R.C., Jr., Yu Y. Loss of the expression of the tumor suppressor gene ARHI is associated with progression of breast cancer. Clin. Cancer Res. 2003;9:3660–3666. - PubMed
    1. Dalai I., Missiaglia E., Barbi S., Butturini G., Doglioni C., Falconi M., Scarpa A. Low expression of ARHI is associated with shorter progression-free survival in pancreatic endocrine tumors. Neoplasia. 2007;9:181–183. - PMC - PubMed
    1. Lu Z., Bast R.C., Jr. The tumor suppressor gene ARHI (DIRAS3) inhibits ovarian cancer cell migration through multiple mechanisms. Cell Adhes. Migr. 2013;7:232–236. - PMC - PubMed
    1. Klingauf M., Beck M., Berge U., Turgay Y., Heinzer S., Horvath P., Kroschewski R. The tumour suppressor DiRas3 interacts with C-RAF and downregulates MEK activity to restrict cell migration. Biol. Cell. 2013;105:91–107. - PubMed

Publication types

MeSH terms